It’s official: the Alfred Wegener Institute Antarctic Neumayer-Station III is a meteorological observation station that’s been measuring air temperature and other magnitudes in Antarctica for 30 years, which is the period of time used to define climate for a region. The results are clear and indisputable. The AWI writes in its press release:
At the Neumayer Station it has not gotten warmer over the last 30 years.”
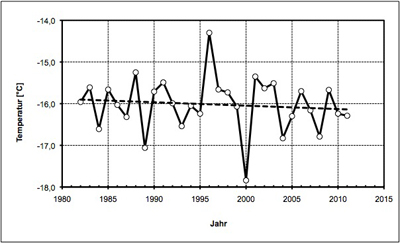
Note they avoid saying it got cooler. If the trend had been the opposite, the results would have been blasted out to the world in the most vivid terms. Annual mean temperature for the years 1982 to 2011 measured at the Neumayer-Station (all graphics come from the Alfred Wegener Institute):
According to the press release, the temperature station uses instrumentation that makes US climatological measurement system look like a meteorological junkyard. The Antarctic station uses a special type thermometer that is protected from the sun’s rays and has a sensitive platinum wire. The thermometer is 2 meters above the surface. Whenever a measurement is made, the surrounding air is set into turbulence and the measurement is then input into a computer. According to Director Gert König-Langlo:
We check the stability of the measurement system on a regular basis using calibration thermometers.
At the station the annual mean temperature over the last 30 years was minus 16°C. The year 1996 with a mean temperature of minus 14.3°C was the warmest of the last 30 years and the year 2000 was the coldest with a mean temperature of minus 17.8° Celsius.”
With all the concern over global warming gripping Europe, you’d think this would be all over the news. Nope! Not a peep of this cooling trend has appeared anywhere in the German news as far as I can tell. Unfortunately, the AWI did not offer any explanation as to why they have measured cooling. But it is quick to add:
This development is however a regional change and the measurement data from the Neumayer-Station III is in no way representative for global climate changes. ‘Only at the centre of Antarctica has it not gotten warmer. On the Antarctic peninsula on the other hand, the mean temperature has risen up to 3°C. We also observe a similar warming in the Arctic,’ says König-Langlo.”
I’ll now take the liberty to offer the AWI scientists a clue: perhaps ocean cycles and currents have something to do with it?
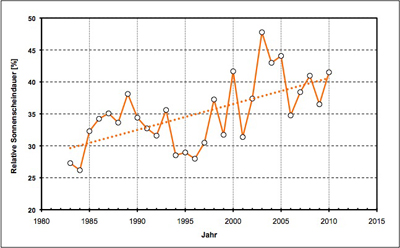
The Neumayer station also shows a powerful upward trend for the amount of sunshine:
Here, however, König-Langlo doesn’t hesitate to offer an explanation:
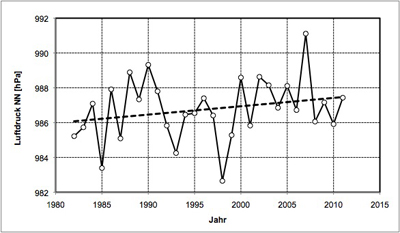
Our weather data shows that the part of Antarctica where our station is located is increasingly influenced by high pressure. We have clear skies more and more often. And wherever cloud cover is missing in polar regions, heat gets radiated out and the lower air layers cool.”
Polar temperatures depend a lot on cloud cover? A couple of days ago it was soot. Sometimes it’s aerosols. Other times it’s all CO2. I wish these scientists would make up their minds for once! But it’s never the sun, never the oceans (though without them there would be no climate to change). We keep hearing of different warming drivers, but the numbers never add up because nobody dares to scale back CO2 is as a driver. In the end the scientists look absolutely untrustworthy with their explanations – in layman’s terms they make themselves look like they’re FOS.
When you add their numbers up, the result says they absolutely are.
Near the end of the press release comes the pitch for more funding to conduct more research.
Why the temperature curve of the Neumayer-Station differs so much from the other research stations on the Antarctic peninnsula is still the object of current research. “Further measurements and research efforts are necessary to clear up the matter,’ says Gert König-Langlo.”
Dear Dr. König-Langlo, please order this book: Die kalte Sonne by Drs. Sebastin Lüning and Fritz Vahrenholt. Delivery in February.
Or read: https://notrickszone.com/2010/11/10/a-wind-in-antarctica/


Once again we see that clouds may play a greater role in surface temperatures than CO2.
Great post. The MSM should run with this….
I can save them a lot of time.
https://notrickszone.com/2010/11/10/a-wind-in-antarctica/
[…] Wegener Institute release. Interestingly cloudiness is again associated with temperature trend Alfred Wegener Institute Neumayer Station III: Antarctic Cooling Over The Last 30 Years! By P Gosselin on 16. Januar […]
OT, but related to cold – as in Cold Fusion:
Signore Rossi fails to produce zero point energy (or some such):
http://www.smh.com.au/environment/energy-smart/more-fizzer-than-fusion-so-dicks-not-energised-20120114-1q0fv.html
Strange how the spirits never materialize when there are skeptics about.
Most LENR researchers favor this theory at the moment.
http://www.i-sis.org.uk/Widom-Larsen.php
This article mentions SPAWAR experiments that started right after Pons/Fleischmann.
http://www.i-sis.org.uk/coldFusionCondensedMatter.php
These results fit Svensmark’s theory: less cloud cover means warmer temperatures most places, cooler temperatures at the very center of the Antarctic continent. The greenhouse theory suggests the opposite: that in the middle of the Antarctic, where there is a minimum of water vapor redundancy with C02, C02 should have the greatest warming effect. So cloud cover, not C02, is the apparent driver. Since cosmic rays affect cloud cover, this may trace back to cosmic rays.
Would anyone care to open a betting session as to when Svensmark will be honoured with a Nobel Prize? The quesiion is not if, but only how soon (preferably in tandem with Nir Shaviv).
CO2 leads to risky behaviour in Clownfish.
Article comes complete with fraudulent photo.
http://www.newscientist.com/article/dn21355-carbon-dioxide-encourages-risky-behaviour-in-clownfish.html
When T is decreasing, then the MPH (Mobile Polar Highs) are increasing (in frequency and strengh).
I recommand you to read this book from the french climatologist Marcel Leroux :
“Dynamic Analysis Of Weather And Climate” (editor : Praxis).
I hope it will be useful for you.
Best Regards
Grüss Gott
For a short presentation of the MPH model, read (in French) this document :
http://www.biokurs.de/treibhaus/180CO2/Echanges-meridiens-Chang-clim.pdf
I guess your acronym FOS means “forever on sale”. There are many choices, but I doubt you meant French Onion Soup or Forward Operating Station.
[…] sources. C3: Antarctica: IPCC Proven Conclusively Wrong By Newest Research – South Pole Cooling Alfred Wegener Institute Neumayer Station III: Antarctic Cooling Over The Last 30 Years! Antarctic ice is growing, not melting away | News.com.au Terra Forming Terra: Antarctic is […]
[…] to be? So, they’re guessing? There’s only one problem: most of Antarctica has been cooling over the last 30 years, despite rising CO2 levels. But, Warmists have looked into their crystal balls and read their tea […]
Compared to the age of Earth, the human race has been “on it” as a cup of water is to the Pacific Ocean. There have been many natural climate changes over millions of years. When mankind becomes extinct: and we will, it’s inevitable, the Earth will still have time to revert to “natural weather patterns” before our Sun goes supernova. In other words, mankind is so arrogant we are humorously pathetic…