By Ed Caryl
This is a follow-up article on GHCN and GISS changes to the temperature records for Reykjavik, Iceland.
Figure 1: Reykjavik, Iceland: Photo from Christian Bickel
We now know that GHCN has changed data set versions from version 2 to version 3. Each of those versions has a history. Version 2 was made up by combining records from closely related stations, then “homogenizing” the combination to produce a data “product.” Version 3 presumably started from the Version 2 data set with revisions prompted by additional data. That presumption may not be correct.
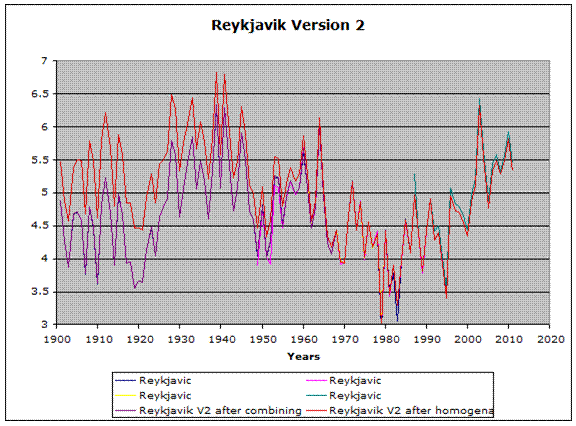
As a first step, all the data from the Version 2 database were downloaded from GISS. There were four sets of station data, covering various years, but only one set that covered the period from 1901 to 1948. These are all plotted together in Figure 2, along with the combined dataset, and the “homogenized” result.
Figure 2: This is all the Reykjavik Version 2 data.
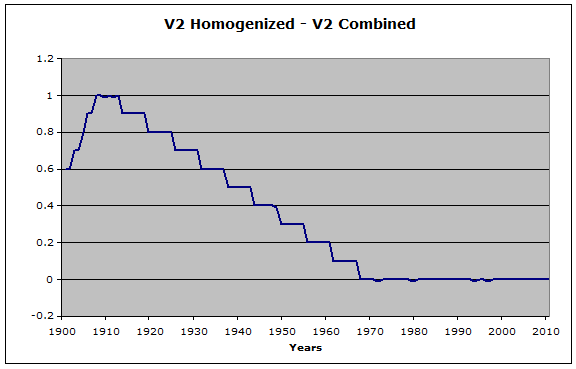
Three of the original data sets lie atop each other for the period from 1949 to the present. One set (the 4th one) is slightly warmer (!) in the years from 1982 to the present, and was ignored. However the homogenized data differs from the original data by a large amount early in the record, tapering down to no difference in the present, warming the past. Figure 3 is that difference.
Figure 3: This is the Version 2 homogenized data minus the Version 2 Combined data.
Each of those distinct steps in Figure 3 is exactly six years long. This arbitrary pattern cannot be anything but deliberate. It cannot be based on site changes, equipment changes, or any other factor that might change the real temperature. This is artificial.
The Iceland Meteorological Office has not moved since being built at this location in 1920. There may have been instrument changes, but no position changes.
GHCN describes their homogenization process:
Many surface weather stations undergo minor relocations through their history of observation. Stations may also be subject to changes in instrumentation as measurement technology evolves. Further, the land use/land cover in the vicinity of an observing site may also change with time. Such modifications to an observing site have the potential to alter a thermometer’s microclimate exposure characteristics and/or change the bias of measurements, the impact of which can be a systematic shift in the mean level of temperature readings that is unrelated to true climate variations. The process of removing such “non-climatic” artifacts in a climate time series is called homogenization.”
But Version 2 has been abandoned. We now have version 3. Figure 5 is a plot of both original and homogenized versions of both Version 2 and Version 3.
Figure 5: This is a plot of “original” and “homogenized” datasets for both Version 2 and Version 3.
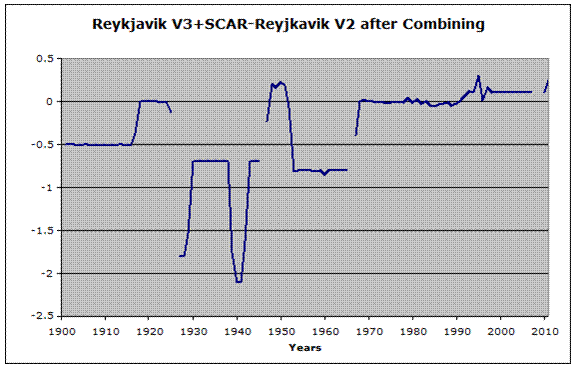
Note that in Figure 5, from 1901 to about 1970, there is little agreement between the four datasets. Figure 6 is the difference between Version 2 after combining, and Version 3. (SCAR is not a factor in this data. SCAR is the acronym for Scientific Committee on Antarctic Research. No Antarctic data was harmed in the production of Reykjavik data).
Figure 6: This is the difference between Reykjavik Version 3 and Version 2 after combining the data from 4 datasets.
It is not clear why these differences exist. Prior to 1946, there were no nearby stations to compare. The Keflavik airport station did not produce data until 1949, and then the temperatures there agree very well with the original data from the downtown stations. The variances are within a few 100ths of a degree. The warm years around 1940 are wiped out in Version 3. But the changes don’t end there.

Figure 7. This is the difference between Version 3 before and Version 3 after GISS homogenization.
In Figure 7 we see the arbitrary and regular stair-steps again. But note that the steps are different from the steps in Figure 3, and they are in addition to the changes by GHCN seen in Figure 6. These changes put back some (but not all) of the cooling that was arbitrarily introduced in Figure 6. The final result is the product of two homogenizing
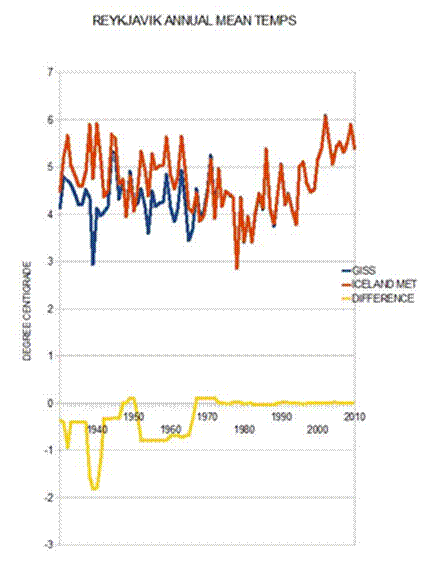
processes, the first by GHCN, and the second by GISS. The result of all this is the graph that Paul Homewood produced (below) and the blue and bold-red traces in Figure 5.
The GHCN Version 3 data was supposed to be superior to version 2, filling data gaps, etc. If this is so, then why does Version 3 have gaps where Version 2 does not? Version 3 has gaps for 1926, 1946, 1966, and 2008 – 2009. The original data (Version 2 raw) does not have these gaps.
Figure 8: This is from Paul Homewood’s article How GISS has totally Corrupted Reykjavik’s Temperature, used by permission.
There have been many changes like this to the temperature records. Here is a list of stations that have had arbitrary stair-step or other changes, and the links to articles that describe them:
Darwin, Australia, here, by Willis Eschenbach.
Central Park, New York City, here, by E. M. Smith, the Chiefio.
Prague, Czech Republic, here, and here, by John O. Sullivan.
Russia, (scroll to the bottom for the article) here, RIA/NOVOSTI.
Matanuska Valley, Alaska, here, Willis Eschenbach.
Ostrov Dixon, Ostrov Kotel, Russia; Barrow, Alaska, and others, here, Ed Caryl
Many of those in the above list were changes imposed in version 2. We should revisit those stations using version 3 data. So many stations, so little time…


I have also noticed differences in Lisbon/Portugal. In this case between ECA & HadCRUT3.
It is in Portuguese, but the graph is clear:
http://ecotretas.blogspot.com/2009/12/receita-de-tratamento-de-temperaturas.html
Good work Ed. I am convinced that the surface record became severely corrupted during 1980-2000. If you say ‘So many stations, so little time’ concentrate on stations at extreme latitudes.
Mindert,
Please email me re: Het leven van een veenarbeider
hkalsbeek@cogeco.ca
Just to clarify, the GISS homogeneity adj is to allow for UHI and nothing else. That is why the adjustment produces a cooling trend.
In Reykjavik, 1940 temperatures have been adjusted up by 0.6C to allow for this. (The adjustment is the same under both V2 + V3). Whether 0.6c is enough is another matter!
They are not the same. Figure 3 and figure 7 are different. And the big inning of each is a steep warming. And both flat-line in recent years.
The 1940 adj is still 0.6C, but it appears that the profile since then has changed.
Adjustment of raw data, except for typing errors, is fraud but perhaps I live on another planet.
I also checked with the Iceland Met about station moves etc. They had this to say :-
“No changes have been made in the Stykkisholmur series since about 1970,
the Reykjavík and Akureyri series that I sent you have been slightly
adjusted for major relocations and changes in observing hours.”
Also
2. Were there any station moves or changes in the way observations
were taken for
(a) Stykkisholmur in 1965
There were minor relocations at Stykkishólmur in May 1964, May 1966 and April 1968. None has been found important at the 0.2°C level.
(b) Reykjavik in 1939
No known changes in 1939.
The Reykjavik station has been moved repeatedly, after 1920, in October 1931, December 1945, January 1950, May 1960, November 1973 – no change in location since then. The most serious relocations were the 1931 and 1945 ones. During this period the station was located at a rooftop in the town center.
Humm. The report I cited above then lied. But those moves don’t line up with the steps in either homogenization. I believe Iceland Met. I don’t believe GISS.
Following up claims that we’d just had the hottest summer (evah!) here in Western Australia, I decided to check the data coming out of a nearby agricultural research station.
Minimum temperatures increased by almost 2°C within a year or so … likely due to expansion of a nearby water treatment plant; expansion of an adjacent quarry and paving the area around a nearby LNG terminal. Maxima increased substantially less than the minima.
It’s important not to wipe out the “step changes” in temperature records by trend-lines spanning decades. Extrapolation ignores the observation that local changes to only alter the plateau.
“Homogenization” is largely bogus; based largely on guesswork in most cases.
If a station is to be moved from A to B, then for homogenization to be somewhat valid, one must establish the record at B before shutting down A so that there’s a significant temporal overlap from which the actual differences between locations can be determined.
The data from a station move must be “spliced” into one, even with the knowledge of the differences because those differences are only known over the period of overlap. It is not valid to extrapolate them over the entire history of location A.
Data from locations A and B can both be analysed as distinct data sets.
There are two different ‘homogenisations’ going on here. One is done by GHCN, and can be seen by looking at the unadjusted and adjusted data on the GHCN website. This is effectively what you are seeing in your fig 6. The other is done by GISS, on top of the GHCN adjusted data. This alone is an absurd state of affairs. As you say, the GISS homogenisation partially corrects the errors introduced by GHCN!
Another complication is that GISS say they are using GHCN v3 but there are several versions of this, and GISS don’t say which they are using. GHCN introduced v3.0.0 in May 2011. In this version, which you can find in the archive folder on their ftp site, the Reykjavik data is unadulterated except for a couple of gaps. In Nov 2011 they released v3.1.0, which they claimed had ‘minor corrections’ – untrue since it is this version that has the erroneous adjustments seen here and at Paul H’s blog. Then on Feb 7 they changed it again, to v3.1.1, with some slight changes. [presumably, GISS just use whatever the latest version from GHCN is].
On Jan 17 I wrote to GHCN raising some of these issues (including the gaps in 1926, 1946, 1966 that you mention) and they have not replied except for a content-free email saying ‘stay tuned for further updates’. Despite this remark, they did not even inform me about the new version on Feb 7 – I had to find it myself by looking on their site.