By Ed Caryl
Is the world warming, cooling, or is the global temperature standing still? What does the future hold? Do past trends mean anything for the future? What period are we examining?
For the purposes of this article, several short and long periods will be examined, 15, 150 and over 1000 years into the past, and predictions for 40 to 70 years into the future. 15 years is actually a very short period in light of the fact that the AMO and PDO tend to vary in 60+ year cycles. We are currently near or just past the peak of both of these ocean cycles. The 1970’s cool period was 40 years ago. The 1980’s and 90’s were a period of warming. The peak was reached with a crescendo in the 1998 super-El Niño year. Here is a chart beginning January 1998.
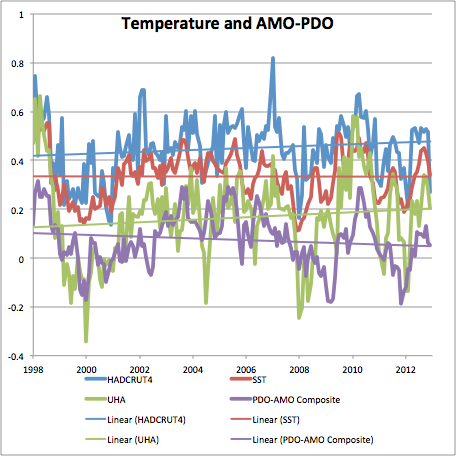
Figure 1 is temperatures from HADCRUT4, sea surface (SST), and UHA, plotted with a combination of AMO and PDO indexes. All data downloaded from WoodForTrees. Linear trend lines added.
The linear trends for all the temperature series for the last 15 years are nearly flat. Some are rising slightly; some are falling slightly. All are, statistically speaking, flat.
Why?
We are at a peak of a 60-year temperature cycle. Many others have described this: here, here, and here, among others. Temperatures are flat because the only way from here is down, up has ended. If you look at history, this is easy to see. Here is the history of AMO and PDO, the two controlling ocean cycles.
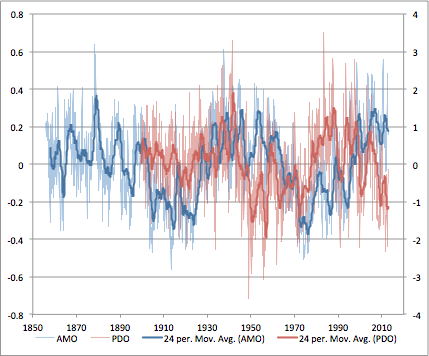
Figure 2: The Atlantic Multi-Decadal Oscillation (AMO) and the Pacific Decadal Oscillation PDO).
If these are combined, Figure 3 results.
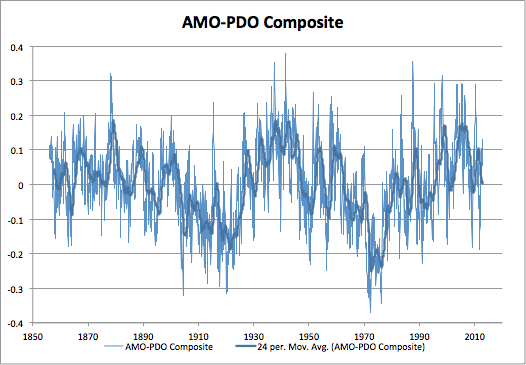
Figure 3, AMO and PDO combined. Data from the last 15 years was used in Figure 1.
The thing to remember about the AMO and PDO indexes are that they are de-trended. Any long-term warming or cooling beyond their 60-year cycles are not reflected in these indexes. But we can see in Figure 3 the cooling period around 1910, the rapid warming in the 1920’s and 30’s, the cooling in the 1970’s, and the warming again in 1980’s and 90’s. We can also see that the warming has reached a peak and is set to switch to cooling. If the cycle repeats as it was twice before, the bottom of the next cooling will occur in the 2030’s.
The long term trend is set by the longer solar cycles. Here is the solar activity, calculated from the Beryllium 10 isotope created by cosmic rays at the top of the atmosphere in response to solar magnetic activity. There are 3 different calculations shown, along with the Be10 anomaly on which they are based.
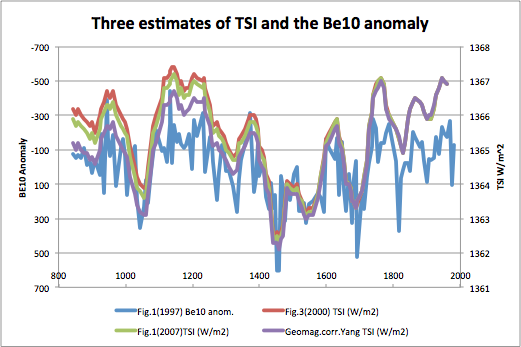
Figure 4 has three plots of TSI and one of the Be10 anomaly on which they are based. The Be10 data has been inverted to match the TSI data. (Less Be10 = higher TSI) Source NOAA here.
The minimums seen in the TSI and Be10 data all correspond to well-known historical warm and cold periods. These are:
– Oort minimum (see Medieval Warm Period) 1040 to 1080
– Medieval Maximum (see Medieval Warm Period) 1100 to 1250
– Wolf Minimum 1280 to 1350
– Spörer Minimum 1450 to 1550
– Maunder Minimum 1645 to 1715
– Dalton Minimum 1790 to 1820
Table 1 is a list of the minimums seen in Figure 4 from left to right. Links are to the Wikipedia articles.
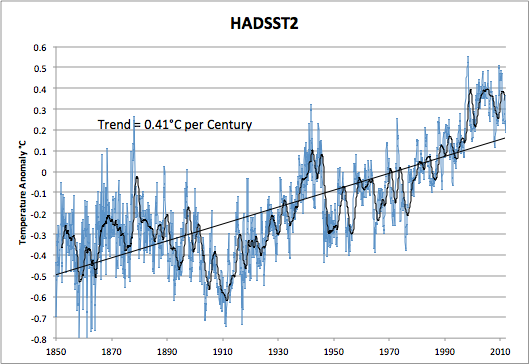
Figure 5 is the Hadley sea surface temperature (SST) dating from 1850.
In Figure 5, we can see the cooling in 1910 and 1950-70, as well as the 20’s and 30’s warming and the 80’s and 90’s warming. The current halt to the warming is also seen.
The TSI data resolution was 6 or 7 years, one data point for each half-solar-cycle. I reduced the SST data to the same resolution by averaging the data for 6 years prior to each data point, and then plotted SST and TSI together. The TSI data based on the Beryllium10 anomaly ends at 1982.
TSI sets the long-term trend for temperature. For temperature, I have used the Hadley HADSST2 data going back to 1850. Here is that chart:
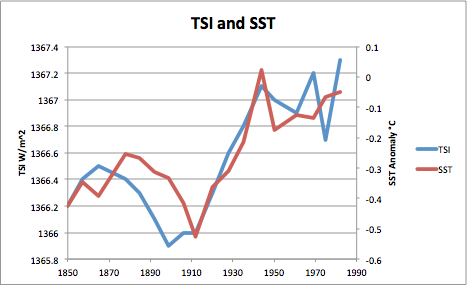
Figure 6 above is TSI and SST plotted to the same resolution.

Figure 7 is a scatter diagram of the Sea Surface Temperature versus TSI plotted in Figure 6.
Notice the long delay on SST cooling in the late 1800’s in Figure 6. The delay seems to be one whole solar cycle of 11 to 12 years. There seems to be little or no delay on warming in the early 1900’s. The TSI data is a bit more than one solar Wolf-Gleißburg cycle in length, the peaks coming in 1865 and 1982. From here, the solar cycle is down. The statistics are clear: The slope in Figure 7 is 0.2875°C per W/m2 of TSI. The R2 value is 0.712, R = 0.844, and the p value is 0.00001. If there were no lag in cooling after a drop in TSI, the R2 value would be even higher. It is clear to me that long term, the sun is driving temperature.
We are now moving into a quiet-sun situation. Projections are for sunspots to completely disappear late in this decade. If TSI drops as low as it did in the Maunder or Spörer Minimums, global temperature will drop by 1 to 1.3°C in 20 to 30 years, into another Little Ice Age that might last for 20 to 40 years. Luckily, the drop should be slow enough that perhaps all the CAGW advocates will be gone or converted in time for us to prepare and adapt.


Off Topic, but I didn’t know where else I should post it.
Interesting article in the Spiegel about conflicts between the Green Party and the environmentalists
The Price of Green Energy: Is Germany Killing the Environment to Save It?
http://www.spiegel.de/international/germany/german-renewable-energy-policy-takes-toll-on-nature-conservation-a-888094.html
Thanks, will definitely take a good look at this.
BTW: The answer of course is YES!
Pretty depressing. Look at how everything in the article is judged under the coordinate system of “nature protection” when in fact nearly all of Germany is cultured landscape. An entirely deluded society. With the media it deserves.
And under this perspective, all the infighting between Greens, Greenpeace and CDU (notice how the SPD vanished from the picture) are just parts of a Green dialectic and will bring us exactly nowhere, the only thing we know is that we will continue paying several of these movements whether we want it or not.
And pay them dearly we will.
[…] Maar of het nu gebeurt of niet… wat de mensen van Meteoconsult er niet bij zeggen is dat de verbazing eigenlijk helemaal niet nodig is. Want op basis van de zonne-activiteit is het logisch dat we een nieuw meteorologisch regime binnengaan momenteel. Een regime dat uitzonderlijker zal zijn dan de 30-40 jarige golf van AMO+PDO die de meteorologen van Meteoconsult zich wellicht kunnen herinneren. We gaan snel lager uitkomen dan de dip van eind zestiger, begin zeventiger jaren want de zon doet nu dingen die sinds 1790 niet meer zijn voorgekomen. Laat mij het dan maar zeggen als zij het niet willen doen. Lees meer hier. […]
Very good article, Ed. Figures 6 and 7 answer my questions a few days ago.
Thank you for this interesting article. I’m looking at AMO and PDO Diagram and I’d expect triggering into a very cold phase that will happen between 2020-2030. That means very severe winters in a row for many years. I hope it could end the AGW nonsense.
Your charts and text show a “PDO-AMO” Composite. Is that a dash, a minus sign, or what exactly is this?
The AMO and the PDO are not defined in the same way. At least that is what Bob Tisdale has written:
http://bobtisdale.wordpress.com/2011/06/08/on-the-amopdo-dataset/
The post is nearly 2 years old and the charts are not for the same years as yours, so I can’t see how the lines correspond or not. Anyway, the PDO is not a measure of temperature. It is a measure of a spatial pattern. A very simple analogy is something like the eccentricity of an ellipse. In the case of the PDO, the + and – are mathematical outcomes and the + does not represent positive temperatures nor the – (minus) negative temperatures.
A “composite” of the AMO and the PDO seems not to make any sense. If you have defined this in some meaningful way, you should explain.
You also say: “. . . AMO and PDO, the two controlling ocean cycles.”
The PDO is a number derived from a small area in the North Pacific. The big movers in the Pacific Ocean are El Niño/La Niña–Southern Oscillation.
I don’t disagree with what you are trying to do. However, it isn’t clear to me how this “composite” contributes to your work.
John,
It’s just a dash. And I agree that combining them is dubious science, except that they both affect temperature. They have a combined affect on temperatures all across the northern hemisphere, most pronounced in the Arctic. I took the indexes, scaled them to the same number range, added them together, and divided by two. Yes, Bob Tisdale will have a fit. But if you look past all the noise in the two indexes, the sun is driving both, with just slightly different delays, and their short term cycles add to the longer solar cycles.
I am trying to suggest, as is Bob Tisdale, Willis Eschenbach, Steve Goddard, Tallbloke, and all the others on Pierre’s sidebar blog roll, that climate science needs to get off the “CO2 drives everything” meme, and look in some other directions. If refuting me requires them to THINK, then we can get somewhere.
Thanks for the response, Ed.
I’ve been in favor of getting off the “CO2 drives everything” meme for years. We got a high speed connection in Sept. 2008 and I soon found WUWT, CA, and Jennifer Marohasy (she posted regularly then). That was my start with CAGW. With connections to the local university I was given almost new physics and chemistry texts. Those provided background and terminology helpful for searching the internet. After many hours of work (training in those subjects ended in 1964) I convinced myself that CO2 was not the headlines-villain Hansen and Gore claimed.
So keep pushing new ideas. Again, thanks.
“Is the world warming, cooling, or is the global temperature standing still?”
The main climate period of about 900 years with three maxima over several hundred years has had its first maximum in the last 16 years.
“What does the future hold? Do past trends mean anything for the future? What period are we examining?”
Because the relevant climate periods are controlled by solar tide functions from known planets, world climate can be forecast for 1000 years with a resolution of month. Because all relevant solar tide functions have its own periods, it is not possible to speak on one period.
You can compare your Figure 4 with the sum of six relevant solar tide functions:
http://www.volker-doormann.org/images/ghi6plus_moberg.gif
Additional graphs for fun.
http://www.volker-doormann.org/images/16_year_stagnation_.gif
http://www.volker-doormann.org/images/ghi_23_ghi2_patzelt_sp1.jpg
http://www.volker-doormann.org/images/down3.gif
http://www.volker-doormann.org/images/sea_level_vs_solar_tide_1.gif
http://www.volker-doormann.org/images/uah_temps2013r.gif
http://www.volker-doormann.org/images/ippc_ar5draft14.jpg
http://www.volker-doormann.org/images/moberg_sonne.gif
http://www.volker-doormann.org/images/metoffice_model_4.jpg
http://www.volker-doormann.org/images/had4_minus_oni.gif
http://www.volker-doormann.org/images/ghi_11_vs_solar_neut5.gif
http://www.volker-doormann.org/images/solar_neutrino_vs_oni.gif
http://www.volker-doormann.org/images/cycles_10kb.gif
http://www.volker-doormann.org/images/ghi_11_had1960.gif
http://www.volker-doormann.org/images/solar_fig_3.gif
http://www.volker-doormann.org/images/ghi_23_edwards_2b.gif
http://www.volker-doormann.org/images/ghi_pub_fig2.gif
V.