A History of Global Temperature
By Ed Caryl
We have somewhat reliable global scale land surface and sea surface temperature measurements since about 1880. We have lower troposphere satellite temperature measurements since 1979. We have ice core CO2 measurements and real atmospheric CO2 measurements that overlap and agree at the overlap for this time span. There is general agreement that CO2 was not responsible for warming before World War II. Here is a plot of that history.
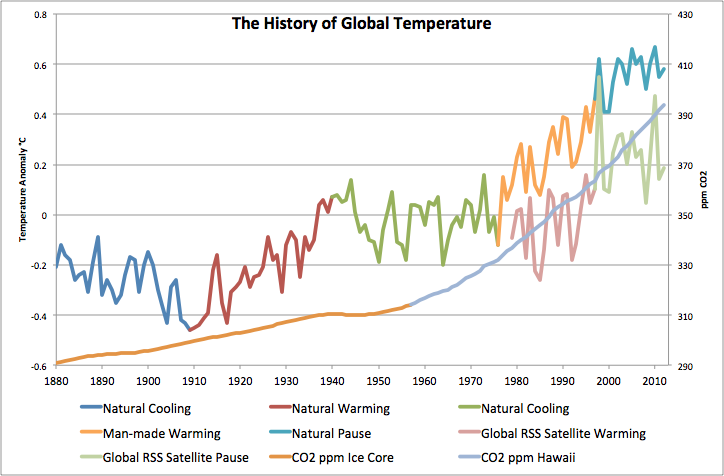
Figure 1 is a plot of the history of global temperature since 1880, along with the atmospheric CO2 concentration. The various cooling and warming periods are color coded.
Figure 1 plots the global temperature according to GISS. There are two warming periods, two cooling periods, and one flat trend period: the current pause. During this entire 133 year span, CO2 has been rising steadily, for the first half at about three parts per million per decade, and during the last half at about four times that, an average of about 13 ppm per decade. It is generally recognized that the cooling and warming from before 1880 to 1976, a century span, could not have been related to CO2. Yet it is claimed that the brief 20-year warming from 1977 to 1997 was completely due to man’s use of fossil fuel and the resulting 30 ppm CO2 increase and that somehow the 22 ppm increase from 1940 to 1976, and the additional 30 ppm increase since 1997, did nothing.
The 1977 to 1997 warming is also recorded in the satellite measurements, but has a lower amplitude than the surface measurements. The satellite measurement in the last 16 years indicates flat temperatures or even a slight cooling. The case for CO2 caused global warming is restricted to one 20-year period in the last 133 years. What about the 80 years of cooling or flat temperature response? What was responsible for that? There are other, much more logical explanations than the variance of CO2.
Here is another plot, like Figure 1, but proposing another cause for temperature fluctuations.
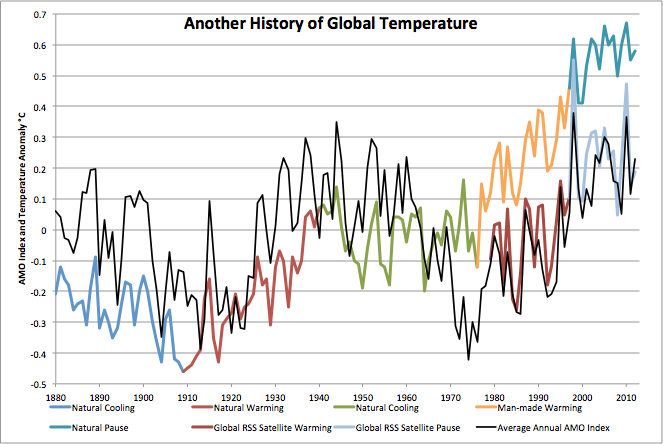
Figure 2 is a plot of the history of global temperature since 1880, along with the Atlantic Multi-decade oscillation (AMO) in black. The various cooling and warming epochs are color coded.
Note that in Figure 2 the number of fine details that match between the AMO and year to year temperature variations. Note also that when the AMO declines the temperature declines, and when the AMO is increases the temperature increases. The AMO is a de-trended index based on sea-surface temperatures in the North Atlantic, so it will not show the rising temperature trend in global temperature as a whole. But it does reflect the cyclic nature of global temperatures. Also, because the AMO cycle is roughly 66 to 70 years, a down-turn in temperature is indicated for the next 35 or so years.
There is currently much discussion of the solar influence on temperature. We know that historically recognized minimums in solar activity have coincided with socially disruptive cooling, crop failures, famines, plagues and iced-over rivers and canals. The Maunder Minimum of the 17th century is the best known, but there have been others.
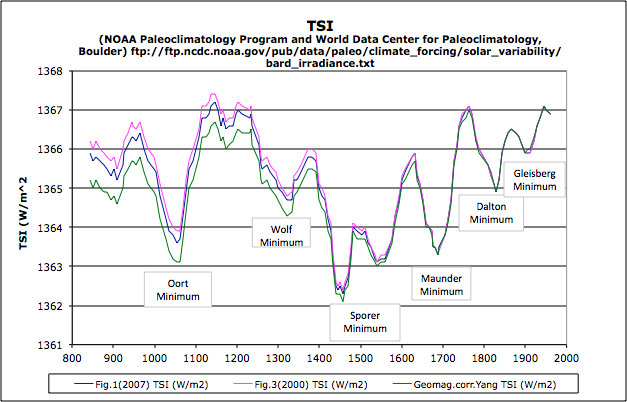
Figure 3 is a plot of reconstructed TSI data from Beryllium 10 isotope data from ice cores.
Figure 4 is a table of minimums and maximums with dates for beginning and end of each recognized event.
Next is a plot of temperature over that same period from the year 800. Note that the Spörer, Maunder, and Dalton Minimums together are responsible for the Little Ice Age from 1450 to 1850 with minor remissions. The Medieval and modern warming is due to solar activity.
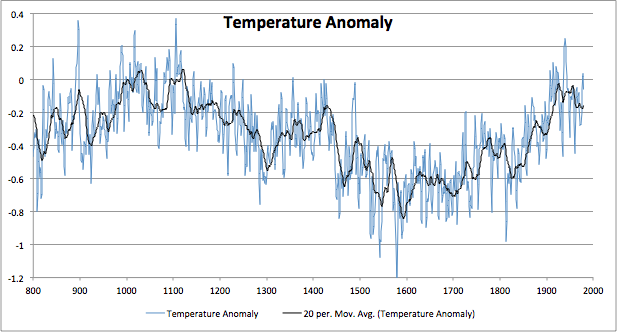
Figure 5 from Moberg et al 2005, found here.
We can expand the solar influence on the most recent times to the same scale as Figure 1.
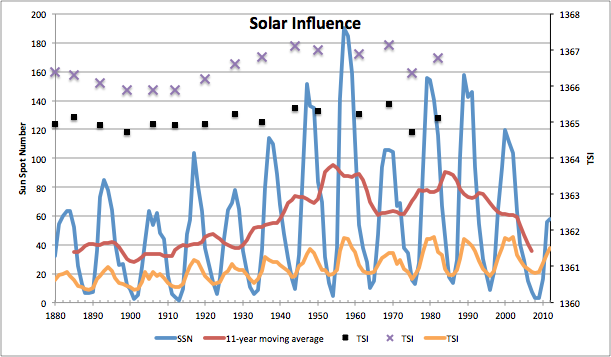
Figure 6 is a combination of (blue and red, left scale) the sunspot count with an 11-year moving average, and two TSI estimates based on Be10 studies (purple and black, right scale, source link in figure 3 title) and another study using sunspot and satellite radiance measurements (orange, right scale).
In Figure 6, the Gleisberg minimum is discernible at the turn of the 19th to 20th century, as is the unnamed drop in temperature in the 1960’s and 70’s. Solar activity and ocean cycles produce the warming and cooling periods seen in Figure 1 and 2. The “pause” since 1998 is due to reaching a peak in the AMO/PDO cycle and a reduction in solar radiance. Ocean cycles alone will force the next 30 years of cooling. As many others have repeatedly stated in this blog and elsewhere, this cooling could be extended and deepened by a new solar minimum. This will be called the Landscheidt or Eddy minimum.
Clearly ocean and sun drive temperature
CO2 has not been, and will not be, the driver of temperature. Clearly ocean and solar radiance cycles drive temperature, and then temperature (short term) and fossil carbon use (longer term) drives CO2.


It must be in the air today!
http://www.forbes.com/sites/peterferrara/2013/05/26/to-the-horror-of-global-warming-alarmists-global-cooling-is-here/
Lief Svalgaard, over at WUWT, calls temperature and solar cycle comparisons astrology! Lief maintains that he cannot see any clear evidence that ties global surface temperature to solar activity.
This topic, solar impact of the sun on the earth’s temperature. is still not settled and consensus science. What is required and what will convince these people?
Time.
[…] Of Historical Data Clearly Points To One Conclusion: Natural Factors Are Dominant – See more at: Analysis Of Entire Inventory Of Historical Data Clearly Points To One Conclusion: Natural Factors Ar… We have somewhat reliable global scale land surface and sea surface temperature measurements since […]
Even the “brief 20-yr warming period” you cite is an artifact of endpoint selection. It is really a step change around 1998-9. 2 years, not 20.
That is mostly true for the satellite record. A lot of the warming in the surface record is artificial, put there by “adjustments” and UHI. A lot of the anthropogenic warming was done with furnaces, a pencil and a computer. But there was a step change with the super El Niño of 1998. But what happened after that change is strange. I will address that in an upcoming article.
“Clearly ocean and solar radiance cycles drive temperature, and then temperature (short term) and fossil carbon use (longer term) drives CO2.”
Fossil carbon use has an insignificant effect on atmospheric CO2. The rate of change of CO2 in the atmosphere is affinely related to temperature.
Both the slope and the variability match with the same scaling factor. The rate of emissions also has a slope, but since the temperature slope already accounts for all or most of that component of the rate of change, there is little room left for human influence.
The relationship extends 55 years into the past, i.e., for as long as we have had reliable CO2 measurements, so this is no short term phenomenon. The rate of change of CO2 has stalled, in lockstep with the temperature stall. If, as appears likely, temperatures start to fall in the near future, if they are not already doing so, then this divergence is going to become very pronounced. I recommend you keep on eye on it, if you doubt what I am saying. It will become evident to all soon enough.
I agree with every word. I stated that fossil fuel use drives the long term rise because I cannot prove the contrary. I believe it does not, but that borders on religion.