IPCC 1990: “No convincing evidence that sea level rise accelerated in the 20th century”
By Dr Sebastian Lüning and Prof Fritz Vahrenholt
(Translated, edited and condensed by P Gosselin)
In recent posts we examined sea level rise, and in our last segment here we will look at the current sea level rise from a historical context and projections for the future.
Last 180 million years
On a geological scale, sea level over the last 180 million years was higher than it is today about half of the time (Figure 1).
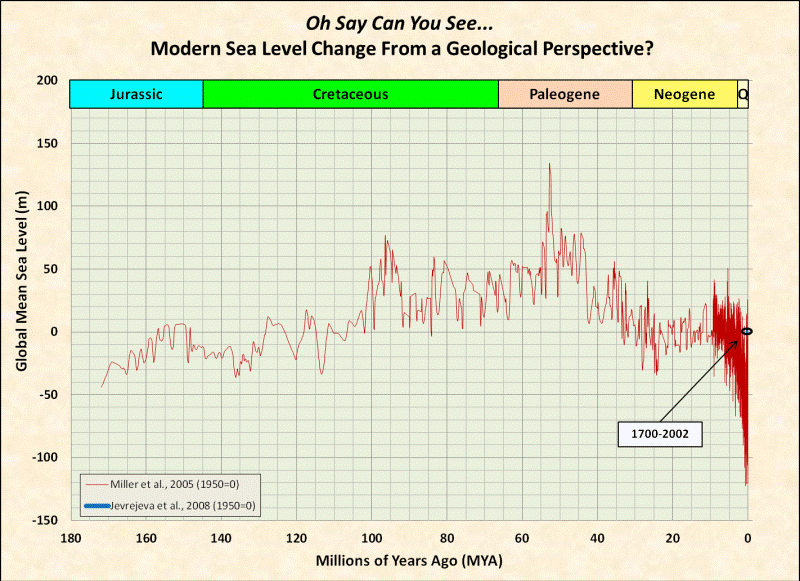
Figure 1: Seal level over the last 180 million years. Source: David Middleton.
The last 12,000 years
Since the end of the last ice age, we see a rapid rise of more than 10 mm per year until about 8000 years ago. Then came a slowdown 4000 years ago (Figure 2). Today’s sea level rise of 1-3 mm per year is what we are seeing at the end phase of this interglacial period.
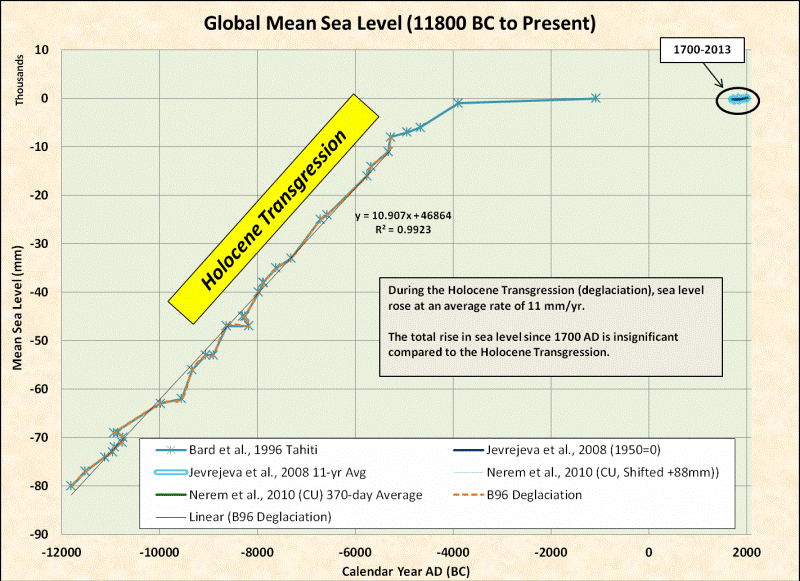
Figure 2: Sea level rise over the last 14,000 years. Source: David Middleton.
Today we find ourselves deep into a post-ice age interglacial warm period. During the last ice age the sea level was 120 m lower than today’s level. During the last interglacial, the Eem interglacial of 126,000 to 115,000 years before present, sea level was up to 9 m higher than today – without any help from man. This has been shown by a number of studies (Dutton & Lambeck 2012 in Science, Muhs et al. 2012 in Quaternary Research, O’Leary et al. 2013 in Nature Geoscience).
Last 300 years
The overall general trend shows cyclic behavior that follows the rhythm of warm and cold periods. Ice increased during the Little Ice Age, and so sea level rise stopped (Figure 3). During the transition to the current Modern Warm Period, which began around 1850, sea level began to rise once again and reached its top speed by 1920. The overall speed has not changed in the last 100 years, and thus it is difficult to see any evidence of a man-made impact in this development. There was a rapid increase from 1860 to 1879, but because industrialsation was barely beginning, the cause cannot be man-made. Today’s rate of rise is similar. In fact man-made global CO2 emissions did not begin in earnest until 50 years ago.
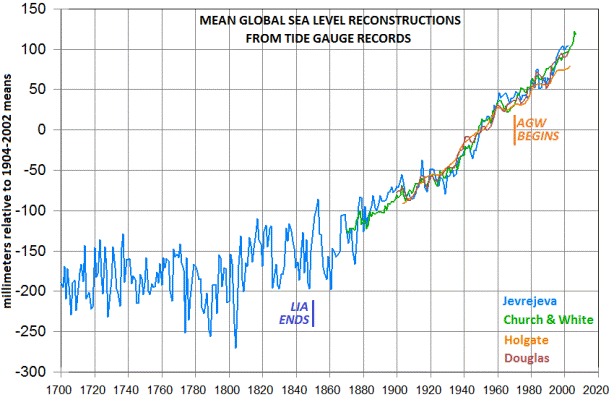
Figure 3: Sea level over the last 300 years. Source: Roger Andrews.
Although we keep hearing media reports of an accelerated sea level rise, hard measurement data show that it is merely a resumption of the post little Ice Age rise. Interestingly the IPCC in its first 1990 assessment viewed this similarly. There they wrote:
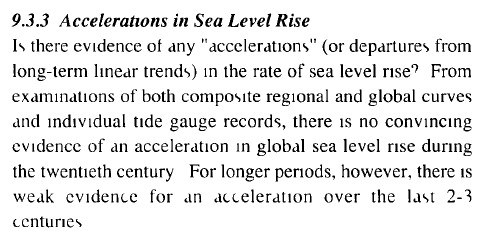
Excerpt from the IPCC first assessment report of 1990 concerning sea level development. Thanks to Climate Depot.
The estimate of the IPCC from 1990 is still solidly based – as Judith Curry confirmed at Climate Etc. in 2012:
The evidence for accelerating anthropogenic sea level rise is pretty weak, and lost in the noise of natural variability.”
And when one looks at the approximately 200 existing coastal datasets with long measurement periods, one comes up with an average rise of only 1.1 mm per year. This is much less than the values from satellites, which are more than 3 mm. One reason may be calibration problems. Satellite data has been corrected upwards as the versions from 2004 and 2013 show (Figure 4).
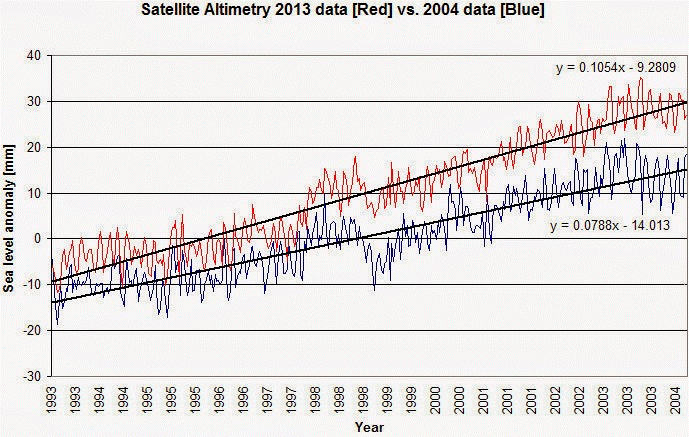
Figure 4: Satellite sea level data were adjusted considerably upwards. Source: The Hockey Schtick.
Currently the Jet Propulsion Laboratory of NASA is investigating possible sources of error in satellite sea level measurement.
The last decades
We observe that sea level rise is pulsing with an about 60-year cycle (Figure 5), which we have discussed on several occasions in the past. This has to do with the PDO, AMO and NAO ocean cycles (see our blog article: Forscherteam der University of Colorado Boulder: Ozeanzyklen haben Meeresspiegelanstieg in den letzten 20 Jahren verstärkt).
The impact of ocean cycles was recently examined by a team led by Benjamin Hamlington of the University of Colorado in Boulder. The authors reported in an article appearing in the Geophysical Research Letters October 2013: “Contribution of the Pacific Decadal Oscillation to global mean sea level trends”. According to the authors, over the last 20 years the PDO contributed about 0.5 mm per year to the observed sea level rise. The scientists say that the PDO’s contribution have to be taken into consideration over the long term and taken into account in prognoses. The PDO will act to reduce the long-term rise, the scientists write.

Figure 5: Sea level rise over the last 90 years. Source: David Middleton.
In January 2014 a group of scientists led by Xianyao Chen published an analysis of global sea level trends based on satellite data in the journal Global and Planetary Change. Here they detected a deceleration in sea level rise, from 3.2 mm in the period 1993 – 2003, to only 1.8 mm per year in 2008. The reason: Pacific ocean cycles.
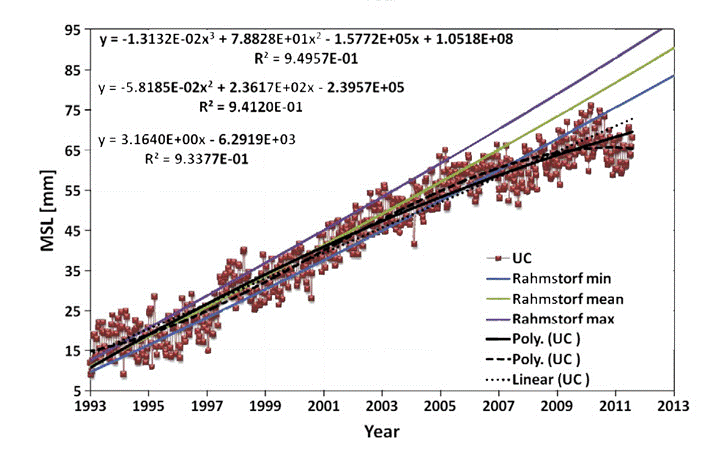
Figure 6: Sea level development over the last 20 years based on satellite data in comparison to prognoses from the Rahmstorf group.
Under the bottom line: sea level rise has been pretty much constant over the last 80 years. Using the same rate, sea level can be projected to rise only 20 – 30 cm by the year 2100.
Spectacular sea level rise projections unscientific
The IPCC bases its 1-meter plus sea level rise on assumptions that sea level rise will accelerate in the future (Figure 7).
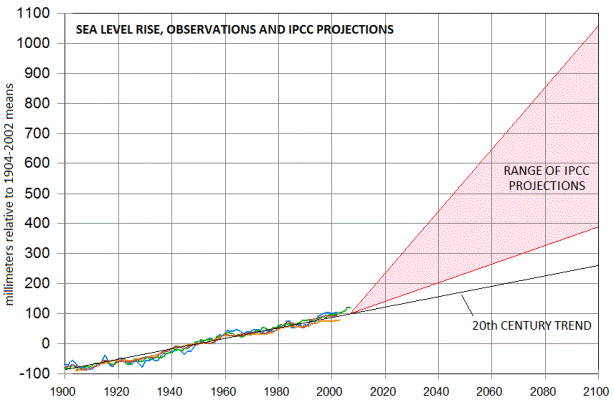
Figure 7: Sea level rise over the last 100 years and prognoses for the coming 85 years. Source: Roger Andrews.
The apocalyptic scenarios come from a group of scientists led by Stefan Rahmstorf. Interestingly Rahmstorf and his colleagues even float prognoses of 2.3 meters by 2300, even though the figure scientifically cannot be taken seriously. Forecasts for the year 2100 or 2300 can never be verified and so those making projections will never have be held accountable. So easily can spectacular projections be made.
Sea level rise far below earlier projections
Things are different for near and mid-term prognoses. Here as time goes by, earlier projections can be compared to observations. In its first report in 1990, the IPCC predicted a sea level rise of 120 mm by 2014. Today, 24 years later, we are able to see how accurate that 1990 prediction really was: It turns out to be only about one fifth of what was projected. In a nutshell: the IPCC 1990 projection was off by a mile.
Scientists made a number of false assumptions, according to Alberto Boretti of the University of Ballarat in Australia. In a study in the journal of Coastal Engineering, Boretti expressed deep doubts over the models from the Rahmstorf group. Overly simplistic models were also criticized by a group of 18 scientists led by Jonathan Gregory of the University of Reading in an article appearing in the Journal of Climate, July 2013. Gregory and his team found no accelerated glacial melting over the last decades. More info on this at The Hockey Schtick. The abstract reads:
Semiempirical methods for projecting global-mean sea level rise (GMSLR) depend on the existence of a relationship between global climate change and the rate of GMSLR, but the implication of the authors’ closure of the budget is that such a relationship is weak or absent during the twentieth century.
To sum it up, the following seafaring saying aptly applies in the current climate discussion:
The rat that leaves the sinking ship is smarter than the captain who goes down with it. Jonathan Swift (1667-1745)


Another thorough debunking of the Catastrophic Sea Level Rise scare.
The fact that the sea level was 9 metres higher 115030 years ago than today is easy to verify. That is the reason you have the extensive diamond workings mining the dunes off the coast of South Africa and Namibia, and the sea dunes operations further South at Namakwa Sands where the heavy minerals are extracted.
Regarding: Figure 2: Sea level rise over the last 14,000 years.
The sea level rise 9,000 – 5,000 years ago (Hypsithermal period) is not shown in the figure. When I checked the literature in 2005, I found several sites worldwide reported as 2 meters higher than at present at about that time.
For example: About 9,000 to 5,000 years ago sea level was approximately 2 meters higher than at present on the coasts of Peninsular Malaysia. The rivers along the coasts all have banks at least 2 meters deep. I also checked for vertical movement of the land relative to sea level. Vertical movement of the land does not explain the relative position of sea level.
The world ocean was 2 meters higher than now. I don’t think my explanation is original: During the Climate Optimum (Hypsithermal) global temperature was possibly 2–3 °C warmer than present.
http://en.wikipedia.org/wiki/Holocene_climatic_optimum
Pitman and Ryan report sea level higher about 7,500 years ago.
[However I do not accept their deluge hypothesis for reasons discussed on my web site.] http://en.wikipedia.org/wiki/Black_Sea_deluge_hypothesis
In figures 5 and 6, the 0.3 mm/year isostatic adjustment that UC adds has not been removed. They add this to adjust for ice age rebound that changes ocean volume, not sea level.
https://notrickszone.com/2011/02/16/a-level-look-at-sea-levels/
And
https://notrickszone.com/2012/06/18/data-show-sea-level-rise-has-slowed-down-over-the-last-7-years/
And
https://notrickszone.com/2012/06/20/what-are-the-causes-of-sea-level-rise/
From Judith Curry’s 16 January 2014 testimony to the US Senate:
“Global sea level has been rising for the past several thousand years. The key issue is whether the rate
of sea level rise is accelerating owing to anthropogenic global warming. It is seen that the rate of rise
during 1930-1950 was comparable to, if not larger than, the value in recent years. Hence the data does
not seem to support the IPCC’s conclusion of a substantial contribution from anthropogenic forcings to
the global mean sea level rise since the 1970s.”
http://www.epw.senate.gov/public/index.cfm?FuseAction=Files.View&FileStore_id=07472bb4-3eeb-42da-a49d-964165860275
You know, we dont need all these fancy modeles and compueter data sets and such to show Sea Levels are not really rising – there is hard physical evidence from 1841 (verified in 1888) at Port Arthur that tells us it isnt. And there are more then a couple Ports from the Roman and Medieval periods that are nowhere near the Oceans they once serviced.
The only thing really rising today is the Alarmists silliness, if you ask me
So, a couple of German scientists and a few hundred other specialists can’t find sea level rise. We have it from great authority, none other than US Pres. Barack H. Obama II, that sea level rise is a threat and he has issued an executive order to help stop it. Thusly, and so forth, many thousands of US citizens must “believe” this or resign from their jobs. Being retired I can ignore him. Have a little sympathy for those others.
City of Hamburg plans to eliminate cars
“The green spaces in the city’s seven municipalities will be networked, and more will be added to help absorb CO2, help moderate Hamburg’s climate — with the city having seen the average temperature rise 1.2ºC in the last 60 years.
It will also be designed to help prevent flooding, which has become a growing threat with Hamburg’s sea level rising about 20cm over the 60 years and predicted to rise another 30cm by 2100, according to the Guardian report.
In 15 to 20 years you’ll be able to explore the city exclusively on bike and foot.”
http://dailytelegraph.carsguide.com.au/news-and-reviews/car-news/city_of_hamburg_plans_to_eliminate_cars_81296_20140113
. . .
So, put away the snorkel & flippers, bike & walking shoes, the car will be fine.
I also pointed this out at JoNova.
Germans seem to have forgotten quickly. From the source aricle:
KdF and its successor in the GDR.
No longer will people have to worry about how they can enjoy themselves. The government has it all worked out for you.
Note that Hamburg is far from unique. Similar “plans” abound globally, promoted by ICLEI, the UN’s mechanism for undermining national sovereignty by subverting representative local government. It’s the soft under-belly of modern democracies.
I’d be interested in the response by Rahmstorf et al.
Any chance someone from the MSM will take this and run with it?
Kurt in Switzerland
P: Wow….my friends in Long Island New York, and on the coast in Florida will be absolutely THRILLED that the sea level rises of 6 – 8″ or so that THEY HAVE IN THEIR BACK YARDS….are nothing more than an illusion.
They will be tickled pink:) Now….if they can only convince the insurance companies that the sea level rise is an illusion….they will be good to go:)
Cheers:)
Nobody is saying sea level rise isn’t happening. It’s been happening over 10,000 years and everyone knows it. If they knew of the risk and decided to build there anyhow, it’s their own stupidity.
You reckon that pumping out groundwater doesn’t cause subsidence?
USGS says:
Here is an interesting article on subsidence, mentioning several famous examples.
http://mygeologypage.ucdavis.edu/cowen/~gel115/115CHXXsubsidence.html
Buddy,
Check out this site: http://www.psmsl.org/products/trends/
You can choose the periods you want (m.b. > 30 y) for the region of interest.
Let me know if you see an overall acceleration in sea level over the 20th C.
Try your hardest not to cherry pick.
BTW, do you have friends in the Gulf of Alaska or the Gulf of Bothnia?
Sea levels there are FALLING.
Kurt in Switzerland
Long Island is a sandbank, Buddy, only idiots or people who get subsidized flood insurance build there.
you have to be kidding….do you not read the reports? If they have seen 6-8 inches of sea level rise, then I assume they are over 100?
@Buddy
The tidal gauge at the end of Manhattan Island, The Battery, shows a steady sea level rise for almost 160 years. The rise started long before mankind’s activities could have had an effect, and our emissions in the second half of the 20th century did not change the rate of rise, which is 0.91 feet per century, or about one inch per decade.
http://tidesandcurrents.noaa.gov/sltrends/sltrends_station.shtml?stnid=8518750
The land ice that could be most easily melted has melted a long time ago. First to go was the ice at low elevations and low latitudes. Then mountain glaciers at low latitudes melted back (“retreated”). The melt continued into higher latitudes. Then it all slowed. The easy-ice is gone. Sea level rose rapidly when ice was melting rapidly. Now sea level rise has also slowed. There is nothing mentally hard about understanding this. It is what the charts show.
~~~~~
Buddy mentions Florida. In the early 1980s, some relatives lived 6 miles (~8.5 km) inland from the Atlantic Ocean. The address was Greenacres but it is just west of Palm Beach. The area is habitable because ditches and ponds were excavated and “land” created out of the swamp with the sand so obtained. Here are coordinates via Google Earth if you want to have a look (~12.5 km from coast):
26.667, -80.173
Use the “Street View” to see the landscape. It is a bit flat! With incoming tide the outflow of the ditches would cease and they would slowly fill with water, alligators would come into the drainage ditches and into the yards and sometimes get into the drainage under the subdivisions. Occasionaly they would show up under the metal gratings of the street drain openings. Quite entertaining. This was before the 1988 Writh hearing in the hot Capital building so we didn’t know the alligators were there because of global warming.