Dr. Sebastian Lüning’s and Prof. Fritz Vahrenholt’s Die kalte Sonne site brings us the latest solar report.
=====================================
The Sun in January 2014 and News of the Sun’s Polar Field
By Frank Bosse
(Translated, edited by P Gosselin)
Over the last month solar cycle 24 (SC24) has seen some rather brisk activity. The sunspot number (SSN) reached a value of 82.0, which however was only 77% of the normal value (106) for the 62nd month into a cycle. The southern hemisphere (SH) contributed to most of the overall result in January, outperforming the northern hemisphere (NH) 61:21. The following graphic depicts current activity (in red) and normal activity (in blue):
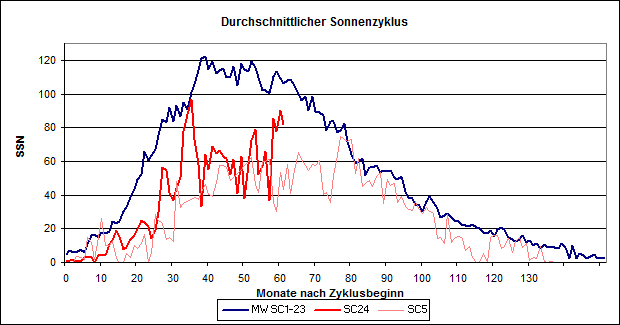
Figure 1: The course of SC24 in relation to the mean value of all observed cycles.
The figure also shows SC5 in light red. SC5 has some degree of similarity to the current cycle so far. The next figure shows a comparison of the acti9vity of each indiviual cycle after 62 months into the cycle with little changing over the past few months:
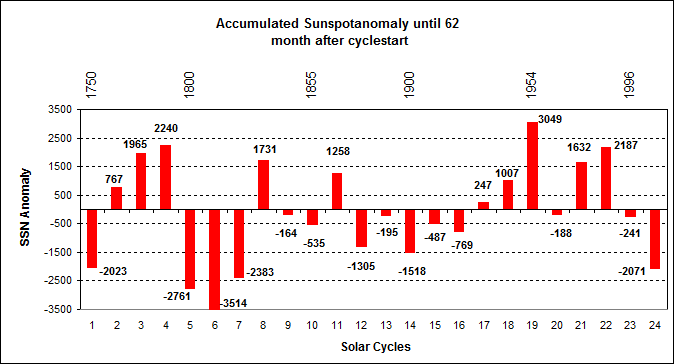
Figure 2: Accumulated SSN anomalies of the cycles.
The chart depicts the anomaly of the accumulated sunspots for each cycle 1-24, from the mean value for month 62 into the cycle. SC24 began in December 2008.
So what is the activity determined by and are there indicators for the strength of the upcoming cycle? There is a lot of thought going on over this question. The favorite indicator is the strength of the polar magnetic field during the minimum between 2 cycles.
One of the very good predictions was developed by Leif Svalgaard already at the end of 2004 when he pegged the current cycle would be the weakest in the last 100 years. His 3-month smoothed maximum SSN of 75, which was derived from observations of the sun’s polar field, matches up very well to the present counts.
Since this has been confirmed, polar magnetic fields of the sun are recognized early indicators. At Stanford University they are being measured with great meticulousness and have been on the decline since recording began in 1976.
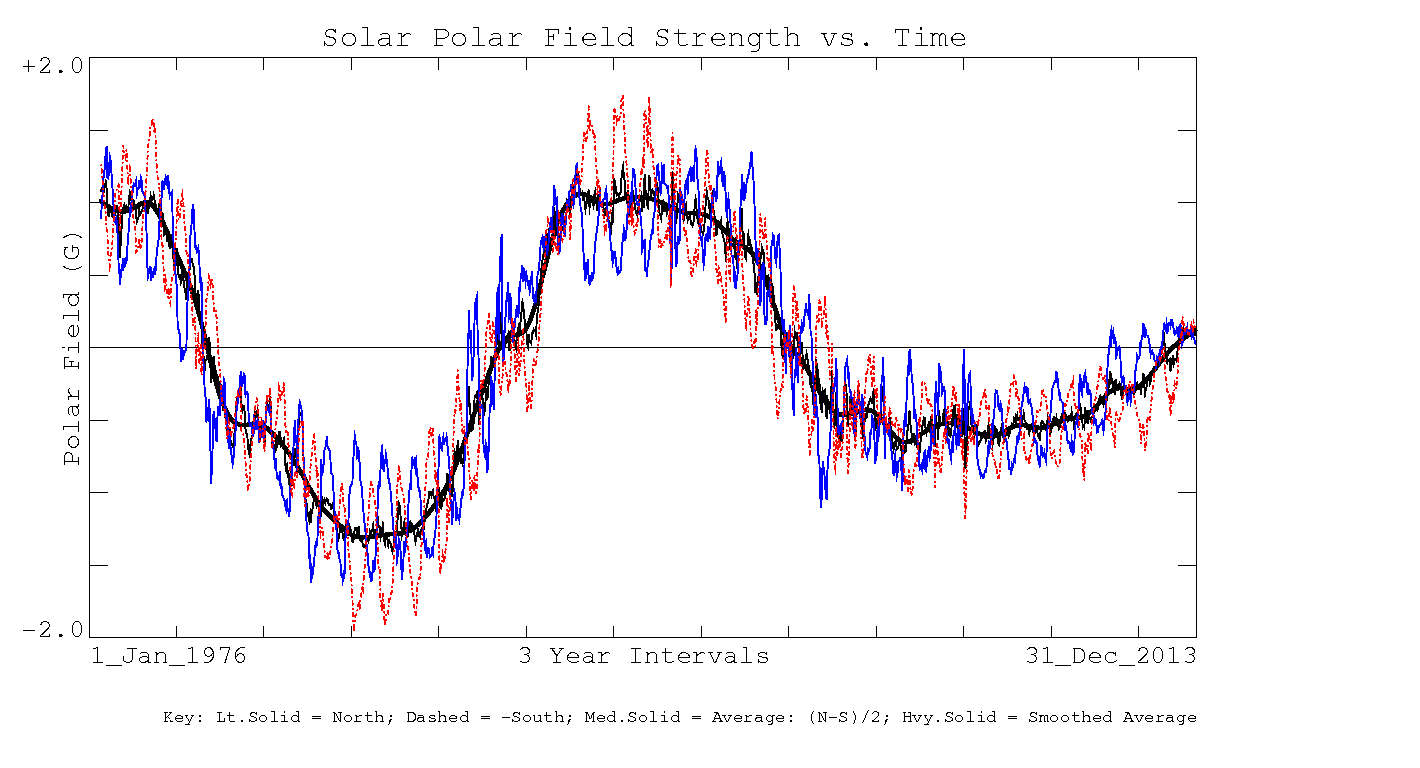
Figure 3: Polar fields of the sun since 1976, source.
Here we see that the field always reverses at the cycles’ maxima, and that it reaches a maximum when during the minimum of a cycle. The theory on this: The remnants of sunspots drift to each of the poles of the NH and SH (they do not cross the solar equator) and they provide for the reversal of the polar field. It’s a sort of see-saw that has been in steady decline since the SC21/SC22 minimum. Thus, pole reversal is a result of the activity of the ongoing cycle. Data can be downloaded from the above mentioned source. Our main interest is aimed at the behavior at the maximum, i.e. pole reversal. Here we evaluate the smoothed data of the magnetic field and the following diagram is yielded:
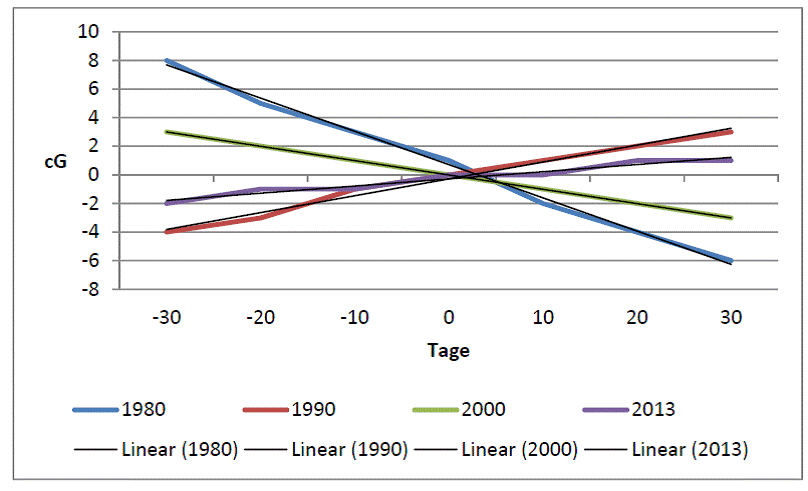
Figure 4: Polar solar magnetic field (in centi-Gauss) at the maxima of cycles 21-24.
The data for the period of 30 days before until 30 after crossing the zero-point were evaluated and they determine the slope of the quite linear behavior. Also here falling activity is very well depicted. If we set 1980 equal to 100%, then it drops in 1990 to 51%, to 43% in 2000, and to only 22% in 2013. Not only the maximum magnitude of the polar magnetic field at the cycle minimum for sunspots has always gotten less over the last 30 years, but so has the speed of the pole reversal during the periods of SSN maxima!
So what’s with the polar field? That we are witnessing an especially weak effect is also depicted by the following diagram, which shows the course of the first 320 days after pole reversal:
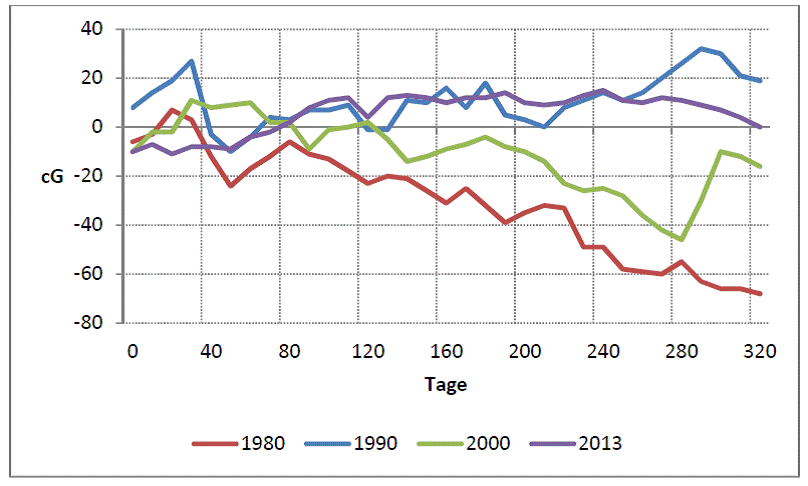
Figure 5: The course of the unsmoothed data of the polar field after pole reversal.
What we see is a record: After almost one year since pole reversal, we have once again reached a zero-point, which was measured on January 12, 2014. Never has such a behavior been recorded since the beginning of data recording.
Could this delayed build-up of the polar field be an indication of the strength of the SSN minimum in about 5 years? This magnitude is namely the first predictor for the upcoming SC25. Looking at the data shown here, should we expect a Maunder-like “grand minimum” beginning in 2020? To date all indications point to low numbers…surprises cannot be excluded!


You expect cooling? Got any hard testable predictions? That you’re prepared to bet on?
https://notrickszone.com/join-the-climate-bet-for-charity/
(a) I’m not interested in doing this for charity
(b) That post is you trying to solicit people to match someone’s bet about warming. I don’t see any offer by you to put up against new bets. Are you prepared to put up money (on the cold side) of warm-vs-cooling?
I already have. Besides, since when is this about cooling? The discussion is about catastrophic warming. Even moderate warming would mean the IPCC is wrong.
The above post is merely to show what others out there think, and it is not necessarily a reflection of my position on the issue.
Silence from Connolly. ‘Twas ever thus.
Winston, no wonder you have such a problem editing climate Wiki climate articles. The terms of the bet clearly state, if you had read past the first sentence, that anyone can join in a bet on the warm side like Rob. Do I sense an attitude here?
(LOL, That was too easy.)
hey look, it’s the guy who blatantly censored thousands of articles with a religious fervor that is difficult to comprehend. How are you doing William Connolley?
http://en.wikipedia.org/wiki/Political_religion
FYI, at this blog Mr C. prefers to go by the name “Winston”.
So, that would be a sort of “tricki-wiki-pedia”?
And now several of the more “enlightened” big city papers have decided to censor ALL comments that do not comport with the hysterical leftist pseudo science of glo-bull warming.
I guess its all they have really – Appeal to supposed authority, censoring all opposing views, hurling nasty accusations and ascribing bad motives is the leftist way, isn’t it? The fanatical leftist criminal cabal has set up shop in the house of science and science becomes a laughing stock because silly political tactics are substituted for real science.
For those who don’t know who William Connolley is….
http://sppiblog.org/tag/william-connolley
He comes along here for a few weeks now. He does not look like a member of a winning team.
Wow! That’s very shocking. I didn’t know he had gone to those extremes.
Well, that’s why I call him Winston.
BTW Pierre, Winston is known for pestering skeptic blogs to collect quotes which he then uses on his “going at the throat of science” blog.
Which doesn’t bother me; the regime has many idiots to expend, Winston is one of a million. Just don’t be surprised when he takes you out of context and misrepresents you. The warmists have no other trick left; it is now agitprop warfare only.
I couldn’t give a hoot what any paranoid, end-of-world-obsessed, hand-wringing alarmist thinks.
Thanks Mark, I too was wondering about William Connolley and the wikipedia conection.
William Connolley 7. Februar 2014 at 19:05
“You expect cooling? Got any hard testable predictions? That you’re prepared to bet on?”
http://en.wikipedia.org/wiki/Last_glacial_period
http://en.wikipedia.org/wiki/Little_ice_age
http://rogerfromnewzealand.files.wordpress.com/2010/01/global-temp-co2-over-geological-time.jpg
Testable? You mean in 100 years?
I see what you did there.
[…] by Latest News ⋅ February 8, 2014 ⋅ Leave a Comment P Gosselin NoTricksZone Fri, 07 Feb 2014 22:23 CST The Sun in January 2014 and News of the Sun’s Polar Field By […]
What seems to be missed here is that William (aka Winston) has jumped in at the top of comments and sent the comments down a dead end. There has been no discussion of the merits of the Sun’s polar field or how this or anything else connects to Earth’s climate. It is an interesting post and deserves attention. Not that I know how how such things work and having followed Leif’s comments for several years, no else seems to know either.
Every now and then W. does contribute something useful. Otherwise, I suggest ignoring such comments as he started with here.