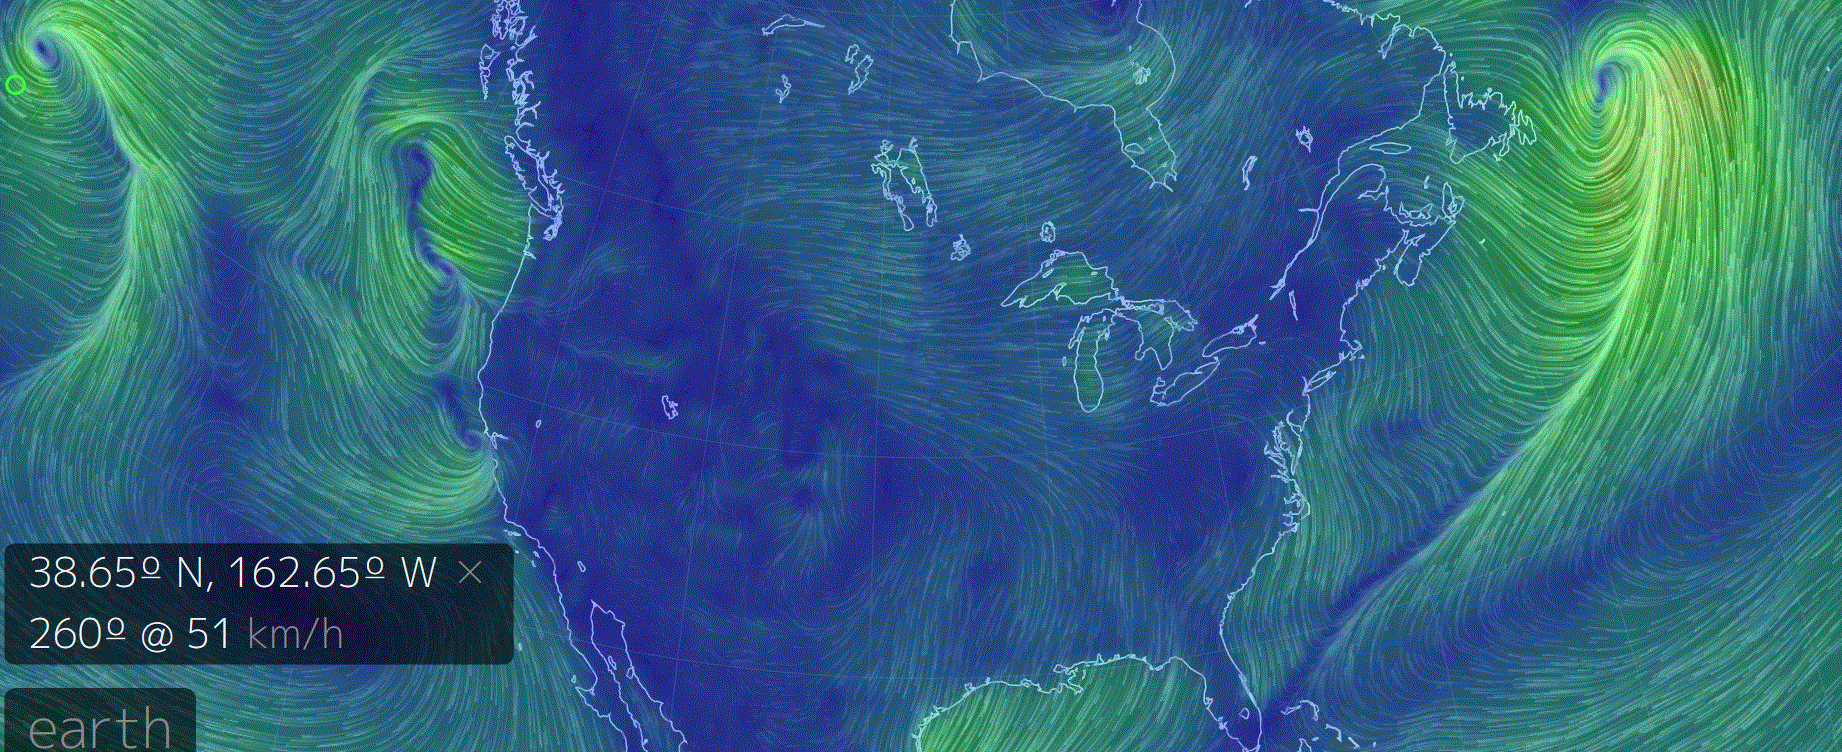
Here’s something really cool and likely something you’re going to look at regularly.
Axel Bojanowski reports here at Spiegel on an outstanding interactive global weather real-time animation tool. The animation is the creation of US programmer Cameron Beccario.
Image cropped from: earth.nullschool.net.
You can use the mouse to rotate the globe and to activate the animation of what is happening on the planet, real time. By clicking on a certain location, the exact longitude and latitude coordinates are appear along with wind speed data in a box. It’s really fascinating.
Bojanowski says to open it with Firefox or Crome browser!
For example in the above cropped image, the tiny circle all the way in the upper left corner appears and the box contains information for that location such as wind velocity and coordinates
This probably is known to others already. For me it’s the first time I see it.
Enjoy. It’ll be handy to use as storms approach.


nice!
I saw this for the first time about 2 weeks ago. Not only is it informative but it is visually stunning.
I also am now checking on the Global Forecast System (GFS) as explained below. This site focuses on the Western Hemisphere but there may be others better suited to different locations.
http://www.tropicaltidbits.com/analysis/models/gfs/
As an example, click on the map of North America, then
Click on the “2m Temperature Anomaly” [or any of the others of interest]
Then Click on “Loop” near the bottom [wait while files load]
When the map appears, move the slider for “Set Animation Speed” to about ¼
Note the Stop/Start button at the top left
I’m glad you put this up , Pierre. I bookmarked it some time back but lost it while repairing Win 7. Thanks
When Turdey and his ship of fools got stuck I was watching the winds on this site. It is the most beautiful view yet of the weather of this beautiful planet.
Works fine with IE 11 also
I like to spend about half an hour with this wind mapping tool each time I open it up. You can step through the various layers of the atmosphere, from surface up to beyond the jet-stream. You also have the choice of different maps, the northern hemisphere only. etc.
I find it fascinating to see how the wind directions change as you step up. Questions about wind drag, boundary layers, etc. the basic stuff from fluid dynamics, are raised. I do need to find out more about that stuff.
In the meantime, Cameron Beccario, thank you for this wonderful tool. All weather forecasters should use some shots from this tool to explain the weather to us.
You can see also the temperature with this tool. “overlay=temp”
http://earth.nullschool.net/#current/wind/surface/level/overlay=temp/orthographic=-1.42,48.63,729
That one is even better, thanks.
Juergen Uhlemann 7. Februar 2014 at 12:04 | Permalink | Reply
You can see also the temperature with this tool. “overlay=temp” –
You can see directly the effect of the Himalayas. Beautiful !!
I heard about it a week ago, and agree that it’s an excellent piece of work. However I wasn’t aware that it could be customised until seeing the comment by Loodt Pretorius. I’ve now discovered that clicking on the “Earth” box brings up a menu to change what is displayed and how. Even better!
Thanks Dave.
I went through the source code mentioned in the http://earth.nullschool.net/about.html page.
I was close as I noticed some “box” mentioned.
Thanks for sharing! It’s visually stunning! What’s up with the massive cell spinning in the Atlantic ocean? It seems to be the strongest one on Earth right now.