Veteran meteorologist Klaus-Eckart Puls of the European Institute Climate and Energy (EIKE) has sent over some slides from a presentation showing Germany’s mean temperature has been cooling over the last decades.
A couple of days ago a certain reader named Neville (Warming-In-Our-Time) (or was it Neven? whatever…) was complaining that the Eastern Alps were not representative of Europe and thus the data there showing colder winters meant little for Europe, let alone the northern hemisphere. The first slides Klaus Puls sent are data charts for snow cover for the entire northern hemisphere and mean winter temperatures for Germany.
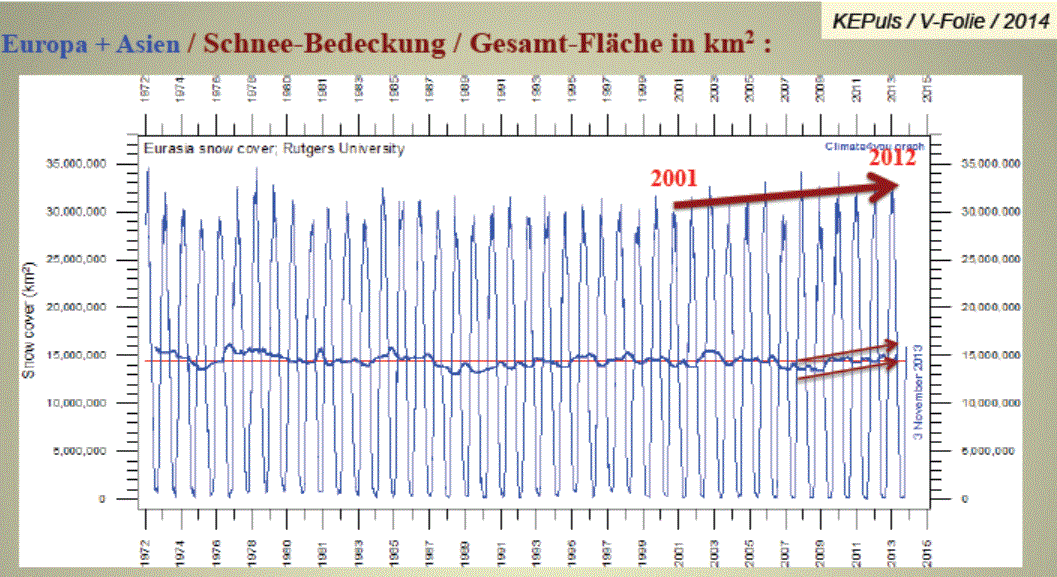
The first chart below shows snow cover in square kilometers for Europe and Asia, where we see an upward trend over the last quarter century. This is not something you’d expect in a warming world.
It just happens that global temperatures have dropped slightly over the last 10 years, and haven’t risen in 17 years. So the trend in snow cover is no mystery to those who know the data.
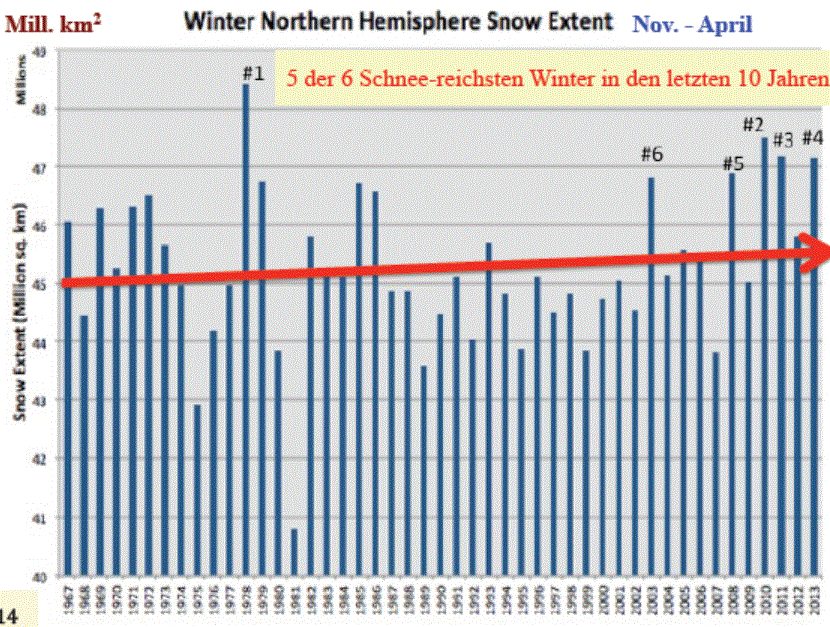
If Europe and Asia are not enough to convince you, Puls’s next chart shows that 5 of the 6 top northern hemisphere snow coverage extents occurred in the last 6 years!
The trend over the last 47 years is upward. The mean for the last 10 years is at a record high.
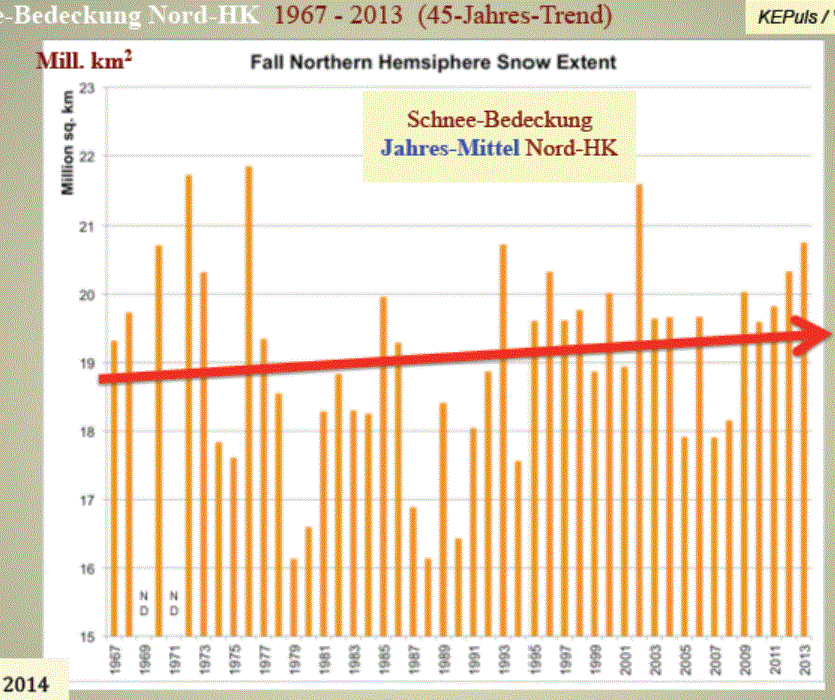
The next chart shows the trend for mean sonw coverage for the northern hemisphere for the fall season since 1967.
Here also the mean autumn snow coverage trend has risen almost half a million square kilometers in 45 years. Again a surprise that flies in the face of a warming planet (one that hasn’t warmed in almost 2 decades).
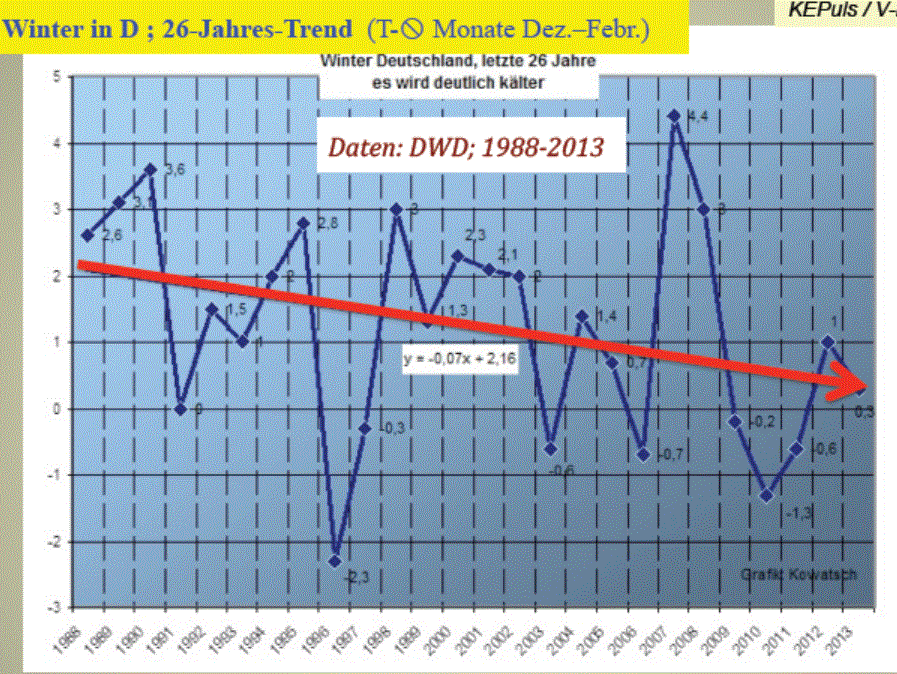
The next chart shows that winters (DJF) in Germany have gotten “considerably colder over the last 26 years,” Puls says.
The above chart uses data from the German Weather Service (DWD).


You simply do not understand neven. Or is you do not understand simple neven. No matter. It is not the right snow because it comes from a warmer place than the normal snow. Come on Pierre, get a grip. :))
After I lectured the troll on the other thread about the meaning of averages, it occured to me that when we define climate [temperature – or pick any other variable] as the [moving] average of weather over 30 years, then we can only ever know what the climate was up to 15 years ago [due to the window length]
And this is what RSS weather [the red line] tells us about climate [the green line]
http://www.woodfortrees.org/plot/rss/plot/rss/mean:360
I have seen similar winter temp charts for North America. Down 2 degC in 20 years.
[…] Veteran Meteorolgist: N. Hemisphere 10-Year Snow Cover At Record High…German Winters “Considerab…. […]