By Ed Caryl
During the last three years, since 2011, the ice around Antarctica has been growing, in most seasons, more than during any similar periods of the satellite era where we have that data.
At first, the climate catastrophists ignored this phenomenon. When that became embarrassingly inconvenient, they began to blame it on instrument problems.
They detected a step-change in the data in 1991, but couldn’t decide which side of the step was the correct data, and the fault only excused about 5% of the increase. The step change supposedly occurred in 1991.
Figure 1 is from the paper as described above. The step occurs at the end of 1991.
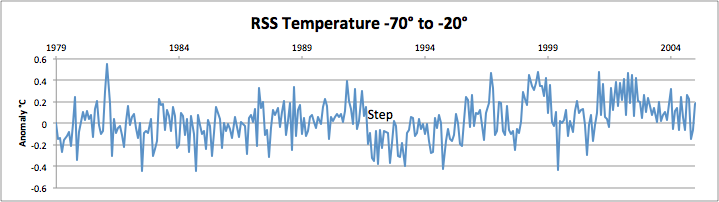 Figure 2 is the satellite (RSS) lower troposphere temperature data for the southern hemisphere south of 20° South.
Note the step in July 1991. The step in temperature occurs in July 1991. What happened in the summer of 1991? Mount Pinatubo blew up on the 15th of June. How long does it take for volcanic equatorial cooling to reach 70° South? About six months. Can you see the step in the ice data? I can’t. It doesn’t show in the annualized ice date (Figure 4) either
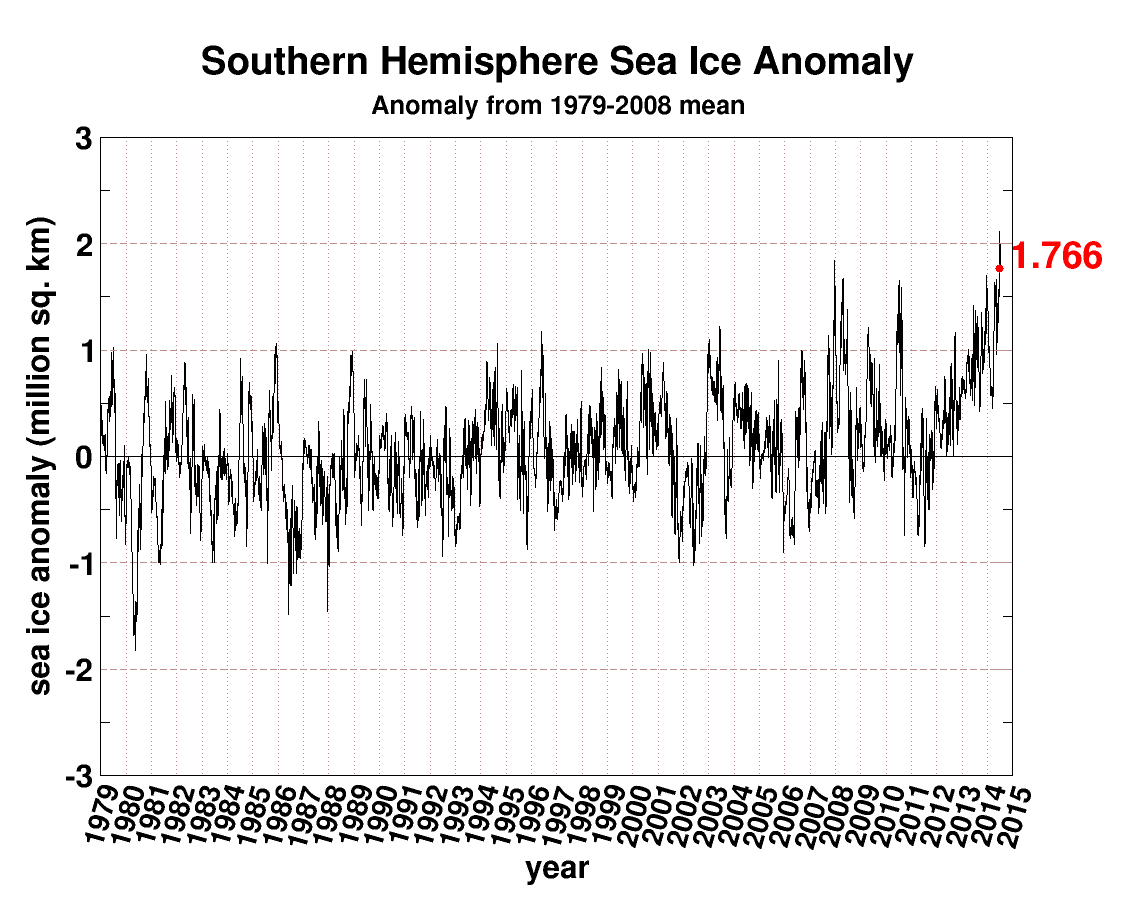
Figure 3: Hemisphere sea ice anomaly data in the satellite era. Source
If a real step was detected in the ice anomaly data, it coincides with a cooling step in the southern hemisphere temperature, and is real, not an instrumental artifact. To make it easier to see the trends, the next figure is annualized data, sea ice anomaly and temperature anomaly from satellite (RSS) for the latitudes of coastal Antarctic, 70°south to 60°south, with the trends. Temperature has been inverted to match the ice.
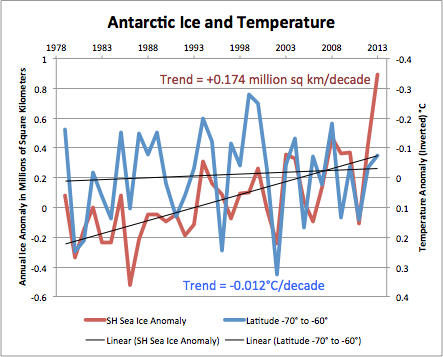
Figure 4: Plot of the ice anomaly (annualized) and the temperature anomaly (also annualized) for the latitudes of coastal Antarctica.
It is apparent in Figure 4 that most of the changes in the ice anomaly plot match changes in temperature. Keep in mind that the temperature plot is inverted, cold is upward, warm downward, to match the behavior of the ice. The recent increase in ice is because it has gotten colder.
Though the temperature trend in the last 35 years is only slightly cooler, the ice has increased dramatically. Here are trend maps of the temperature changes in the polar regions in the last ten years from GISS. Compare the temperature changes along the coast of Antarctica to the ice anomaly map.
Figure 5 is a map of the global temperature change over the last ten full years from GISS.
Note that the Global temperature trend from 2003 to 2013 in Figure 5 above, (top right corner) matches the 70° to 60° South decade trend in Figure 4.
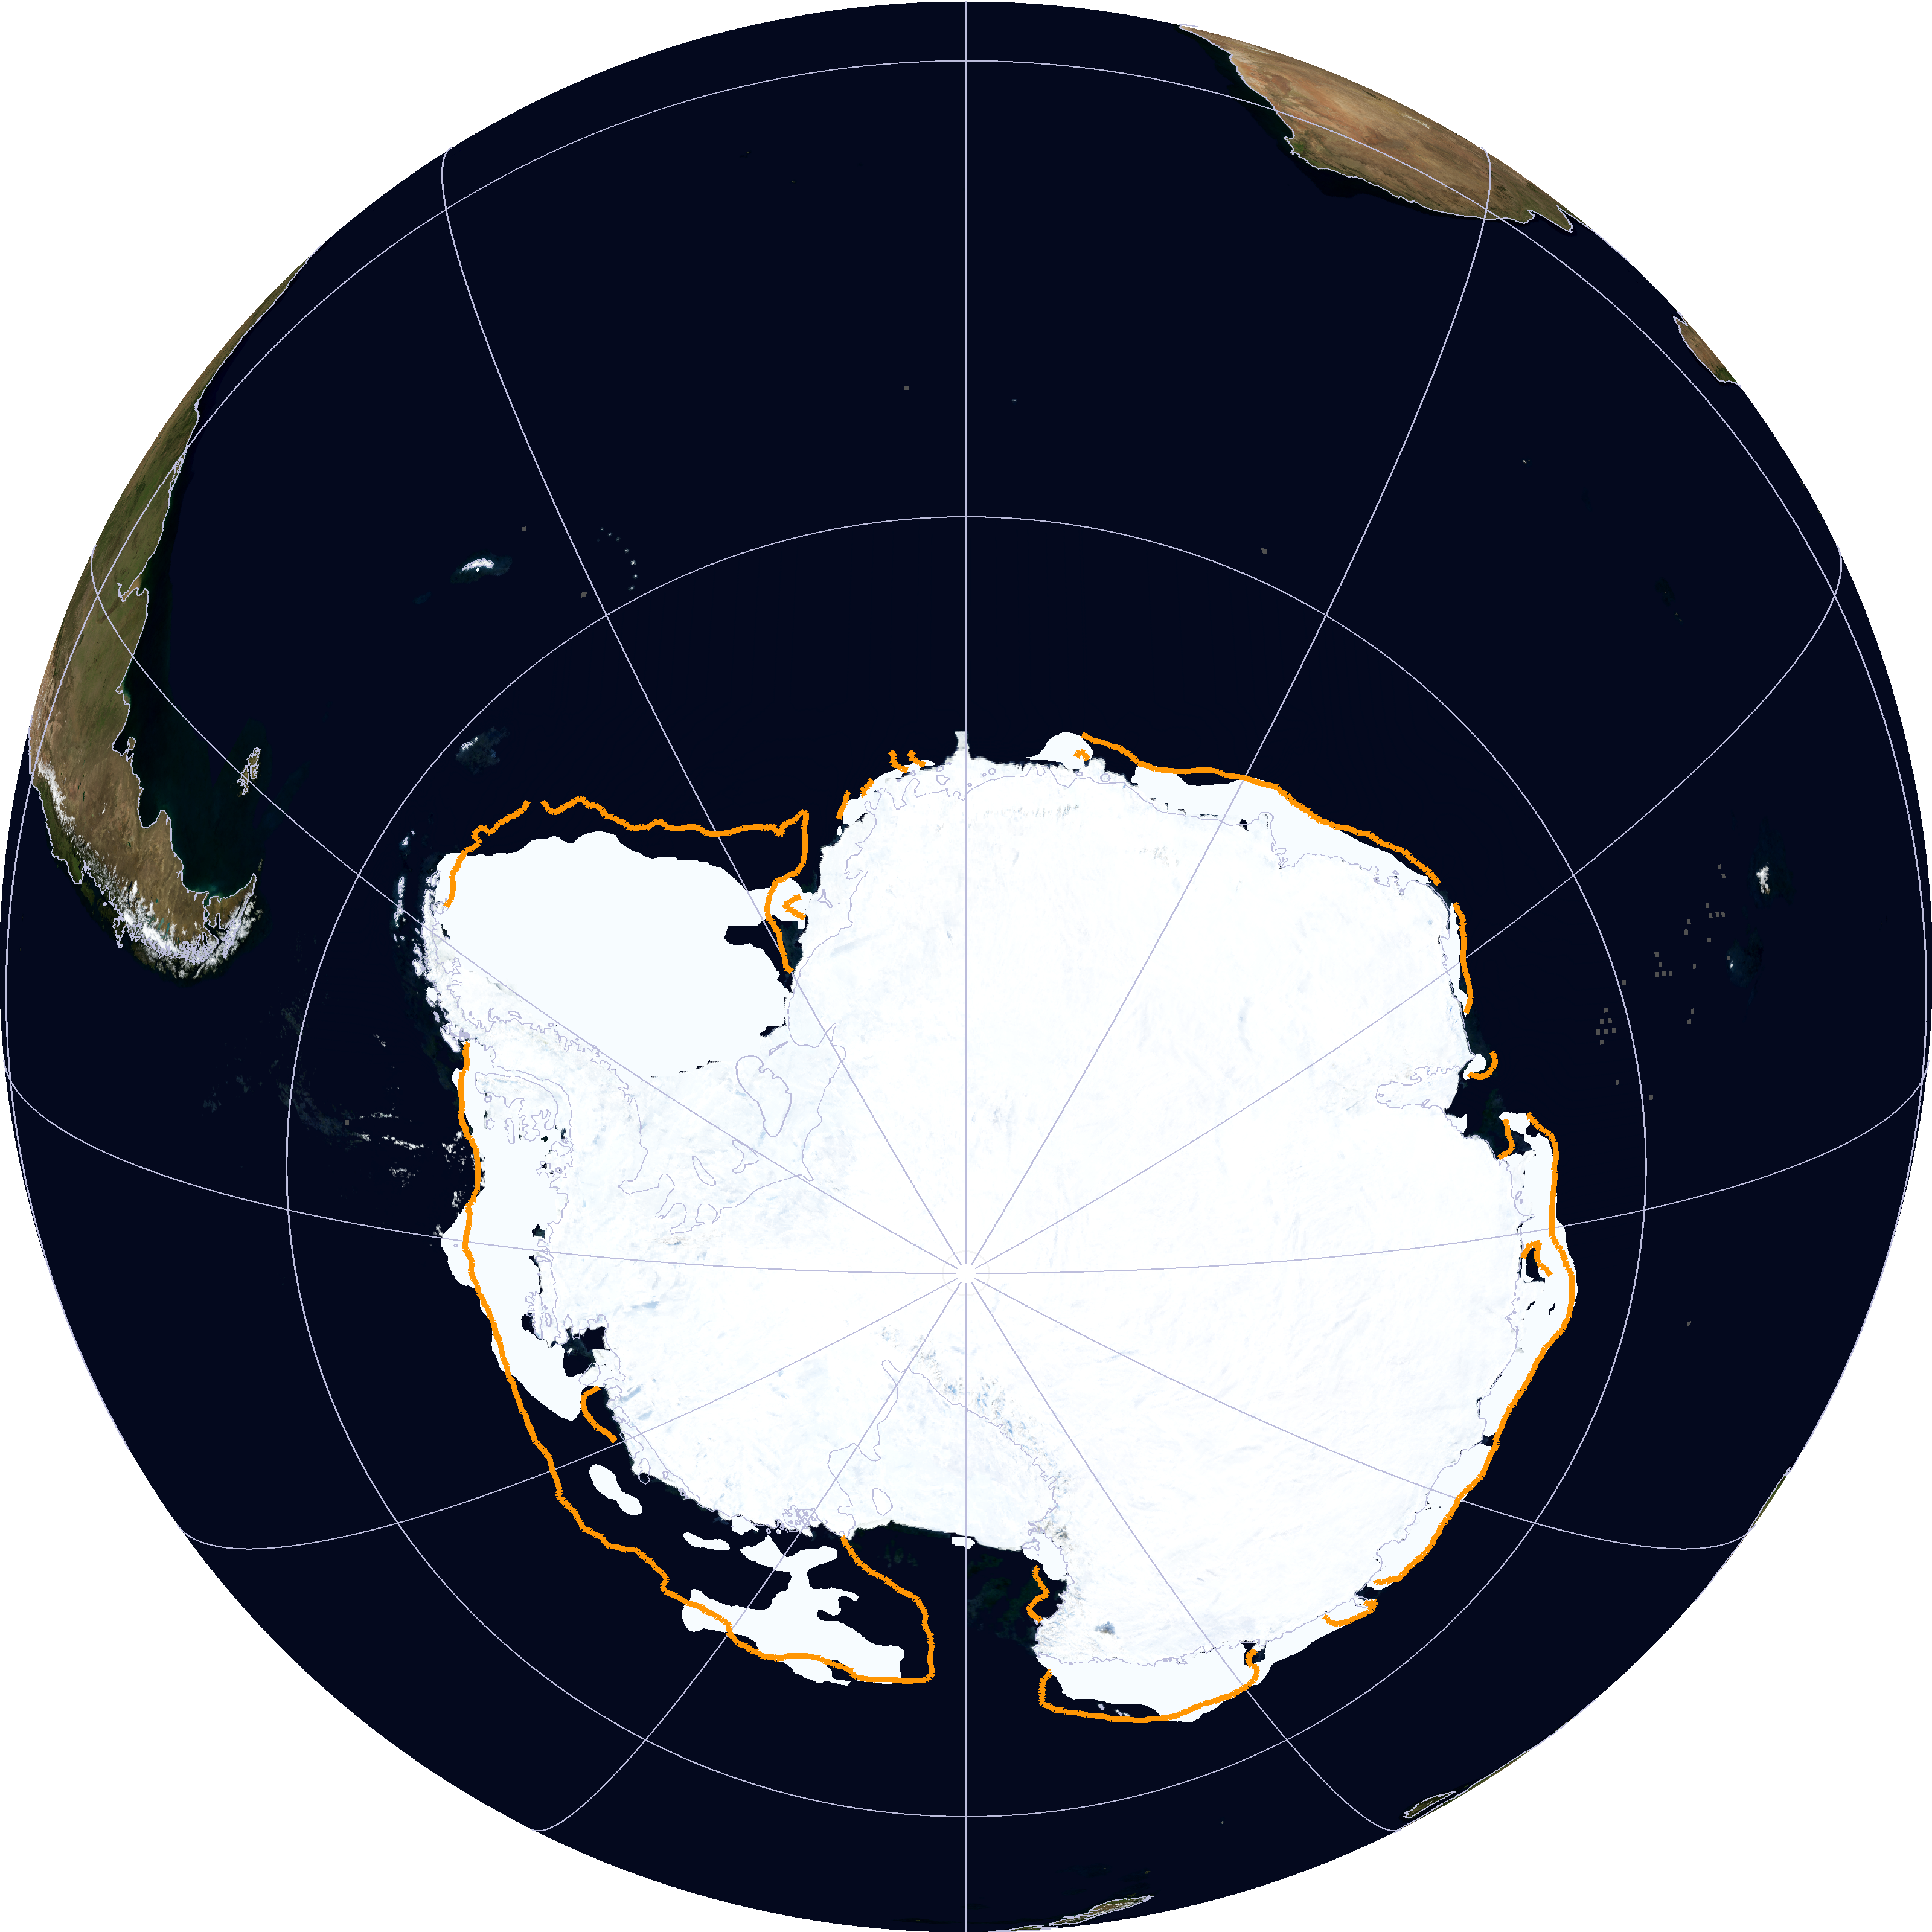
Figure 6 (right) is the current ice anomaly map for Antarctica. I turned it 90° counter clockwise to match the Antarctic as seen in Figure 5.
There is more ice where it has been colder. There are many gaps in the temperature data around Antarctica, especially ocean data. But even on the continent, station data is quite sparse and subject to UHI (Urban Heat Island) problems for the larger stations. That large orange spot in Antarctica in Figure 5 is due to McMurdo Station, the largest and most populous base on the continent.
The next largest heat source is the Amundsen-Scott South Pole Station.
The ice around Antarctica is not increasing due to global warming. It is increasing due to global COOLING!


If the schedule of Antarctic temperatures is to be believed with temperatures declining since 1980 then clearly the world has not globally warmed since that date. But then I am not an approved member of the closed shop of climate scientists, so my observations can be ignored.
did you try to plot variation per time unit of sea ice vs temperature instead of sea ice vs temperature?
Funny, all these years they trusted their “bootstrap” algorithm, and now that the algorithm turns out to be a climate denier, it gets led to an unmarked room in the basement to be dispatched with a shot to the back of the head. The Climate NKVD doing its daily rounds.
You don’t need satellite data to see what’s going on down south, all you need is to keep an eye on the News section of the Australian Government’s Australian Antarctic Division;
http://www.antarctica.gov.au/news?result_41588_result_page=1
In November last year (2013), the Aurora Australis was trapped in heavy sea ice for twelve days!;
http://www.antarctica.gov.au/news/2013/australian-antarctic-resupply-ship-moves-out-of-heavy-ice
All shipping schedules were revised from Jan 2014 onwards because of heavy sea ice and the hysterical (and humiliating) rescue of the Ship of Tools;
http://www.antarctica.gov.au/news/2014/australian-antarctic-shipping-schedule-revised
In February, heavy sea ice conditions near Mawson research station resulted in further changes to the Australian Antarctic Division’s shipping schedule.
http://www.antarctica.gov.au/news/2014/changes-to-the-antarctic-shipping-schedule
In April, the Aurora Australis still couldn’t get to Mawson Station due to heavy sea ice, infact it had to do 163 helicopter flights to transfer supplies and personnel from 40 nautical miles (75km’s) away!
But according to all our overpaid armchair ‘experts’ in front of their whiz-bang computer screens and Peer-Reviewed studies, all of this is pure bullshit and the polar regions are melting away at alarming rates.
BOLLOCKS!!!
There is no sea ice. It’s all an illusion created by the Bootstrap algorithm. The proof is simple: Mawson had no problems with sea ice, and he used no algorithm! See?
Oops….forgot the link to April’s report;
http://www.antarctica.gov.au/news/2014/complex-aerial-mawson-resupply-nearly-complete
But what then did cause that increasing temperature anomaly (cooling) from satellite (RSS) for the latitudes of coastal Antarctica? Aren’t those “warmists” suggesting cooler ocean surface temperatures because of “warming deep waters” or certain new “atmospheric circulations”? They would also cause RSS temperatures showing up, leading the ice increase. For this reason the conclusion this has to be global cooling seems unjustified or a bit hasty. The link between global cooling and temperatures at that latitude still needs to be provided after all. A challenge also for the “warmists” by the way.
-0.012deg. C / decade is not cooling — nor is it warming).
It is flat.
Kurt, I would like to point out that the 0.8°C global warming that we may have had since 1850 is 0.05°C per decade.
Of course, if you cherry pick a cooler spot like 1850 to start your trend, you’ll get a warming. After all, that was during the “little ice age”. Although, that amount of warming would not only be insignificant, but nothing unusual.
Perhaps the ice is increasing because the southern hemisphere air temperature is decreasing and/or a decline in insolation is cooling the sea surface temperature or the strengthening of winds are causing up-welling of colder water.
But I doubt it and base my skepticism on Occam’s razor: Cooling of the southern hemisphere as a southern hemispheric reversal of global warming is not needed to increase the volume of sea ice.
All that is needed is an increase of precipitation over the coastal areas of Antarctica in the form of snow.
This would cause more ice to move from land to the sea simply by gravity. The endothermic reaction of ice meeting salt water would account for the expansion of sea ice.
Our great-grandmothers relied on the same endothermic reaction to produce ice-cream before electric refrigeration.
The calculations would be trivial if the data is available.
The increased movement of ice due to increased snow takes many tens of years, not three years.
NOAA Reynolds Sea surface temperature anomalies for the waters surrounding Antarctica (60 to 70 South) are negative and have been since circa 2007. Anomalies relative to 1971-2000.
http://nomad1.ncep.noaa.gov/cgi-bin/pdisp_sst.sh?ctlfile=monoiv2.ctl&ptype=ts&var=ssta&level=1&op1=none&op2=none&month=jan&year=2000&fmonth=jun&fyear=2014&lat0=-70&lat1=-60&lon0=-180&lon1=180&plotsize=800×600&title=&dir=
It’s cold down there!
Step change 2007?
It makes a big difference when the sea surface temperature goes from just above the freezing point of water to just below.
Reynolds actual SS temps:-
60 to 70 south:-
http://nomad1.ncep.noaa.gov/cgi-bin/pdisp_sst.sh?ctlfile=monoiv2.ctl&ptype=ts&var=sst&level=1&op1=none&op2=none&month=jan&year=2000&fmonth=jun&fyear=2014&lat0=-70&lat1=-60&lon0=-180&lon1=180&plotsize=800×600&title=&dir=
65 to 70 south:-
http://nomad1.ncep.noaa.gov/cgi-bin/pdisp_sst.sh?ctlfile=monoiv2.ctl&ptype=ts&var=sst&level=1&op1=none&op2=none&month=jan&year=2000&fmonth=jun&fyear=2014&lat0=-70&lat1=-65&lon0=-180&lon1=180&plotsize=800×600&title=&dir=
Spending very little time above zero since 2006/7.
[…] So What’s The Real Reason South Polar Sea Ice Is Expanding? It’s The Cooling, Stupid! During the last three years, since 2011, the ice around Antarctica has been growing, in most seasons, more than during any similar periods of the satellite era where we have that data. […]
“But even on the continent, station data is quite sparse and subject to UHI (Urban Heat Island) problems for the larger stations. *That large orange spot in Antarctica in Figure 5 is due to McMurdo Station*, the largest and most populous base on the continent.”
This is a laughable statement. You’re ignorance is astounding.
I’m glad you’re happy. But your knowledge needs some improvement. Look at the pictures on wikipedia closely. Note the large fuel tanks. That oil gets burned over winter.
http://en.wikipedia.org/wiki/McMurdo_Station
Then check out the temperature difference between McMurdo and Scott Base, about two miles apart.
http://data.giss.nasa.gov/cgi-bin/gistemp/show_station.cgi?id=700896650018&dt=1&ds=14
http://data.giss.nasa.gov/cgi-bin/gistemp/show_station.cgi?id=700896640008&dt=1&ds=14