When it comes to the climate debate, everyone knows that it really all boils down to how much is man’s impact. It has nothing to do with whether climate is changing or not. It always has.
The core question is how accurate are the climate models and are they really accurate enough to use for policymaking?
Skeptics have long argued that the models use a climate sensitivity for a doubling of Co2 that is much too high…even preposterously high. The alarmists, on the other hand, insist that it isn’t, and that the models are pretty much on target. Now that climate models have been making predictions for well over 15 years, we now have enough data to make a preliminary call.
If the models are right, then the observed temperature should be following the trend predicted of the ensemble of models. But if the two trends are diverging, then the models are inaccurate and should be revamped. C3 Headlines here has posted a chart comparing observed (blue) to model trend (red):
Chart comparing model projections to observed temperature. The last few months have shown a record divergence. Chart: C3 Headlines.
As the above chart shows, the divergence between modeled temperature and observed is setting new records with every passing month. The divergence for the 36-month moving average is now at about 0.35°C, already an embarrassment for the climate modellers.
Even more stunning, the rate of divergence using the second order fitted trends shows that the models are performing even far worse than we thought. Rather than depicting a steady divergence, the curves show that the divergence is actually accelerating!
The following shows what the divergence will look like in about 10 years time should the current observed trend continue, i.e. a slight warming:
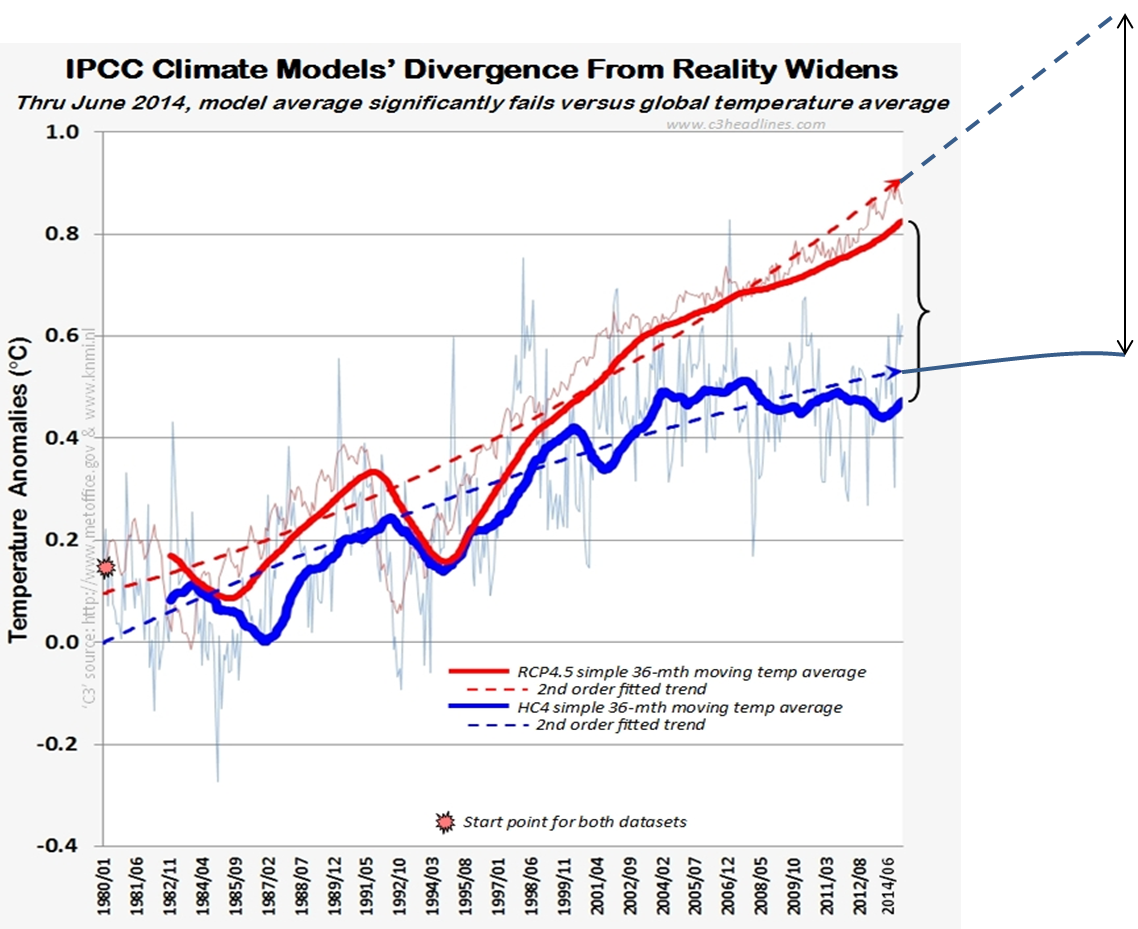
Extrapolating about 10 years out. By 2025, the divergence will be 0.6°C (and even more if the earth cools, which many scientists are projecting).
What does this all mean? Should the trend continue over the next decade or so, the error will be greater with each passing year, and it won’t be long before it’s glaring. Even the trickiest graphic layouts and chart manipulations soon will not be able to hide the gaping difference.
So even if the current decade manages to be a little warmer than the last, the model error will still be sticking out more than ever.
Time is truly on the side of the skeptics. For the alarmists, it is running out – fast!


well, we should look at the trend, not the 2nd order one, otherwise why not use higher orders? it is always the same issue what is the right time spell to look at the data..
if we can use a 15 years period the divergence of the recents trends is cleaR;
what are the parameters of the models used here? are the results calcultated using the right aemissions of CO2 ..i guess yes but??…
never forget even the warmists let an open little door for the no catastophy scenario…
As long one of their model is not far of data they can pretend it is ok…
the point is they are sure there will be a catastophy, even the range of their models shows, in their own logic, it could be not catastrophy happening.
their assessment of the probability is weird.
Of course one cannot extrapolate much with polynomial curves. In fact the observed temps are expected by many to drop instead.
Greens throw a tantrum – SPD vice chancellor Gabriel declines to cut German financial support via state owned bank KfW (which is GARGANTUAN) for Australian expansion of coal harbour at Wiggins near barrier reef. After all, reef! Climate Change! Evil coal!
http://www.handelsblatt.com/politik/deutschland/zerstoerung-des-great-barrier-reef-gabriel-macht-deutschland-zur-lachnummer/10247106.html#
Probably the Germans have negotiated favorable terms for getting their hands on some of the coal in exchange for the support.
Hmm… a demand to stop burning Australian coal in Germany?
What the Greens call a “substantial climate protection measure” (substanziellen Klimaschutzmaßnahme) was evidently ever one. The Green persist in trying to instil the delusion that continued “nice weather” corresponds to a protected climate; when in essence, it is the opposite!
Ask them how many hurricanes per season and what strength consitutes a “protected climate”.
Ask them what range of temperatures there should be on the 10th of September in a protected climate; where the sun will shine, where the rain will fall and where white, fluffy clouds will temper the harsh sun.
If they don’t know those things, how can they tell if climate is being “protected”?
Ask them if they understand the concept of “average”.
Australia’s banks are currently copping a lot of angst from the great unwashed in relation to the financing of coal projects. One large regional bank, the Bendigo and Adelaide Bank, not one of the “big four” (Commonwealth, ANZ, NAB and Westpac) has recently caved-in to these anti-coal demands.
The Bendigo and Adelaide Bank has also angered a lot of regional Victorian residents by refusing to accept the deposits of a local group attempting to stop the building of a Mega mosque in Bendigo, a large Victorian regional city. But at the same time we hear that the Bendigo Bank is also apparently keen to promote its petrodollar business? I guess all hydrocarbons ain’t equal when it come to some banks?
” refusing to accept the deposits of a local group attempting to stop the building of a Mega mosque in Bendigo”
The same kind of thing is happening in Munich with Michael Stürzenberger, who leads the protest against such a project.
Maybe OWS was right, and bankers actually ARE evil.
Most of the establishment will continue to insist warming has not even paused and the models have been 110% right. They will even say that measurements that indicate otherwise do not indicate otherwise.
They can stick to that position for at least another three years.
And who knows the future? There may be an upturn which saves them. It might be a brief upturn or the real thing. It wouldn’t matter. The upturn would be hailed as a proof never to be questioned.
If things keep ticking over as they are, they’ll have a real “hockey stick” graph in a few years. If temperatures drop, as so many of us expect, even sooner.
[…] https://notrickszone.com/2014/08/01/divergence-between-model-temperature-and-reality-reaches-record-h… […]
I have three objections with how the data are presented in this article.
.
While the author had no bad intentions, his choice of terms and decisions on charting could have been better.
.
The term “climate models” suggest science.
.
Unverified models that do not correlate with real data do not deserve the respect the term “climate models” gives them.
.
A more accurate term would be “computer games”.
.
Wild guess predictions of the future climate, with no correlation with reality over the first ten years of 100- year forecasts, are not science.
.
The attempt to show on a chart how far reality and the computer games might diverge ten years in the future falls into the same trap as the climate astrologers — the assumption that the future is predictable.
.
Since when is predicting the future called “science”?
.
The use of 36-month moving averages and fitted trends obscures the thing that should be MOST important to real scientists — actual raw data — but raw data are barely visible in the chart backgrounds.
.
Real scientists should present real raw data whenever possible, and not try to make a pretty chart with averages and trend lines.
.
The raw data show the average temperature since 1979 peaked in 1998.
.
That fact is important.
.
A 36-month moving average does not show that peak, so it obscures the real data.
.
Even using an average global temperature obscures reality (significant warming in the northern half of the Northern Hemisphere and almost no warming elsewhere, especially in the Southern Hemisphere).
.
If you look at what has really happened to Earth’s temperature since the “era of manmade CO2” began in 1940, we have had cooling most of the time (1941 to 1976, and 1998 to 2014) and LOCAL warming from 1979 to 1998 (most of the Earth had virtually no warming since 1979, so the term “global warming” to describe what has happened since 1979 is misleading).
.
The terms and charts used in support of science are VERY important for communicating with the general public.
.
The term “climate denier” is very important.
.
The simple but now discredited “hockey stick chart” was very important.
.
Computer games, smoothed “pretty” charts, and projections of the future climate are the tools of the science deniers / climate astrologers.
.
Since there is no chance to debate climate astrologers (they don’t debate), if we are ever going to convert climate change “believers” into our kind of people — those who trust logic and data, uncolored by political agendas, it’s (unfortunately) important to start by ridiculing their computer games, the bribes their so-called “scientists” (well, they do have science degrees) take from governments to play computer games all day (not science), and the inaccurate predictions they make.
.
Those of us who believe in science should never obscure real temperature data with smoothing and averages, and mix real data with our own projections of the future climate.
.
I liked some of the older “coming crises” better, such as the hole in the ozone layer — that sounded a lot scarier than a little warming in the hundred years.
.
Meanwhile, real environmental problems, such as the gross air/water/land pollution in China, gets ignored by the US “warmists”.
.
For the warmists, climate change is 99% politics and 1% science — yet another in a long series of false environmental crisis since the 1960’s to scare the general public into doing whatever they want.
“The core question is how accurate are the climate models and are they really accurate enough to use for policymaking? ”
I have an alternative core question for you. Is climate modeling a valid and verifiable exercise ? Since the models purport to predict the future – which automatically puts verification out of reach – I relegate the whole exercise to soothsaying and prophecy.