An Empirical Review of Recent Trends in the Greenhouse Effect
By Robin Pittwood, Kiwi Thinker
Abstract
The core of the human caused global warming proposition is that an increasing level of greenhouse gases acts to reduce heat loss from the planet making the atmosphere here warmer. The amount of warming anticipated by the IPCC models is from about one to several degrees C for a doubling of CO2 concentration.
But a conundrum has arisen lately: While CO2 has continued rise significantly the temperature has not. There has been no global warming since about 1997. Scientists on both sides of the debate have noticed this and have offered something like 55 explanations as to why this could be so. Some of those explanations lock into the dogma built into the IPCC models, taking for certain that the greenhouse effect is increasing, but because there is no atmospheric temperature rise, they then have to explain the retained heat is somewhere else.
Is the greenhouse effect occurring as the IPCC models propose?
This study analysed two important factors directly associated with the greenhouse effect, atmospheric temperature and outgoing radiation and finds that outgoing radiation has not declined. The missing heat has gone back to space as usual. But more importantly the (lack of a) trend observed in an empirical derivation of the Stefan Boltzmann relative emissivity factor directly contradicts the greenhouse theory built into the IPCC models.
Article
Regular readers at any of the main climate change blogs will be aware that since about 1997 there has been nearly no global temperature rise. And they will know too, that this is despite atmospheric CO2 concentration continuing to rise. To date there are some 55 ideas to explain this slowdown in global warming. Some of the ‘explanations’ presume the so-called ‘greenhouse effect’ must still be increasing as the IPCC models calculate; it’s just that the heat has been hidden elsewhere, maybe deep in the ocean.
This study, based on 34 years of satellite data; outgoing long-wave infrared radiation (OLWIR) and temperature, demonstrates otherwise.
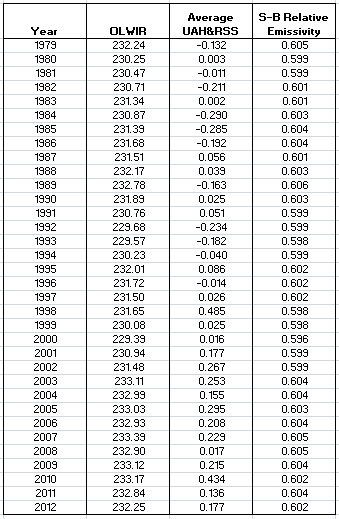
I used three data sets, OLWIR from NOAA, and the average of both UAH and RSS for global temperature.
I obtained monthly average OLWIR (W/m2) for each 2.5 degree latitude by 2.5 degree longitude area of the globe. After converting the netCDF files to Excel, I scaled each 2.5*2.5 area’s OLWIR to account for the varying size of its area, resulting in a global average OLWIR. (There was some missing data mid 1994 to early 1995. I populated this by a linear interpolation). The resulting annual average OLWIR is shown in the graph below for the years 1979 to 2012. A linear regression fit shows a generally increasing trend in OLWIR over this period.
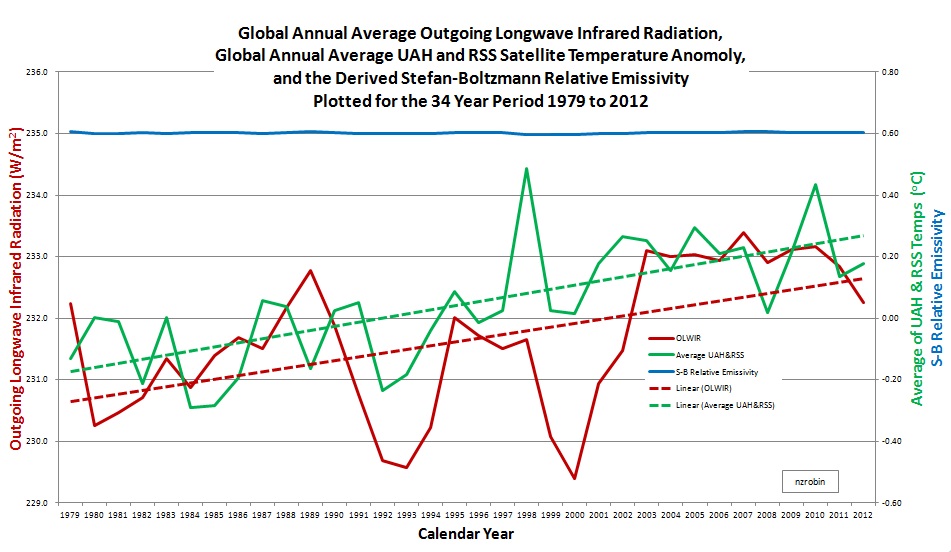
The temperature data is also plotted on the graph below. A linear regression fit shows a generally increasing trend for the years 1979 to 2012.
The relationship between temperature and emitted radiation follows a universal law of physics, Stefan Boltzmann’s law states the emitted radiation is the product of the fourth power of absolute temperature and an emissivity factor. A reduction in the emissivity factor means less outgoing radiation for a given temperature. That would indicate a stronger greenhouse effect. An increase in the emissivity factor means more outgoing radiation for a given temperature. That would indicate a more transparent atmosphere. The study derived earth’s emissivity factor for each of the 34 years and the results displayed.
Using an average global temperature of 287 Kelvin added to the temperature anomaly, the relative emissivity has been derived for each year using the formula:
j / (k*T^4)
where j is OLWIR, k is the Stefan Boltzmann constant, and T is the temperature.
If the greenhouse effect was increasing, relative emissivity should be declining. A quick look at the graphs shows clearly this is not the case.
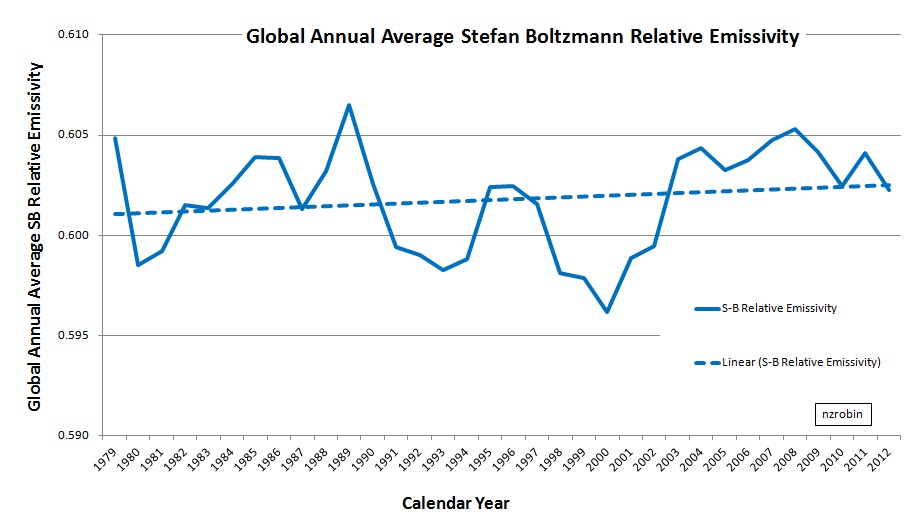
Our planet’s relative emissivity has been flat-lining, despite increasing CO2 concentration over the study period. The derived emissivity factor, being basically constant, directly contradicts all of the IPCC models. No increased greenhouse effect is observed.
Findings:
The two primary findings of this empirical study are:
- Outgoing radiation has not declined over this period as expected by IPCC models. The missing heat has gone back to space – as usual and as per Stefan Boltzmann’s law, via OLWIR, and,
- The increasing greenhouse effect expected by IPCC models, has not exposed itself. There has been no increased greenhouse effect over this period. [A closer inspection of the relative emissivity trend shows the atmosphere is even becoming a little more transparent – though little should be made of this given the variability of the data].
Conclusion:
The core of the human caused global warming proposition is that an increasing level of greenhouse gases acts to reduce heat loss from the planet making the atmosphere here warmer. But is the greenhouse effect occurring as the IPCC models propose? This study analysed two important factors directly associated with the greenhouse effect, atmospheric temperature and outgoing radiation and finds that outgoing radiation has not declined. The missing heat has gone back to space as usual.
But more importantly the (lack of a) trend observed in an empirical derivation of the Stefan Boltzmann relative emissivity factor directly contradicts the greenhouse theory built into the IPCC models.
The original post on this study may be found here.
Data Table:


Both graphs flatten after 2000 by my eyeball Mk11
Yes, that’s right. There could be 55 reasons for that levelling off. Apologies of the trend line is off putting. I certainly don’t mean for it to be extrapolated if anyone was doing that.
The graph does show that generally speaking temperature and OLR have been moving together, roughly (maybe even closely) in accordance with SB law, contrary to classic greenhouse theory.
Some layman thoughts; over the internet I learn that any physical body warm enough to radiate over any specific band of IR will NOT absorb that band of IR until it has cooled again. It may absorb the odd photon but, because of the much larger emission of photons in that band, there will be no gain in stored energy. Please correct me if my understanding is wrong.
Now every CO2 molecule in the atmosphere will be at the local air temperature which varies from 288K at the surface to about 218K at the tropopause. The PEAK temperature of the 13 micron band is 223K so only when close to that altitude will CO2 be able to absorb some energy. And at that altitude the CO2 molecule is just as likely to absorb a photon from a nearby CO2 molecule rather than from the surface. How could you tell anyway? It is well known that CO2 is active over the 15 micron band which includes some 3,800 lines of emission/absorption covering the 13 to 17 micron bands. Peak temperature for 15 microns is 193K and 17 microns is 170K, temperatures not found below the tropopause, except maybe over Antarctica. 🙂
Thus my understanding is that CO2 is TOO WARM to absorb any radiation from the surface centred on the 15 micron band. But this does not inhibit the CO2 from radiating over that band and about half that radiation will reach the surface. But will it warm the surface? NO! By the same argument above, the surface is TOO WARM to absorb that radiation.
I have not mentioned the 2.7 and 4.3 micron bands where CO2 is also very active because only sunlight can produce such energetic photons and once absorbed by CO2 do not reach the surface. A cooling effect never discussed.
How CO2 can be called a ‘greenhouse gas that traps energy’ is beyond my comprehension.
“Thus my understanding is that CO2 is TOO WARM to absorb any radiation from the surface centred on the 15 micron band.”
I would say it differently; CO2’s absorption /reemission bands are centred at color temperatures of 200K and at 600K. So CO2 will especially well absorb IR coming from objects at -80 deg C (as their blackbody spectrum has the Planck maximum at the right wavelength, see Wien’s displacement law), and from objects at 330 deg C( think blast furnaces).
For ordinary surface objects, their IR mostly goes just through.
But you might be right – does CO2, when heated above -80 deg C, lose the ability to absorb IR photons at 14 micrometer because it is “saturated” in that band? Any physicist know the answer?
For Richard111
I won’t comment on your comment but merely point you to some additional info.
Solar radiation as discussed in the paper cited is shown in the diagram on page 4 of Atmospheric Radiation: Theoretical Basis, Goody and Yung. OUP, 1989 reprinted 1995.
http://books.google.com/books?id=Ji0vfj4MMH0C&printsec=frontcover#v=onepage&q&f=false
The total amount of energy emitted by the Sun and falling on the Earth (left) is equal to the total amount of energy re-emitted by the Earth (left).
Actually the AGW theory holds that the total amount of energy emitted by the Earth is not in equilibrium and that the Earth is warming at the rate of 0.6 Wm-2 compared with 340 Wm-2 incoming from the Sun. So the theory claims that the outgoing is less than the incoming by about 0.18% and that this should cause visible warming.
A chemist or physicist or geologist might suggest that such a small imbalance should not be expected to cause visible warming. The visible heat that is missing is so little that it could be stored, not as temperature change, but as potential energy in the form of heat sinks, such as latent heat of phase change in water (more water vapor) or stored in increased organic material (by photosynthesis) or stored in inorganic material (endothermic reactions such as formation of carbonates by foraminifera, etc).
Although the areas under the Goody and Yung curves may not be equal, they almost the same. The horizontal position of each curve is set by the temperature of each body, the Sun around 6000 degree Kelvin and the Earth around 300 degrees Kelvin.
For each region of the Earth and each season, the horizontal position of the curve will shift left or right because of differences in temperature and differences in conformance to blackbody criteria.
The figure in Goody and Yung is the average for the whole Earth based on idealization of the Earth as a blackbody whereas the Earth is a greybody with varying degrees of greyness.
Best wishes with your studies.
Something to think about here.
http://www.principia-scientific.org/fred-singer-closing-in-on-fact-co2-doesn-t-affect-global-temperature.html
But the observation remains:
Outgoing radiation (the only energy leaving the planet saving us global warming Armageddon) increased over the 34 year period, while temperature generally rose during the period, and the relationship seems to closely follow Boltzmann with an RE of 0.6. There could be many reasons for this, water, clouds, …
Sorry, but the NOAA OI OLR dataset is not a good one to use here. That is basically the AVHRR dataset which in this regard is riddled with problems and unsolved inhomogeneities. It is basically useless for mid to long-term trend analysis.
Better then to collate the ISCCP-FD, the HIRS and the ERBE-CERES data. Which, of course, would show you the same thing, only better and more precise. The OLR at the ToA simply follow global temps. So it’s gone up in steps over the last 35 years, but flattened and finally dropped ever so slightly during the last 10-12-15-17 years.
“The OLR at the ToA simply follow global temps.”
Warmist theory demands that it should not; but that it should follow some function of global temps and CO2 /water vapor concentrations.
Thanks Kristain,
I appreciate the pointers to better data.
Thanks for the pointer to the principia scientific article Richard. Interesting to read of Fred Singer’s change of views, and the maths by the author.