Additional Thoughts On Natural Cycles
By Ed Caryl
In Natural Cycles In A Random World Are Unmistakable…Future Holds Nothing To Fear, we showed plots of simulated temperature generated in Excel using the sum of three cycles and a random number generator.
Some commenters realized that if you averaged many runs, like the professional climate “scientists” do, the result would be the underlying cycles. Some realized that doing the averaging step is unnecessary, as the underlying cycles are simply three columns in the Excel file. Here is that plot.
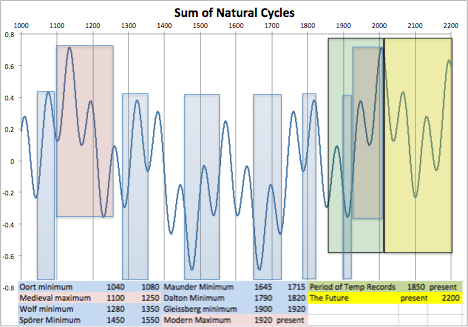
Figure 1 is the sum of the three natural cycles, the 62, 204, and 1040-year cycles. The green rectangle outlines the historical temperature record, from 1850 to 2015. The blue rectangles highlight cold periods, the red rectangles the warm periods. The numbers are the beginning and end years for each period. Yellow highlights the future.
Note that in figure 1, the cycles in the green rectangle follow the known temperature record. See figure 2, below. The rest of the plot, before the known period, reflects what we know generally about the Medieval Warm Period and the Little Ice Age. I leave it to the reader to interpret the future.
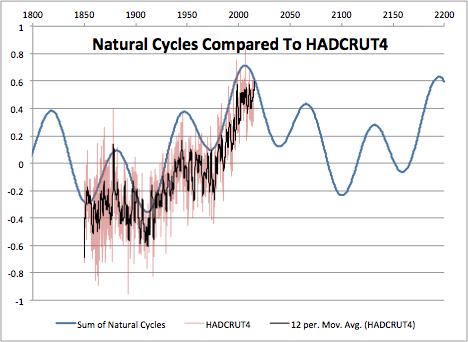
Figure 2 plots the natural cycles from figure 1 and the HADCRUT4 global anomaly index. The vertical offset is due to the HADCRUT4 baseline choice.
The three natural cycles are not, of course, as fixed in frequency or amplitude as in these Excel plots. As we go back in time, the climate that actually occurred will drift from these calculations. But we know that the Roman warm period occurred about a thousand years before the Medieval warm period, and that it happened with about a 200 year cycle imposed on it.
There are several papers that discuss 1470 ±500 year cycles. Those that occurred during the last ice age are labeled Dansgaard-Oeschger events. In the Holocene, they are called Bond events. The Bond events tend to happen at 1000 year intervals, thus the ±500 year error margin. Solar scientists refer to a thousand year plus Hallstaat Cycle that looks like the thousand-year cycle used here. Bond events and the Hallstaat Cycle appear to be the same thing.
During the last ice age there were also deeper periods of cold known as Heinrich events. These occur at approximately 10,000 year intervals. During the last ice age, these events tended not to be sine-wave in shape, but punctuated cold intervals. Bond events in the Holocene such as the 5.4 and 8.2 kilo-year events also appear as abrupt cooling followed by equally abrupt warming. Figure 3 is a plot of Bond events from Bond et al. data here. The last column “stacked” data was used for this plot. It is a combination of several proxies. The resolution is 70 years between points, so only the longer cycles are resolved. Both scales have been reversed to match figure 1.
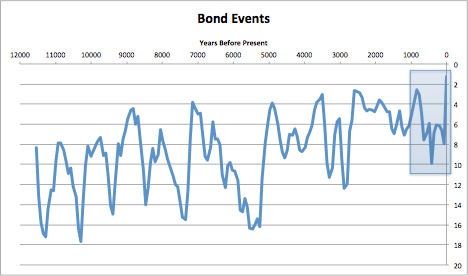
Figure 3 is a plot of Bond events in the Holocene. The outlined area is the time covered by figure 1 up to the present. Down is cold, up is warm. The 70-year resolution captures only the longest of the warm and cold periods in the last one thousand years, the Medieval Warm Period, and the Wolf, Spörer and Maunder cold periods.
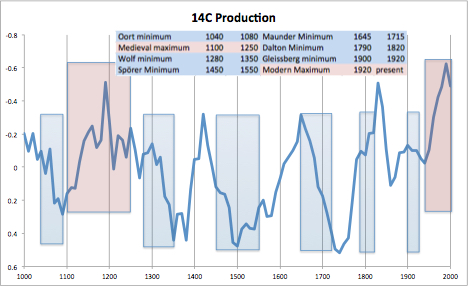
Figure 4 is a plot of carbon-14 production at the top of the atmosphere. This plot is also from Bond et al. from the same source as above. The cold and warm periods are highlighted as in figure 1.
The 200 year cycles appear solar-based. The resolution in figure 4 is 10 years. Cold periods happen when 14C production is declining, warm periods when it is increasing. As 14C is produced by cosmic rays at the top of the atmosphere, there is a delay before it appears as captured carbon in living things.
If past temperatures are related to known solar and ocean cycles with increasing precision in the modern era, then future temperatures will also be related. The present warming is simply a Bond warming event just like more than a dozen similar and even more dramatic warming events in the last 10,000 years. The recent warming is simply climate following natural cycles. We are now at the peak of the sum of three cycles, each cycle also at a peak, a grand maximum. What follows will be cooling as all those cycles go negative.


Pretty close to reality if you also add in a longer term cooling curve for the whole of the Holocene. MWP warmer than now etc.
Its going to make the climate models look even sicker when the cooling period starts. Will be hilarious watching the likes of Mingland trying to justify them.. 🙂
We should throw more money at solar panels, wind turbines and useless climate models just in case. The heat might be hiding somewhere. Also, the populace loves it when the ruling class squanders their tax payer money on giant monuments.
It is very easy to get our heat back. We should not squander our money to useless satellites as surface stations are much more interesting. The WMO should re-open all the dissident stations, they closed two decades ago. These must now show warming trends, isn’t it?
But if we stop squandering billions, what shall the cronies eat?
Not sure you got the tense right in the last sentence, Ed. Where I’m sitting it’s pretty bloody cold already.
Thanks for the De Jager link. Hadn’t seen that.
I would like to tell you of my latest book and documentary.
‘The Deliberate Corruption of Climate Science’.
My latest documentary and video of my presentation.
https://www.youtube.com/watch?v=tPzpPXuASY8
My website is
Thank you.
Tim
https://www.youtube.com/watch?v=tPzpPXuASY8
https://www.youtube.com/watch?v=sO08Hhjes_0
http://www.drtimball.com
THANK YOU !! 🙂
Your tenacity and fortitude is a blessing to us all.
Bill Gray has his say, in a new paper.
http://tropical.atmos.colostate.edu/Includes/Documents/Publications/gray2012.pdf
“New”? He wrote it for the 2012 ICCC nearly three years ago.
Yep, I forgot , and thought it was new, oh well. 🙂
Your site is unreadable in an iPhone. The floating “share” icons (Facebook etc) which are100% useless (since they pop up when you click share icon on bottom right) on left side cover part of the text for all but a couple lines.
Just not gonna bother any longer to even try to read.
Sad too – as I find plenty of interesting content w you
I still think that the “cycle2 analysis does not make any sense.
It ignores everything that is important for climate, mostly feedbacks which will break the “cycle” once you reach a certain point.
——————————–
With how many people with some climate knowledge have you discussed this theory?
Because it looks like “sceptics” simply talk to fewer people with less controverse positions, as this graph illustrates.
http://d35brb9zkkbdsd.cloudfront.net/wp-content/uploads/2015/05/Graph3.jpg
Another soddy argument that’s beside the data.
Well but at least we have sod as an audience.
Sod, first, you are making an assumption that there are “feedbacks” that break cycles. The only one apparent in the climate record is the glacial/interglacial cycle, and that is driven by the even longer Milancovic cycles driving solar energy north of a certain latitude allowing ice caps to grow.
Did I discuss this with other climate scientists? Do you mean, did I provide an opportunity for “group-think” to steer me back to “right thinking”?
Also, sod doesn’t even know that a LINEAR feedback wouldn’t break ANYTHING. (but rather, would be the CAUSE of sinusoidal oscillations) But then, his supreme formal mathematical education probably didn’t tell him the difference between linear and nonlinear systems.
…oscillations for a negative linear feedback. A positive linear feedback would of course lead to an exponential function. But that is not what we observe. It would also have made it impossible for observers to emerge.
I have to admire your persistence. It can’t be easy posting on here only to be torn to shreds every time.
On a related note and may therefore be of interest.
“A new study, by scientists from the University of Southampton and National Oceanography Centre (NOC), implies that the global climate is on the verge of broad-scale change that could last for a number of decades.
The change to the new set of climatic conditions is associated with a cooling of the Atlantic, and is likely to bring drier summers in Britain and Ireland, accelerated sea-level rise along the northeast coast of the United States, and drought in the developing countries of the Sahel region. Since this new climatic phase could be half a degree cooler, it may well offer a brief reprise from the rise of global temperatures, as well as resulting in fewer hurricanes hitting the United States.
The study, published in Nature, proves that ocean circulation is the link between weather and decadal scale climatic change. It is based on observational evidence of the link between ocean circulation and the decadal variability of sea surface temperatures in the Atlantic Ocean.”
More at http://www.sciencedaily.com/releases/2015/05/150527133932.htm
h/t GWPF.
Excellent graph, and quite illustrative of the potential “climate change” upon us.
I was looking for a way to archive this (with your permission, and full attribution is guaranteed), and one way I do this is to make a back-up print copy. I am unable to get my computer to read this document, to make a print. May I request some assistance on your end, for some .pdf or other printable format?
My e-mail address is on file with your site. Thanks in advance for any assistance rendered.
Mark H.
Mark,
I have posted a .pdf copy to Dropbox at:
https://www.dropbox.com/s/tqxyjza5jiiotu1/Additional%20Thoughts%20On%20Natural%20Cycles.pdf?dl=0
Thank you so much. I now have an archive copy, a hard copy, and will soon have this stashed away on a flash drive (just in case).