[Sticky post…new articles follow after this one.]
=====================================
By Ed Caryl
This is a follow-up to the article AWI’s Sloppy Antarctic Peninsula Science…Overlooked GISS Temperature Data, Snowfall Amounts. The reality is that the situation at the South Pole is worrisome.
Ocean around Antarctica markedly colder since 2006…
It is difficult to believe that global warming/climate change is doing anything to the glaciers of the Antarctic Peninsula and the Western Antarctic. Here is why: The ocean around Antarctica has been getting markedly colder since 2006; sea ice is increasing, especially since 2012; and land temperatures have been cooling since the El Niño of 1998.
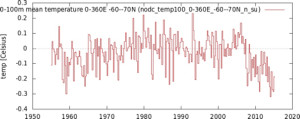
0 – 100m ocean temperature plummeting:
Figure 1 is the upper 100 meters of ocean south of 60°S. There’s been a rapid cooling since about 2007. Negative numbers are used to select latitudes in the Southern Hemisphere. The source is KNMI, link.
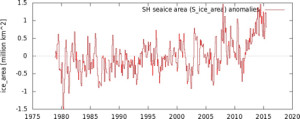
Sea ice skyrockets…
Figure 2 is the Southern Hemisphere sea ice area anomaly. The source is KNMI, link.
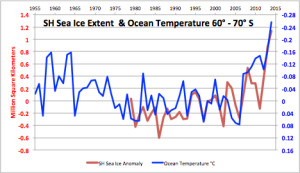
Figure 3 is a plot of the annualized ocean temperature and Southern Hemisphere ice extent using the KNMI data from figures 1 and 2. Ocean temperature is inverted to show that the ice extent matches the cooling ocean. Note the correlation between the two curves.
Antarctic Peninsula sees dramatic cooling…
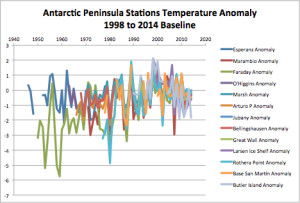
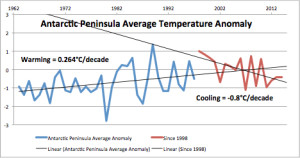
Figure 4 is a plot of the temperature anomalies at 13 Antarctic stations on or near the Antarctic Peninsula. The baseline is the 1998 to 2014 average for each. Antarctic peninsula has been cooling since 2000. Data source: GISTemp, link.
There is a lot a variation in the annual average temperatures for these stations, especially in the years where there were only two stations reporting, Esperanz and Faraday. For that reason, the average in figure 5 begins in 1963 when O’Higgins began reporting.
Figure 5 is the average anomaly for the stations in figure 4.
There were two peaks in temperature, one in 1989 and a second during the El Niño year of 1998 which caused a steep upward in temperature world-wide, and especially in Antarctica. But since then there has been a dramatic cooling. There is no “hiatus” on the Antarctic Peninsula, there is marked cooling.
Larsen Ice Shelf station cooling at a rate of 18°C per century
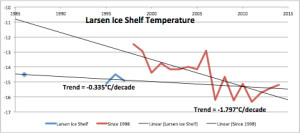
Cooling is especially true of the very location everyone is concerned about, the Larsen Ice Shelf. There is an automated weather station (AWS) there that has been reporting continuously since 1995.
Figure 6 is the annual average temperature at the Larsen Ice Shelf. The source is GISTemp.
Figure 6 shows the step in temperature in 1998 at the Larsen Ice Shelf. The trend in cooling after 1998 is 1.8°C/decade, the second fastest cooling on the Peninsula. Butler Island is cooling faster, at 1.9°C/decade. (Of course 18°C/century cooling is meant as sarcasm, and is only a trick that warmists like to use.)
Result: exploding sea ice
It is easy to see why the sea ice around Antarctica is increasing. The average ocean temperature from the surface to 100 meters dropped below the freezing point in 2008 and has stayed there. It is hard to melt ice when the water it is floating on is below the freezing point of fresh water, and seldom rises above that temperature.
The Southern Ocean around Antarctica has similar warming and cooling cycles as the North Atlantic, just not as strong. The cycle is now going negative, and temperatures on land and in the ocean are going sharply cooler, with ice increasing. There is no warm ocean water melting ice shelves from below. The ocean is getting colder and is below freezing most of the time. Any increase in ice calving off the glaciers must be from increased snow feeding those glaciers or geothermal heating from volcanism under the ice.
Welcome to reality.


And the reason may just be the greenhouse effect: http://elib.suub.uni-bremen.de/edocs/00104190-1.pdf
If you look at his analysis, the claim is that if the surface is colder than the atmosphere, the Greenhouse effect is negative (see eqn. 2.10 et seq.)
Here is what I would like to know: If the surface warms from a Greenhouse effect, whereas the upper atmosphere cools, the radiant flux from the surface to the atmosphere is q = (sigma)[(epsilon)Tsurf**4 – Tatm**4] and would not the magnitude of the heat transfer rate q increase?
This is the substance of the Gerlich and Tscheushner argument against the GH atmosphere and I cannot reconcile it.
I remain skeptical until I get a rational explanation.
Thanks Ed. I got as far as the ‘radiative forcing’ chart and crashed out. As a layman I must rely on basic science. This tells me all materials are subject to the same laws. So I ask why should CO2 in the atmosphere absorb radiation only from the surface? What about the radiation from the rest of the CO2 all around? CO2 is limited to three bands; 2.7, 4.3 and 15 microns. The first two bands are only effective when the sun is shining. The 15 micron band is effective all the time and covers a range of 13 to 17 microns. This amounts to about 18% of the energy from a body radiating at a temperature of 288K (15C). The so called ‘backradiation’ from CO2 in the atmosphere can only delay the surface cooling not warm it.
Where is the science please that explains how CO2 in the atmosphere warms the surface?
There is no “science” behind it, but there is plenty of bullying to “explain” it.
That’s all there is – appeal to authority and attempted humiliation.
And attempted character assault.
“The 15 micron band is effective all the time and covers a range of 13 to 17 microns. This amounts to about 18% of the energy from a body radiating at a temperature of 288K (15C).”
Don’t forget that water vapor absorbs the same wavelengths; and is generally more abundant than CO2. So a change of x% in CO2 concentration might only result in a change of x/20 % in absorption (for instance).
https://en.wikipedia.org/wiki/Electromagnetic_absorption_by_water
Thank you Dirk and Brian. Helps my confidence out in the wide world. 🙂
13 microns IR is consistent with a black body of temperature -50 degree C, 15 IR is consistent with a black body of -80 degree C and 17 microns is consistent with a black body of -110 degree C. CO2 doesn’t absorb at the 10 micron level, which is 15 degree C or the average earth temperature. It also doesn’t absorb at the 0 degree C level which is about 11 microns. CO2 simply doesn’t absorb and radiate heat in the above 0 Degree C range. How can something colder than freezing cause warming?
http://www.ces.fau.edu/nasa/images/Energy/GHGAbsoprtionSpectrum.jpg
Just like a blanket does not warm you… it only delays your cooling?
Ed, I have been looking at and storing the NuSchool Earth/Wind Map centred on the Antarctic every day since the 30th of May, you can see that the Antarctic is a Giant Cold Engine, ie the opposite of a heat engine.
It is surrounded by weather systems taking the warmth from the Surface of the Sea all around it and replacing it with cold Air.
Beyond the Sea Ice is a band of Sea Water that is 5-10 degrees C colder than sea right next to it, the transition over distance of a few hundred miles of sea is staggering.
It is cooling the tip of South America and New Zealand.
I can safely say it’s cooling the southern parts of WA, SA, NSW, all of Vic and Tasmania.. Still that’s only “weather” sic and won’t affect the outcome of another hottest year on “record” sarc. My faith in scientists claiming that it will be is being sorely tested as my energy costs double to keep me warm.
O/T Greenhouse Effect stopped working in Mannheim today.36 deg C yesterday, 18 deg C today.
The Greenhouse Effect stopped working in Braunschweig, 400 km further North, 3 days ago, and now here.
It happens wherever I am. I have developed a Greenhouse effect stopping power. When my power strikes I’m surrounded by lightning.
And heavy rains, enormous winds, and sometimes pingpong ball sized hail. The worst thing is, I can’t control it and it’s caused by days of sweating.
My power seems to grow. This is the first rapid 18 deg C drop I caused.
Had you thought of a couple of weeks’ holiday … say Paris … maybe late November … ? 😉
I can’t control it. It’s growing. By November I will probably have iced over the whole of Western Europe.
That reminds me of a Schwarzenegger film.
UK starting to even the playing field..
http://utilityweek.co.uk/news/summer-budget-treasury-delivers-39bn-body-blow-to-renewables-sector/1149402#.VZ20ZWcw-fA
Renewables chuck a hissy-fit ! 🙂
https://notalotofpeopleknowthat.wordpress.com/2015/07/08/renewables-must-now-pay-climate-change-levy/
I thought the AGW hypothesis predicted warming in the atmosphere (which didn’t happen.) Now someone is claiming the opposite, that it should be cooling (at least near the south pole) ?
Your first link, to 0-100 m ocean temperature, does not work for me — it returns a white page that says only “Please select a field”
David, delete the get-index.cgi part of the URL. While you’re looking for the data, look at the OHC and temperatures for other depths, not just 100 metres. And have a look at the salinity as well. The story is much more complicated than “dramatic cooling”.
T.
You will need to go through the selection process like I did. Set the parameters as in the image. KNMI is a very useful site for climate studies. You should learn to use it.
This is exactly correct. The Antarctic has been on a cooling trend and this will accelerate going forward.
Salvatore likes to prosnosticate. He has an extremely poor track record:
“…here is my prediction for climate going forward, this decade will be the decade of cooling.”
– Salvatore del Prete, 11/23/2010
http://ourchangingclimate.wordpress.com/2010/10/20/andrew-dessler-debating-richard-lindzen/#comment-8875
“Temperatures in response to this will decline in the near future, in contrast to the steady state of temperature we presently have,or have been having for the past 15 years or so.”
– Salvatore Del Prete, 11/6/2012
http://www.drroyspencer.com/2012/11/uah-v5-5-global-temp-update-for-october-2012-0-33-deg-c/#comment-64939
Why I think this is what I have written below.
The last millennium 1000AD – 2000AD has been the coldest of the Holocene overall.
Most of the Holocene temperature loss ~-1.5°C has been in the last 3 millennia since 1000BC
edhoskins says which is spot on.
Going forward the long term climate drivers Milankovitch Cycles, Solar Variability (secondary effects),and these factors which moderate the first two factors those being , Geo Magnetic Field Strength (enhancing solar variability when weak)., Land /Ocean Arrangements., Ice Dynamic are all in an overall cooling pattern since the Holocene Optimum.
The warm periods since the Holocene Optimum being tied to solar variability which is superimposed upon the general climatic trend. MEDIEVAL ,ROMAN warm periods to name two.
Further refinement to the temperature trend since the Holocene Optimum ,coming from ENSO, PDO/AMO phase and Volcanic Activity.
I would say all the above when combined and superimposed upon one another can account for all of the climatic changes since the Holocene Optimum – Present Day.
Therefore going forward the trend in the global temperature should be down as soon as the maximum of solar cycle 24 ends and solar activity in general remains at sub-solar levels which it has been since 2005, and approaches my low average value solar parameters going forward, with a sufficient duration of time at or around these values.
Solar Flux 90 or less, AP index 5.0 or less, Solar Wind 350 km or less to name some of them.
These values much above these levels during the maximum of solar cycle 24 through today , although the maximum of solar cycle 24 is very weak, however the balance of this decade going forward should feature these low solar parameter readings as the very weak maximum of solar cycle 24 ends ,and once this is takes place I fully expect the global temperature trend to be in a jig saw down trend.
The latest temperature data keeps intact what I say in the above which is CO2 has no effect upon the temperature, it is all ENSO,PDO/AMO ,and Volcanic Activity driven (short term climatic factors) which are superimposed over the longer term climatic factors, which I mentioned in the above which now all point to cooling going forward.
For all the talk about AGW it has done nothing to bring us into a new climatic regime ,we are simply in the same climatic regime post the Dalton Minimum , with climate variability associated with the 11 year rhythmic solar cycle ,pdo/amo phase, volcanic activity and enso.
For the big picture Milankovitch Cycles(favorable for cooling on balance in contrast to 8000 years ago), the weakening Geo Magnetic Field and the switch from active to inactive solar activity post 2005 will work to bring the climate into a cooler and possibly a climatic regime change, maybe back to Dalton conditions.
Land /Ocean arrangements so very favorable for cooling ,and the Ice Dynamic in the S.H. becoming very interesting.
The RWP and MWP were actually just bumps in the “Neoglaciation” cooling trend that started some 3000-3500 years ago. The current slightly warm period is just another, but smaller bump.
https://edmhdotme.files.wordpress.com/2015/05/screen-shot-2015-05-25-at-11-09-40.png
“Larsen Ice Shelf station cooling at a rate of 18°C per century ”
Sorry Ed, but you don’t have the data time period to say that.
1.8ºC/decade is allowable, but you should not extrapolate a trend outside the data length…
….that is an alarmista trick, we do not need to do that.
ax/ay = x/y isn’t it?
I added that in during the editing, and is meant as sarcasm. Of course you are right. Indeed it’s a trick as we all know. But it is one that too often has been effective in convincing alarmists of warming and ice melt. So if that sort of extrapolation is okay for them, then they will have no qualms about it when it is applied for cooling. Straight line extrapolations are invalid in any chaotic system, of course.
I apologise to Ed 🙂
I never see scientists quoting data or projections in C/century. Because that’s an absurd metric in a rapidly changing climate.
I didn’t. That was Pierre’s addition.
Hi Ed, My apology is in moderation for some reason.
Pierre admitted his guilt ! 😉
OT, some lite reading for S.O.B. next time he should bless us with his clown presence..
http://joannenova.com.au/2015/07/uk-government-cuts-green-subsidies-investment-falls-calls-for-more-subsidies-rise/#more-43440
I particularly like this..
“… the Indian government had found a realistic way of tackling the green energy problems of high cost and huge imbalances in their national grid system. This entailed requiring green energy companies to guarantee their output, with an accuracy of 10%, on an hourly basis, 24 hours into the future, or face large fines”
That’s how it SHOULD be done. !
Paraphrasing Richard Feynman: Regardless of how many experts believe it or how many organizations concur, if it doesn’t agree with observation, it’s wrong.
The Intergovernmental Panel on Climate Change (IPCC), some politicians and many others mislead the gullible public by stubbornly continuing to proclaim that increased atmospheric carbon dioxide is a primary cause of global warming.
Measurements demonstrate that they are wrong.
CO2 increase from 1800 to 2001 was 89.5 ppmv (parts per million by volume). The atmospheric carbon dioxide level has now (through May, 2015) increased since 2001 by 29.58 ppmv (an amount equal to 33% of the increase that took place from 1800 to 2001) (1800, 281.6 ppmv; 2001, 371.13 ppmv; May, 2015, 400.71 ppmv).
The average global temperature trend since 2001 is flat (average of the 5 reporting agencies http://endofgw.blogspot.com/ ). Graphs through 2014 have been added. Current measurements are within the range of random uncertainty with respect to the trend.
That is the observation. No amount of spin can rationalize that the temperature increase to 2001 was caused by a CO2 increase of 89.5 ppmv but that 29.58 ppmv additional CO2 increase did not cause an uptrend in the average global temperatures after 2001.
Now look at a longer period.
Engineering science proves CO2 has no significant effect on climate. The proof and identification of the two factors that do cause reported climate change (sunspot number is the only independent variable) are at http://agwunveiled.blogspot.com (now with 5-year running-average smoothing of measured average global temperature (AGT), the near-perfect explanation of AGT since before 1900: R^2 = 0.97+ ).
The ongoing average global temperature trend is down. Monthly reported temperatures are being temporarily propped up by el Nino.
“The average global temperature trend since 2001 is flat.”
False. (And let’s not forget it’s absurd to talk about climate trends over a short interval like 13 years.)
GISTEMP: +0.05 C/decade
NOAA: +0.09 C/decade
HadCRUT4: +0.03 C/decade
Cowtan & Way: +0.06 C/decade
The statement is for the “average global temperature trend” (Each agency processes the raw data slightly differently from the others. Each believes that their way is most accurate. To avoid bias, I average the reported values from all five.) and, if you include the random uncertainty of s. d. approx 0.09 K on the reported numbers, the assertion of “false” is not justified.
The statement is, of course, not based just on the years 2001-2014 (14 years). As you say, and I agree, that would be absurd. The statement is made in the context of a simple equation, with only one independent variable (the annual average-daily sunspot numbers), which calculates 5-year-running-average global temperatures since before 1900 with R^2 greater than 0.97. Current reported values are within the extent of variation observed since before 1900.
This is combined with the discovery that CO2 has no effect on climate. The discovery uses only the relation between mathematics and the physical world, and, extant CO2 and average global temperature assessments over the Phanerozoic eon (or any part thereof). A brief description is in the “agwunveiled” paper.
Can’t find the KNMI data; the link is to http://climexp.knmi.nl/get_index.cgi but it produces a page with only this text: “Please select a field”