Prof. Fritz Vahrenholt and Frank Bosse present a guest post, reviewed by Nicolas Lewis, explaining why the IPCC’s claimed climate forcing by CO2 is overly inflated and that the world does not have to be rushing madly to eliminate CO2 emissions. Note: The above title is my own, and not of the authors. -PG
================================================
Solar activity in September 2015 / The latest science before the Paris Climate Conference
Guest post by Prof. Fritz Vahrenholt and Frank Bosse
[Translated/edited by P Gosselin]
In September our sun was quite active during its current solar cycle (SC) number 24: The observed sunspot number (SSN) was 78.1. The average for all the previous cycles this far into the cycle is 83.5, and so September of this cycle was 93% of the usual activity.
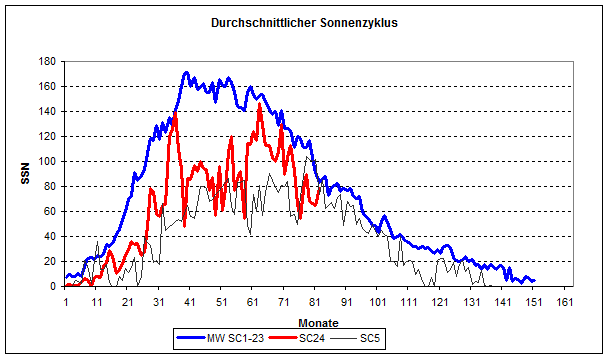
Fig. 1: Cycle 24 activity (red) compared to the mean (blue) and to the earlier and similar Cycle Number 5.
Comparing the individual cycles to each other:
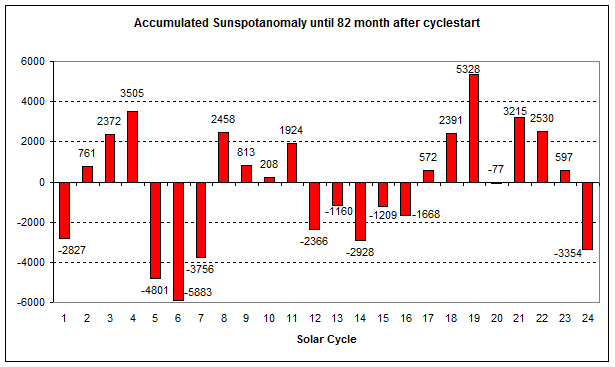
Fig. 2: The summation of the monthly deviations from the mean value (shown by blue curve in Fig. 1) for each cycle, up to month 82 since the start of the cycle. Cycle 24 started in December 2008.
We currently find ourselves no doubt on the downside of the cycle (see Fig. 1). Very often the cycles do not differ that much from each other. The important negative anomaly from the mean activity was produced already during the first 5 years of its duration.
Some physics before Paris
[Reviewed by Nicholas Lewis]
The big question that beckons to be answered before Paris is: How will the climate develop by the year 2100? What can and should be decided by policymakers so that global warming does not exceed the 2°C limit compared to pre-industrial times over the next 84 years?
At this blog we examined and concluded time and again that the anthropogenic impact on climate has been massively exaggerated by the institutionalized scientists. In any case the uncertainties in the assignment of the anthropogenic climate impact has been poorly considered. Natural factors, such as solar activity, were major factors in the past and will remain so in the future. They not only left a mark with the minimal changes in total solar irradiance (TSI), but it is not appropriate to set the sun’s impact at zero – as the IPCC does – and then assign a massive weight to the anthropogenic effects in the 21st century. For example Schellnhuber in 2009 claimed there is “an extremely simple quasi linear relationship between the global mean temperature and the total CO2 amount that will be emitted into the environment over the next decades”. In the following analysis we will ignore our own doubts and will calculate using the numbers from the IPCC.
Here we use the numbers of the IPCC AR5 on forcing: Read here.
In Table 1.2 the numbers for forcing in W/m² for a variety of factors are given, for example carbon dioxide, other greenhouse gases, land-use, etc.. This year a paper by Stevens was published on this, in which he assigned a new figure to the forcing by aerosols – pegging it at about 50% of what was stated in the a.m. document from the year 2013. We have reported on this on a number of occasions, e.g.: here/.
The relationship between total forcings and the observed temperatures since 1950 assuming it behaves as a linear function of the forcings (the current aerosol correction has been accounted for):
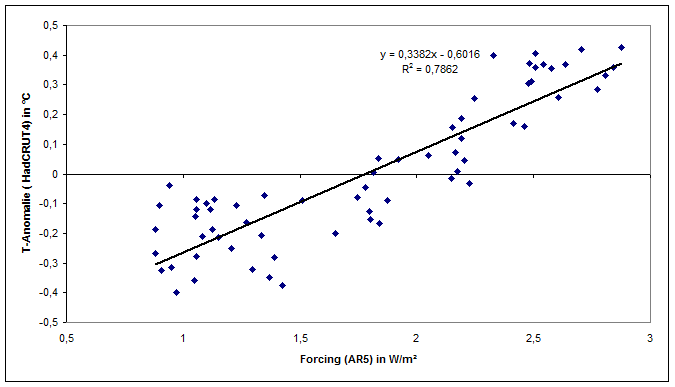
Fig. 3: Temperature anomaly using the HadCRUT4 temperature series as a function of the sum of forcings as a measure for determined global mean surface temperature (GMST).
A mean “transformation” of 0.338°C per W/m² of forcing can be read with a significant scatter among the individual annual mean values. Our climate also varies internally, not controlled by the external forcings. That becomes evident when we look at the individual years with their differences from the shown mean value (the residuals):
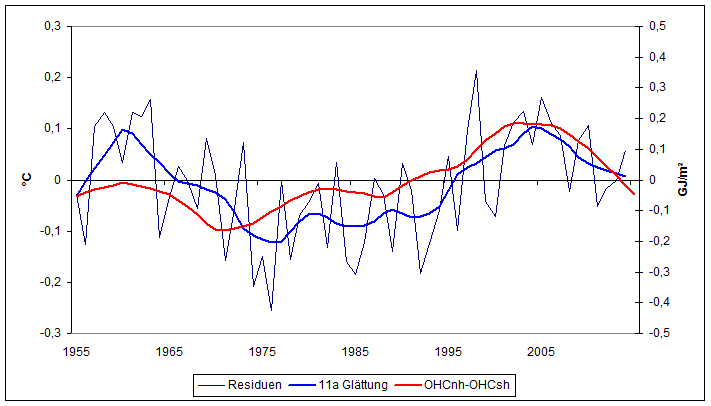
Fig. 4: The residuals of the individual years, their smoothing using the 11-year Loess-Filter (blue), and the smoothed difference of the ocean heat content (red) of both hemispheres.
The thinner blue line in Fig. 4 depicts special climate events over the past 60 years. Pronounced are the impacts of volcanoes (cooling) in the years 1984, 1985 and 1992-1994 and the 1998 El-Nino (warming). The volcanoes are shown here to be strong deviations from the forcings because these numbers are not sensible for the desired preview (we do not know when and how strong a volcanic eruption until 2100 will be) and the volcanic forcing had little impact on the temperature of a single year in the past during 1950-2014. The volcanic events were concentrated up to 1995, the consideration of the full forcing would inscribe a (negative) bias to the sensitivity of the temperatures versus the forcings. Therefore we omitted this also from the consideration of forcings from the past.
The ENSO event in the tropical Pacific also will not be considered in the preview because it is a natural internal variability. If one smooths the smaller events with a low-pass filter (bold blue curve in Fig. 4) a long-term pattern emerges. We get hints about its emergence from a paper by a team led by Alexander Ruzmaikin of the Jet Propulsion Laboratory in Pasadena. The team works on the hemispheric radiation variability of the earth and has determined that it, among other things, reflects the heat content of the upper 700 meters of the oceans. Also Fig. 4 confirms this as the smoothed deviations from the trend (bold blue) show a large similarity to the interhemispheric difference of the heat content of the world’s oceans (bold red). This, the paper determined in its Figure 7, has its origin foremost in the Atlantic Meridional Overturning Circulation. There are also many details on this, e.g.: http://www.kaltesonne.de/.
Whoever wishes to get more information about developments in the Atlantic, the following diagram is recommended:
www.climate4you.com/heat content 0-700 m depth (Please copy link and enter in browser)
Here our observations of January 2013 are updated.
Back to our question
What can we expect of our climate in the year 2100 if we follow the IPCC’s line of thought and take into account the new findings out since 2013?
From Fig. 3 we read off a climate sensitivity to forcing of 0.338°C per W/m². From Fig. 4 we get a variability of approx. 0.2 °C over the midterm, coming from the Atlantic and non-predictable time-limited spikes of up to 0.3°C in single years. The rise in Fig. 3 comes from almost exclusively the forcing from CO2. From the literature it can also be derived that other forcings (from other greenhouse gases, such as methane, the sun etc.) will remain as a whole in the range of 1 W/m². The IPCC generated scenarios of the irradiative forcing until 2100, except an unrealistic high projection (RCP 8.5), here assume here a more or less solo role for growth by CO2 increase. We now have everything together for making a projection.
An increase of 2°C by 2100 for pre-industrial levels might contain about 0.15°C, (“heat in the pipeline”) stemming from the reduced heat uptake efficiency of the oceans due to their already happened warming. Attaining the 2°C target requires that the global mean temperature can fluctuate about this 1.9°C – 2.1°C value because of natural variability (see Fig. 4). Therefore we use only 1.75 °C ( 1.9 – 0.15°C) which is expected to result through the further CO2 warming. The forcing then is 1.75/0.34 = 5.15W/m². We should reserve 1 W/m² for the remaining forcings outside of CO2, and thus 4.15 W/m² remains for carbon dioxide. This forcing can be calculated back to the CO2 concentration in the atmosphere: approx. 600 ppm would be the limit value allowed in order to reach the 2°C target. That means a doubling of the CO2 share compared to 1900. From today on there remains another 200 ppm over the next 84 years, which means 2.4 ppm/year growth. Over the last 85 years the CO2 content rose approximately 93 ppm. The current mean rise since 2000 is very close to 2 ppm (see www.esrl.noaa.gov/png).
In any case in the second half of the century we have to succeed in slowly bringing the annual CO2 growth rate back to zero by 2100 in order to meet the 2°C target. That is achievable with little trouble. The only requirement is that the 600 ppm level in 2100 should not be exceeded. Also a growth in the forcing by other greenhouse gases over the 1W/m² limit would be counterproductive. This result was also reached in another paper by a team led by Yoichi Kaya of the Research Institute for Innovative Technology of the Earth in Kyoto: http:springer.com/page-1. The summary of the paper states:
This implies that 2°C target would still be a feasible target.”
Just as the mainstream climate science does, in our derivation we set the prerequisite that the climate system behaves linearly, i.e. that temperature changes respond proportionally to the changes in the forcings. This is unlikely. We reported recently on a paper that described the mechanism for “regulating” temperatures (foremost in the tropics and subtropics). It is also in no way sure that the forcing data of the 2013 AR5 will be valid in a few years time. However, we should and must begin grappling with the big questions somewhere.
Summary
We can summarize: Also with a CO2 increase of the current magnitude over the next 30 years, and accompanied by a gradual decrease in the CO2 growth rate, the 2°C target will still be met – even applying the hypotheses of the IPCC. Continued future technological progress up to 2100 will certainly meet the challenges we face concerning energy shortages, keeping the atmosphere below 600 ppm CO2 content – and thereby preventing excessive warming (think how 85 years ago around 1930 neither computer technology nor modern energy saving machines nor energy production with today’s efficiencies were imaginable) – all this without having to adopt an economic kamikaze program in Paris.


US admin says Global Warming-induced drought caused civil war in Syria.
http://www.breitbart.com/big-government/2015/10/13/susan-rice-blames-climate-change-conflict-syria/
Well, then next California should turn Republican.
Check this out
https://www.youtube.com/watch?v=HUlHdQCntfY
A comparison to solar cycle 12. A good correlation to the UK winter CET.
[…] https://notrickszone.com/2015/10/13/scientists-no-need-for-economic-kamikaze-program-in-paris-2c-warm… […]