Snowfan at wobleibtdieerderwärmung.de features a spotless sun and quite possibly the start of cooling now that the planet is well past the peak of the recent El Niño event. What follows are some excerpts, with some editing to shorten the text to save a little time.
============================
The sun goes on strike: First spotless day this year! The earth is cooling down!
By Schneefan
The sun is on strike as for the first time since 17 July 2014 it showed an absence of sunspots. Solar activity is unusually weak.

On June 3, 2016 there were no visible sunspots. Source: sohowww.nascom.nasa.gov/html.
Already at the end of May 2015 and at the end of March 2016 only a little solar activity was observed. Low solar activity leads to a global and regional cooling. That was known already in the 18th century, as some people got rich in the wheat business.
The current solar cycle (SC) 24 is the weakest in over 100 years.
And since using the new counting method July 1, 2015 (sunspot relative number) SC 24 may be the weakest in almost 200 years: Solar activity since 1700 – meteo.plus:
The following diagram shows the relative numbers for the time period 1820 until the present (source: SIDC), which are calculated using the sunspot numbers. The light green color depicts the daily value. The dark color shows the monthly and yearly average. For the long-term trend, a red line with the 5.5-year (i.e. half a cycle) average has been added, as well as a blue line showing the 30-year average.
Solar cycle 24 has been weak in comparison to the cycles of the past 200 years. The highest daily value so far for the current cycle has been only 135 sunspots. No cycle has been this weak since SC 7 (starting in the year 1823). The monthly average values are currently very low. Source: Solar Activity since 1700 – meteo.plus.
Notice:
On July 1, 2015, the relative numbers were replaced by a homogenized version. The new relative numbers are now immediately available. Comparison between the old and the new version shows the differences. More info at SIDC/SILSO.”

The mean international sunspot relative number (SN Ri) of the last 13 years starting in June 2003 up through May 2016 is SN 39 – considerably below the critical value of SN 50. http://sidc.oma.be/silso/datafiles.
This may have implications as some experts believe the threshold is met for cooling. The Berliner Wetterkarte here writes:
Mean sunspot numbers for each cycle of more than (approx.) 50 over a longer time period are associated with above-normal temperatures. If the mean sunspot number for each cycle is below 50, then below normal temperatures result, i.e. a cold period!…”
The time lag for a weak sun’s impact on climate, depending on the thermal inertia of the oceans – and depending on the study – is between 8 and 20 years: Time lag earth’s climate vs. sun = 14 + – 6 years.
From June 1997 to January 2016 global temperatures made a pause. Using the unfalsified satellite temperatures from RSS:

“Figure 1. The least-squares linear-regression trend on the RSS satellite monthly global mean surface temperature anomaly dataset shows no global warming for 18 years 8 months since May 1997, though one-third of all anthropogenic forcings have occurred during the period of the Pause.“ Source: The Pause hangs on by its fingernails
The powerful El Niño event of late 2015 has temporarily ended the warming pause:
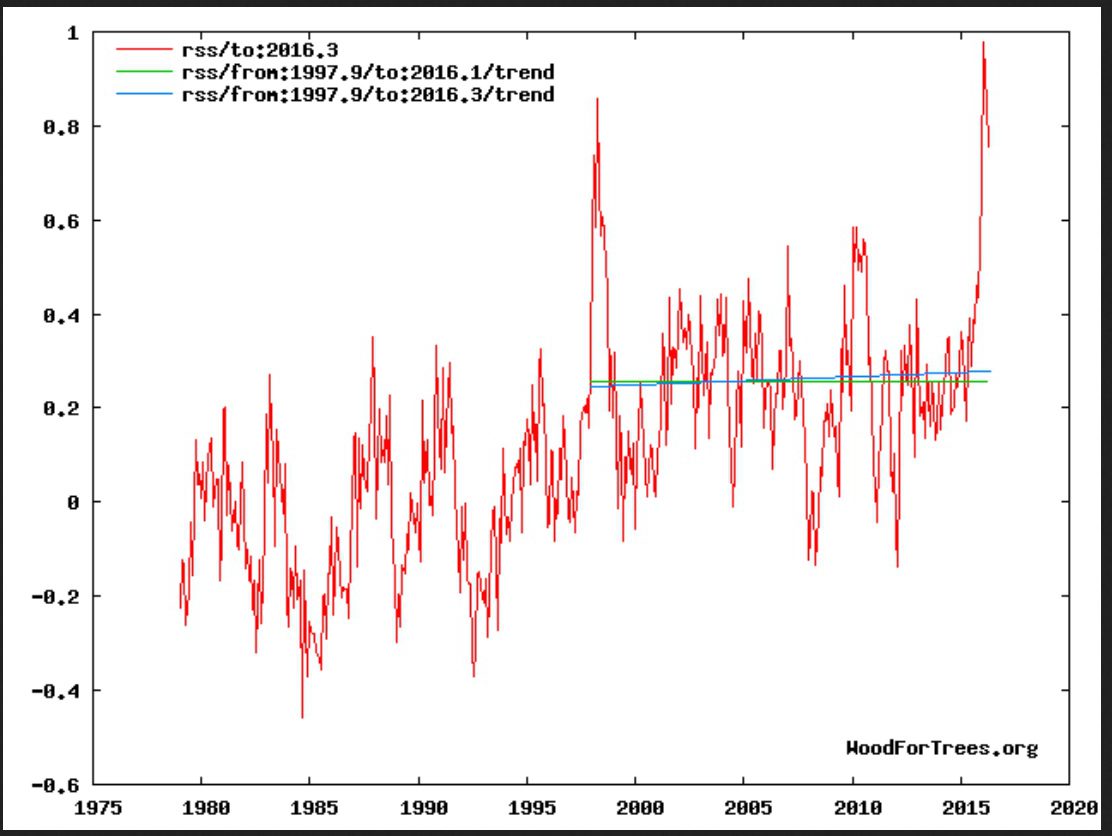
RSS lower troposphere temperature data since 1978 shows statistically insignificant temperature rise since 1998. Source: www.woodfortrees.org/trend
Using UAH satellite data, since March the temperature has been falling as the warming effects of the recent El Niño fade:

Source: UAH Global Temperature Update for May, 2016: +0.55 deg. C
NCEP data also show that cooling continues in June 2016, as the following chart depicts:
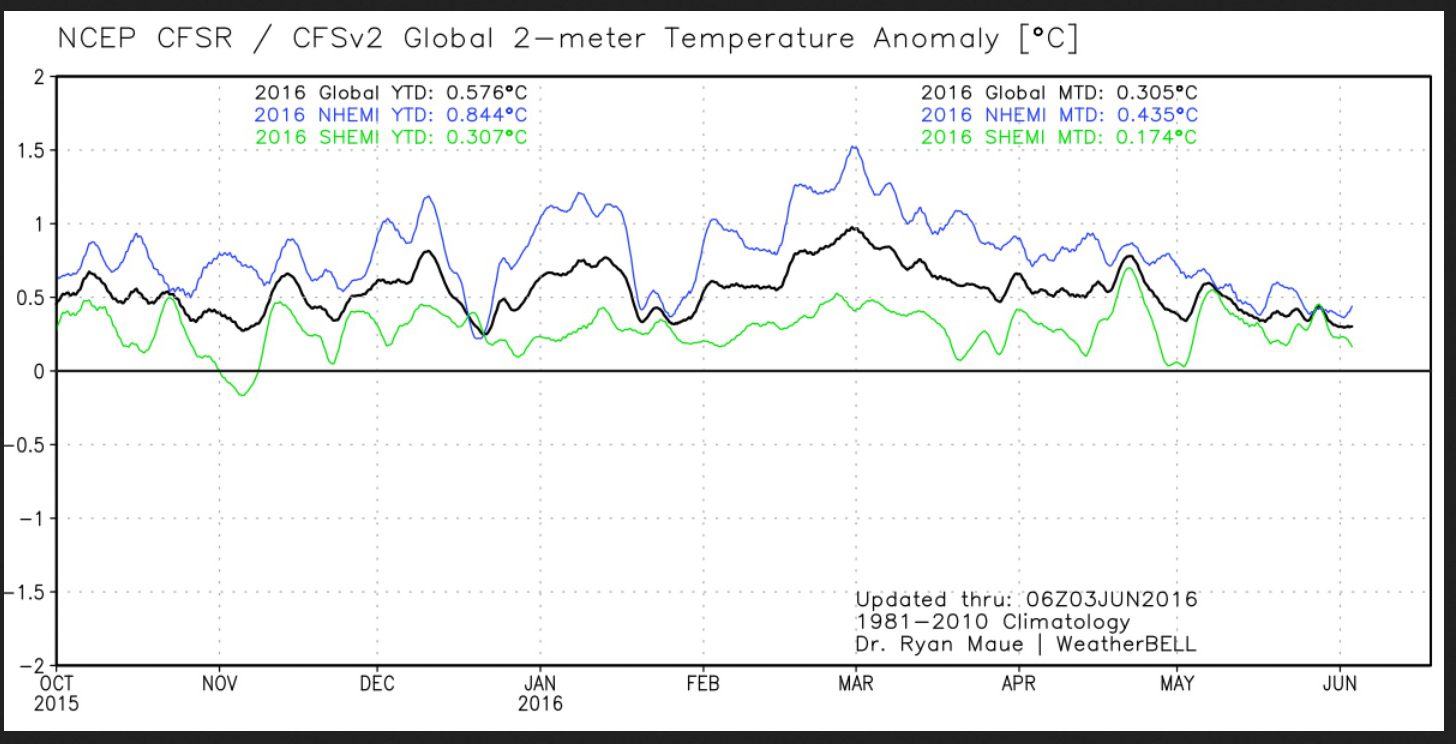
Source: weatherbell.com/temperature.php
Since the El Niño has faded, the oncoming projected cooling La Niña is expected to arrive over the coming months: El Niño is dead, La Niña lives! – ENSO update May 2016.
Thus it may be only a question of months before the global warming pause resumes and the Earth cools with the weak sun.
Moreover the Svensmark Mechanism between weak solar activity and thus stronger cosmic rays can result in up to 100 times more powerful cloud formation in the troposphere. This has recently been confirmed by the research results at CERN.


RSS out for May.. down 0.232 to +0.525.
“Low Solar Activity And Oncoming La Niña: “Only A Question Of Months Before Pause Resumes”?”
Somebody has to do some statistics, if we want to check weird claims like this one.
You folks do understand that even IF we will get a (longish) below zero trend again, that high blip at its end will totally fuck up any correlation value, reducing the meaning of such a trend to below zero as well?!?
Start sampling randomly from a population with mean age of forty. Quite soon it may happen that you have someone of one hundred. Because people of one hundred exist, they must show-up in random samples. Whereas you may think that the sample mean became fucked-up for ever, statistical ‘folks’ can tell that the mean still will converge to forty. Suppose now that you do not know the population mean. It may be forty or eighty. Would a subject of one hundred be sufficient to decide for the latter? There exist decision procedures more rational than your proposal how to deal with a regression slope.
“There exist decision procedures more rational than your proposal how to deal with a regression slope.”
I am curious. What “procedure” do you consider to be better than a test for correlation?
It is common practice to remove transient outliers.
Gees they do it with CO2 level measurements, you know. 😉
Think of the current temperature trend as a baroque harpsichord concerto..
The El Nino was someone in the audience dropping a cup drowning out the music for a very short period.
But the underlying music level has not changed.
This is what is important, the underlying trend..
… and there is absolutely ZERO CO2 signature in the underlying trend…
ALL the slight warming in the satellite record has come from El Nino events, and oceans cycles.
sod 4. June 2016 at 9:52 PM | Permalink | Reply
“You folks do understand that even IF we will get a (longish) below zero trend again, that high blip at its end will totally fuck up any correlation value, reducing the meaning of such a trend to below zero as well?!?”
You’re welcome. I am sure you must have noticed that annual temperature range in Germany spans about 80 centigrades max, 60 centigrades during a normal year, and that therefore your “trend” of “Global Average Temperature” which is supposed to creep upwards with 0.05 centigrade a year is MEANINGLESS????
Oh BTW. Even if we only look at the holy AVERAGE GLOBAL TEMPERATURE, you yourself just said
” that high blip at its end will totally fuck up any correlation value, reducing the meaning of such a trend to below zero as well?!?””
…meaning that there should be no more yammering from warmunists about said warming trend of +0.02 centigrades a year…
…because the El Nino spike wrecked the correlation for you as well…
(But, we won’t hear that. Warmunists use their pretend-smarts very selectively…)
Poor sod. Everything, and I mean EVERYTHING, he “knows” about why the climate behaves as it does is wrong.
https://www.youtube.com/watch?v=EPB3v86epTw
EVERYTHING
https://www.youtube.com/watch?v=gMdYmAo08O4
The El Nino event was so transient that it will likely have very little effect on the statistics, especially if the measured temperatures drop down below the zero trend value of the previous 16 or so years.
“You folks do understand that even IF we will get a (longish) below zero trend again, that high blip at its end will totally f–) up any correlation value, reducing the meaning of such a trend to below zero as well?!?”
Wait. What?
[Global Warming] is already here, says massive government report
http://www.huffingtonpost.com.au/entry/national-climate-assessment_n_5270541.html?section=australia
Is there a link to the UN-IPCC climate model that predicted the date of the “high blip at its end”, or did you make that bit up?
Don’t question them. They are scientists. They know what they are doing.
[…] 2) Blog Speculation: ‘Only A Question Of Months Before Warming Pause Resumes?’ No Tricks Zone, 4 June 2016 […]
i see it this way (what warmists ignore):
the el nino’s are both compareable in strength (using the Nino 3.4 index)
the 2016 el nino was also just a tad stronger in that index then the 1998 el nino.
both transient peaks on the sattelite record show an increase of around 0.1-0.12°C
conclusion:
as both el nino’s are compareable, this one even a tad stronger, from 1998 till 2016 or in almost 20 years, the warming was around 0.1-0.12°C which means 0.05-0.06 degress per decade.
imvho far from the IPCC doom and gloom