What’s wrong here? August in Germany is not getting warmer
By Josef Kowatsch and Sebastian Lüning
(Translated/edited by P Gosselin)
According to the German DWD national weather service August 2016 recorded a mean temperature of 17.7°C. The start of the month was really cool, but the last part of the month the temperature climbed to peak summer levels, and thus compensated for the otherwise sub-par summer. No record temperature was set, with the month’s high some degrees below the record of over 40°C set for a few minutes in 2015.
Using the station network operated by the DWD, which covers all of Germany, and looking over the long term (Figure 1), we can discern four segments since 1931:
1) It was warm during the Nazi times.
2) After the war, mean temperatures dropped, and cool Augusts persisted until 1975.
3) Beginning in 1975 a rapid rise took place until a new temperature high was reached.
4) Since the peak in 2003, the temperatures for the month of August have dropped again. In total the current temperature level is higher than in 1931.

Figure 1: Temperature in Germany for August since 1931. Chart: Kowatsch. Data source: DWD.
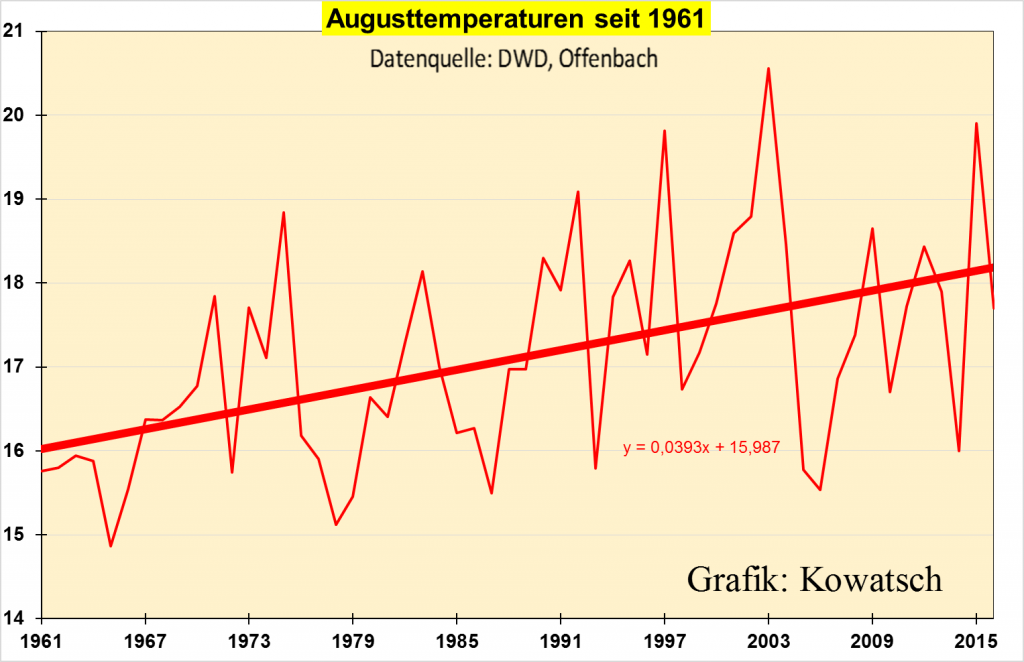
To make the trend look more dramatic than it really is, some reporters are using a trick: They like to start the trend at the bottom of a cold period. Many start their chart at 1961 (Figure 2). Clearly this is near the bottom of the 1960s cold period and thus it makes August mean temperatures look as if they are rising rapidly.
August has gotten much warmer over the past 55 years. According to the linear trend line, the mean temperature was near 16°C in 1961, while today we are close to 18°C.

Figure 2: Temperature in Germany for August since 1961. Chart: Kowatsch. Data from DWD.
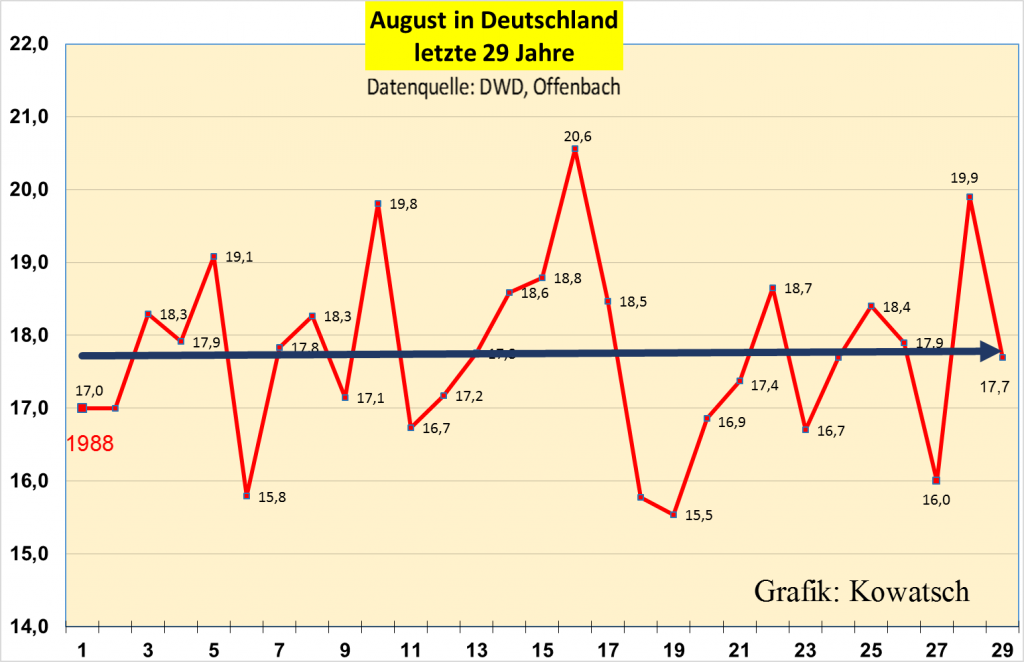
However, Germany’s mean August temperature has stagnated over the past 29 years at a level of 1988. A temperature plateau has been established (Figure 3).

Figure 3: Temperature in Germany for August since 1988. Chart: Kowatsch. Data from DWD.
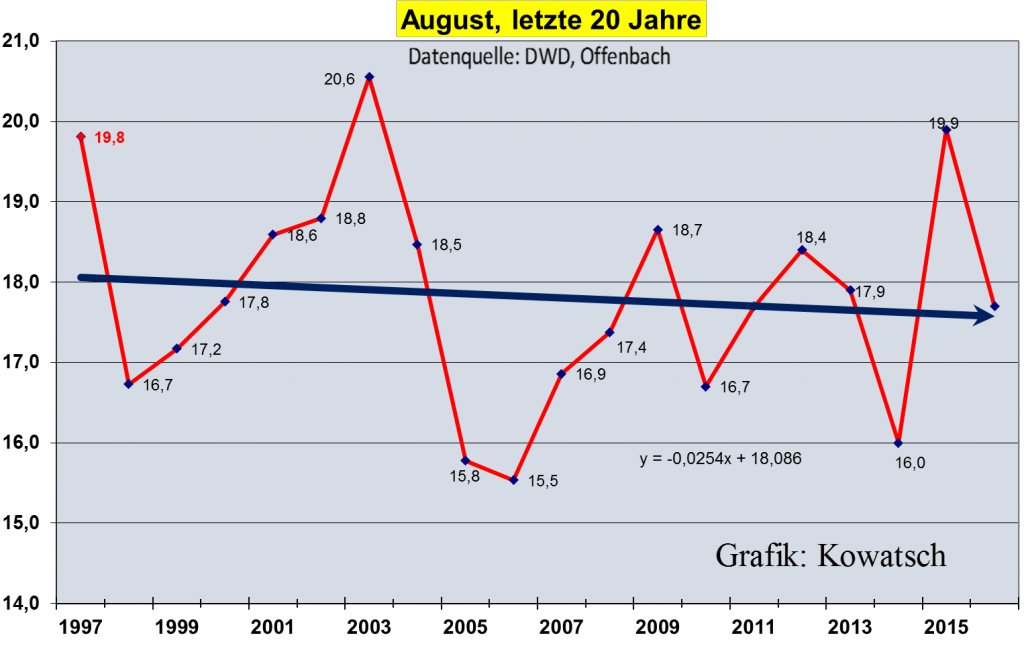
What’s interesting is a look at the last 20 years (Figure 4). The summer month of August has shown a distinct cooling trend over the past 2 decades.

Figure 4: Temperature in Germany for August since 1997. Chart: Kowatsch. Data from DWD.
Thus it’s worth keeping these facts in mind whenever the German media blare out headlines of extreme summer heat. Here it pays to maintain a cool head in order to distinguish between emotions and reality.


Hilarious curve in that first graph.
(Stupid people don’t know how to use Excel.)
Some day, someone will tell a warmunist climate scientist about the Fourier transform. And who knows what will happen then.
Come on Dirk, be fair…
…DA has only just learnt how to use a straight edge.. !
Reminds me of when I finally got Roy Spencer to stop using his “entertaining” 3rd-order polynomial:
http://davidappell.blogspot.com/2012/04/roy-spencers-entertaining-polynomial.html
Yeah, far better to stick to first order, instead of trying to understand what is actually happening…
ie not much apart from El Ninos and ocean oscillations.
Right, rotten appell 😉
“To make the trend look more dramatic than it really is, some reporters are using a trick: They like to start the trend at the bottom of a cold period. Many start their chart at 1961 (Figure 2). Clearly this is near the bottom of the ”
WHAT?
Everyone can simply look at the full data and he will see, that the only ones who are constantly manipulating reality by absurd choices of starting years are the “sceptics”!
http://www.dwd.de/DE/leistungen/zeitreihenundtrends/zeitreihenundtrends.html?nn=495662
Starting a look at climate in the 60s simply makes sense, because that is, when CO2 started to increase massively.
https://curryja.files.wordpress.com/2013/05/f1.jpg
A real cherrypick is the last graph, choosing the last 20 years to show a decrease. This is anti-science!
I just love your humour. In any case that would be the late 40s. http://www.earth-policy.org/indicators/C52/carbon_emissions_2004
We’ll start in 1996 when it was also increasing massively and see what we get.
1945, Quincy Agreement, Bitter Lakes
https://en.wikipedia.org/wiki/Quincy_Agreement#The_Quincy_Agreement
You are missing the point. And that is that the temperature is currently dropping and has been for many years. AGW does not predict that and cannot explain that, whereas those who tell us the sun causes these cycles can. Your denial of reality wont change it.
CAGW Proponent, Synonym = Cherry Picker
According to Scientists Canada Was Once Covered With Ice,
There were no people on earth so who caused the ice to melt?
Climate changes were always happening long before Jesus Christ was born and before and will continue.
Implementing a carbon tax is just another tax grab by Governments.
Some Scientists say the world axis is tilting and other Scientists are saying the sun heat waves are changing and I believe these Scientists to be correct.
I think people have very little to do with climate changes because these climate changes have been taking place for millions and millions of years prior.
“According to Scientists Canada Was Once Covered With Ice,
There were no people on earth so who caused the ice to melt?”
We are all aware of other factors affecting climate.
You do ignore one important factor, which became very relevant lately.
your “argument” has a serious logical problem:
Because A happenend in the past when B was not happening, B can not explain A today.
That is simply utterly false.
You have just committed a heresy: you have admitted that non-CO2 influences dominate.
“‘Because A happened in the past when B was not happening, B can not explain A today’.
That is simply utterly false.” – sod
————————————–
Let’s take a closer look.
http://www.biocab.org/Carbon_Dioxide_Geological.jpg
ALL of the below have occurred in the past:
1. – A happened in the absence of B
2. – B happened in the absence of A
3. – A happened in the presence of B
4. – A didn’t happen in the absence of B
There has been NO correlation in large scale variations in Temp and CO2 over vast expanses of time.
It is not just scenario 1, but the combination of scenarios 1 and 2 that prove it is sod who is “utterly wrong.”
If they want to show how Temps and CO2 are now dependent, it is incumbent on them to show how in the past they went up and down independently. Failing that, they have no theory, and their assertions are based on faith, not fact.
“ALL of the below have occurred in the past:
1. – A happened in the absence of B
2. – B happened in the absence of A
3. – A happened in the presence of B
4. – A didn’t happen in the absence of B
There has been NO correlation in large scale variations in Temp and CO2 over vast expanses of time.”
Yes. In the Precambrian EVERYTHING was different than today.
https://en.wikipedia.org/wiki/Precambrian
In the real world, things are multicausal and that for your “logic” fails on all accounts.
On the other hand, the original post had an obvious logical error. (my backyard was really wet after i watered it. But that can not be the reason, because it was also wet when i did not use the hose…)
“In the real world, things are multicausal ”
Again; a sin against warmunism. Global Warming is caused by industry and industry is caused by evil white capitalists.
You really gotta work on your attitude. That multicausality just opens the gates of hell for skeptics to drive through tanker trucks full of data.
“In the Precambrian EVERYTHING was different…” – sod
Fine. Cherry pick out the Precambrian, if you will. Everything I wrote applies to the remainder. Just because you still can’t read a graph isn’t my concern.
CAMBRIAN CO2 WAS HIGH, AND TEMP WAS HIGH
ORDOVICIAN CO2 REMAINED HIGH, BUT TEMP PLUMMETED
SILURIAN TEMP REBOUNDED TO CAMBRIAN LEVELS, WHILE CO2 DROPPED
DEVONIAN CO2 ROSE BACK, WHILE TEMP FELL, THEN BOTH FELL TOGETHER
CO2 REMAINED LOW, TEMP AGAIN MAXED OUT AND REMAINED ELEVATED WHILE CO2 REMAINED LOW THROUGH THE PERMIAN, THEN STARTED TO RISE SLIGHTLY
CRETACEOUS TEMP DROPPED AGAIN, WHILE CO2 ROSE
THEN FROM MID CRETACEOUS TO THE PRESENT BOTH TEMPS AND CO2 SLOWLY FELL UNTIL TODAY
“In the real world, things are multicausal” – sod
Which is why in the warmist fantasy world ONLY CO2 is responsible for temperature rise, despite all the evidence.
Thanks for yet again showing us you haven’t a clue what you are blathering about.
“CAMBRIAN CO2 WAS HIGH, AND TEMP WAS HIGH”
you are talking about aeons. Everything was different during those long periods of time. the axis did change, as did distance to the sun.
try whatever causal relationship that works today and move it to the Precambrian. can you spot the problem?
fewer cats means more mice. Zero cats in the Precambrian. so plenty of mice?
AHH, THE NON-SEQUITUR DEFENSE
The fall-back plan when a little b.s. isn’t working, go full fool and hope for the best?
…kinda like this…
https://www.youtube.com/watch?v=JmzuRXLzqKk
…only he’s a LOT funnier than you.
“…obvious logical error. (my backyard was really wet after i watered it. But that can not be the reason, because it was also wet when i did not use the hose…)” – sod the logic impaired – September 2016 at 9:22 PM
The appropriate analogy for temps unaffected by whopping increases in CO2 would be – “I watered my lawn all day, and it never got wet.”
Sod dismembered again, well done!
P.S.
1. – I’m NOT referring to the Precambrian. I don’t need it. All the rest from the Cambrian until now is quite sufficient.
2. – Data is data, no matter when it was collected. The only reason sod wants to dismiss hundreds of millions of years of data is that it shows what an idiot he is.
He is such a tool.
[…] – See more at: notrickszone.com […]