I keep hearing how the Arctic is warmer than normal, and so it’s a sure sign of “global warming”.
Yet I came across a chart earlier today showing conditions over Siberia, which of course is a vast region. What’s interesting is the extent and sheer depth of the cold that has gripped this area:
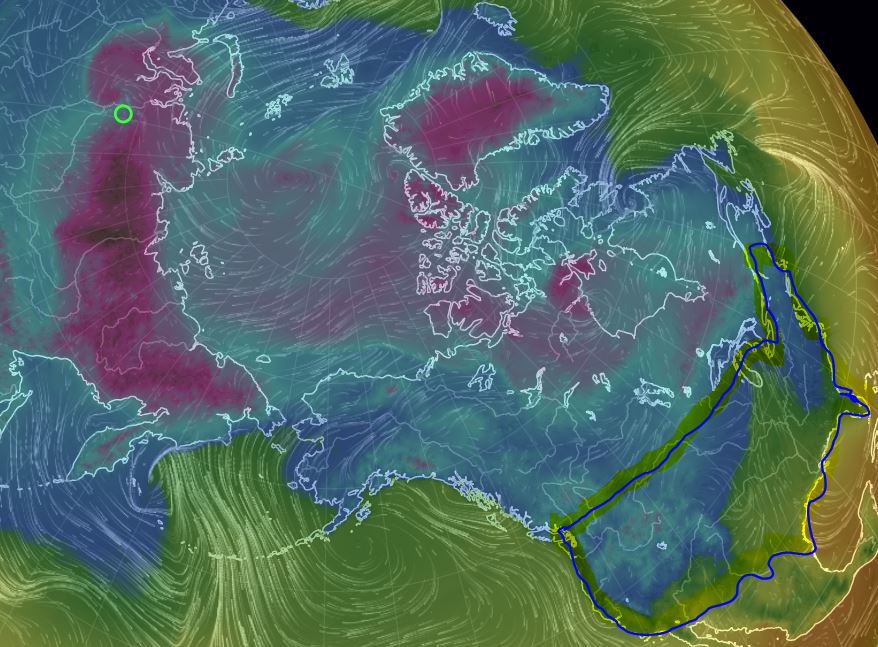
Chart clipped from: https://earth.nullschool.net/#current/wind/surface/level/overlay=temp/orthographic=204.17,41.87,446/loc=138.342,52.952
I roughly outlined the lower 48 states in the above chart (right) and compared it to the size of the dark rose area (-40°F and colder) over Siberia (left). Here we see that this area is at least enough to cover half of the lower US 48 states. When you go over the region with your mouse you find many areas under 60°F below. A couple of locations showed -70°F! Certainly no global warming there.
What does it tell us? Most likely if you combined both the Arctic and Siberia, you’d end up with a mean temperature that is about normal. Indeed the globe is currently just a couple of tenths of a degree C above normal. That’s it. That’s what all the fuss is all about. 95% hysteria.
Some people may not realize it, but the North Pole is in fact a rather small area, and so to claim that it being “really hot” this year is a sign of global warming is just fake science.
The unfortunate thing is that no one lives there, and so no one is able to enjoy the warmer than normal temperatures happening this winter.
What’s unfortunate is that people do live in Siberia, and right now these people aren’t happy about the extra-severe conditions, and would certainly welcome a bit of that “Arctic warming”.


Temperatures in Russia today, 31st December 2016
https://pogoda.mail.ru/country/russia/
Barnaul -6, Novosibirsk -5, Irkutsk -16, Yakutsk -32, Ulan-Ude -20, Chita -21, Kemerovo -6
Come on – this is nothing out of the ordinary. Average temperatures for the time of year.
I love earthnullschool website for a check on the big freeze
This is not a comment to this article, but more like to the Global warming itself. I have seen many diagrams presenting Co2 ammount over time. Interestingly they all show an increase from about 1975… Any good scientist should be looking at many options but, no, it seems, all looks to man made emmisions. So I started looking around. If You look at the ammount of SO2 in the athmosphere, one can observe a drop in content around 1970-75, and a further fall. S02 is known to act as cooling agent to the earth by dimming the sunrays. The idea is: The rays uf the sun were partially blocked to the mid 1970’s by S02, by falling content of S02 the warming sets inn. The oceans can no longer contain the same ammount of CO2, this could then be messured in the athmosphere as an increase of CO” causing the hockeystick.
Thanks for the nice link. If you want to see how sibirian cold looks, you just have to turn the ball over to Siberia. There you will see huge parts at -40°C and below. And big parts with -50°C (dark violet). The USA does not look anything like that.
“Some people may not realize it, but the North Pole is in fact a rather small area, and so to claim that it being “really hot” this year is a sign of global warming is just fake science.”
I disagree. The temperature anomaly around the pole was totally out of the norm for the period that we have real data for.
Just look at the graph:
http://ocean.dmi.dk/arctic/meant80n.uk.php
This was a very special event and we do not know if the January cold wave in europe or the USA will be special at all.
I would love to have some cold and snow, so happy new year to everyone.
And a happy new year to you!
So just how big is the “North Pole,” anyway? The obvious answer is zero. However, the oft-referenced DMI data looks at the area above latitude 80N,
and that is about 4 million km^2. The area of the northern hemisphere is about 250 Mkm^2. Pretty small. The arctic total is 21, the northern tropic is 255 – 154, or about 100.
Google says Siberia is 5 M km^2, the US lower 48 is 8 M km^2.
The interesting thing about the DMI data is that pole area winter has warmed from frigid to still frigid, but easier to dress for whereas (I presume) ice has kept the summer unchanged.
Python assistance:
>>> def a(l):
… rad = l * pi /180
… area = 2 * pi * 6371*6371 * (1 – sin(rad))
… print ‘Area above lat %.1f is %.2f Mkm^2’ % (l, area/1000000)
…
>>> a(80)
Area above lat 80.0 is 3.87 Mkm^2
>>> a(-90)
Area above lat -90.0 is 510.06 Mkm^2
>>> a(0)
Area above lat 0.0 is 255.03 Mkm^2
>>> a(23.44)
Area above lat 23.4 is 153.58 Mkm^2
>>> a(90-23.44)
Area above lat 66.6 is 21.05 Mkm^2
Thanks Ric. So Arctic above 80N is less than half the size of USA.
As I’ve said so often — it’s not that lump of ice floating in the sea at the top of the globe that indicates anything but sea temperature. Certainly it does not indicate ‘climate’ trends as AGW advocates believe.
Not the real indicator will be how long the Siberian and Canadian snows stay. Over 3 year and almost certainly this is a cooling trend, though the AGW consensus crowd will still screech otherwise as the Northern Hemisphere freezes up.
Hope you all have a prosperous New Year — stay warm and burn more coal!
The size of places on Earth are usually distorted by the map projections. The link below is a place to check sizes of a place you know versus another.
The True Size Of
There is a box on the upper left.
Click on “Clear Map”
Type in the name of a country, say Germany. Then, Enter.
Put the cursor on Germany and drag, say to New South Wales.
Zoom with the =/- at the top right. Also drag and center as needed.
In this example it is seen that Germany fits easily in the area of NSW.
Clear Map, to start over.
~~~~~~~~~~~~~~~~~~~~~~~~
The weather models are showing that the western US (northern part) ought to soon get colder.
However, the wind west of the Rocky Mtns. is going northward and is not much anyway. East of the Rockies there are two main paths. One turns north toward Hudson Bay and the second swings eastward and loops into a Low over the Upper Peninsula of Michigan.
Waiting for changes.