Scientists Increasingly Discarding
‘Hockey Stick’ Temperature Graphs
Now Updated: 300 Non-Hockey Stick Graphs
“[W]hen it comes to disentangling natural variability from anthropogenically affected variability the vast majority of the instrumental record may be biased.” — Büntgen et al., 2017
Last year there were at least 60 peer-reviewed papers published in scientific journals demonstrating that Today’s Warming Isn’t Global, Unprecedented, Or Remarkable.
.
Just within the last 5 months, 58 more papers and 80 new graphs have been published that continue to undermine the popularized conception of a slowly cooling Earth temperature history followed by a dramatic hockey-stick-shaped uptick, or an especially unusual global-scale warming during modern times.
.
Yes, some regions of the Earth have been warming in recent decades or at some point in the last 100 years. Some regions have been cooling for decades at a time. And many regions have shown no significant net changes or trends in either direction relative to the last few hundred to thousands of years.
.
Succinctly, then, scientists publishing in peer-reviewed journals have increasingly affirmed that there is nothing historically unprecedented or remarkable about today’s climate when viewed in the context of long-term natural variability.
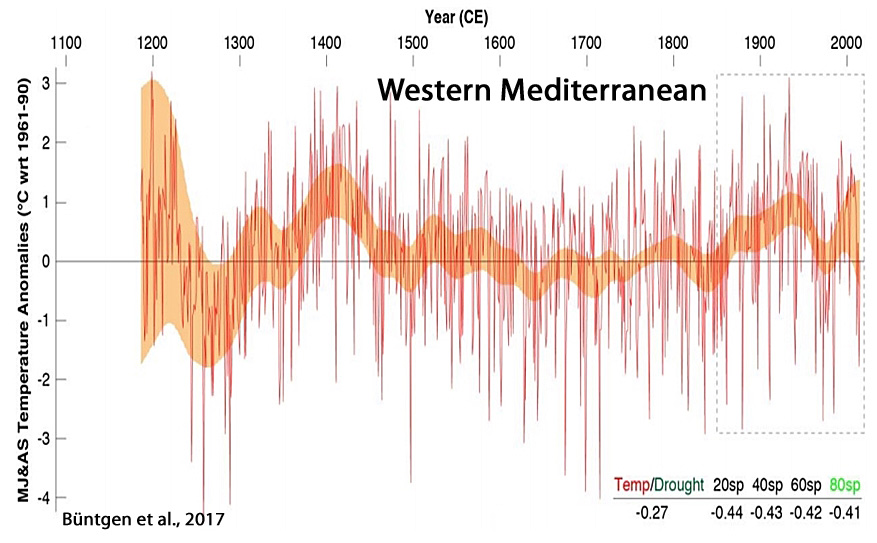
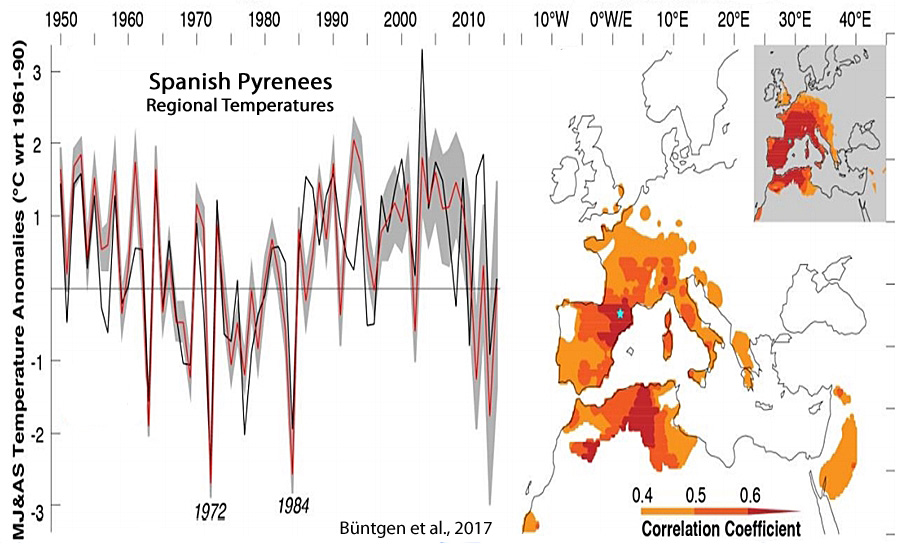
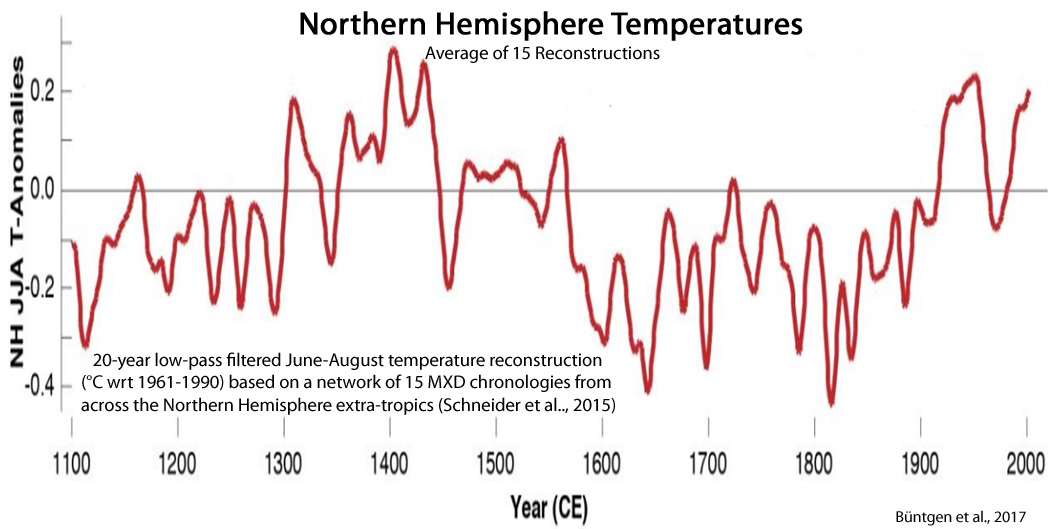
Büntgen et al., 2017
“Spanning the period 1186-2014 CE, the new reconstruction reveals overall warmer conditions around 1200 and 1400, and again after ~1850.
Little agreement is found with climate model simulations that consistently overestimate recent summer warming and underestimate pre-industrial temperature changes. … [W]hen it comes to disentangling natural variability from anthropogenically affected variability the vast majority of the instrumental record may be biased.
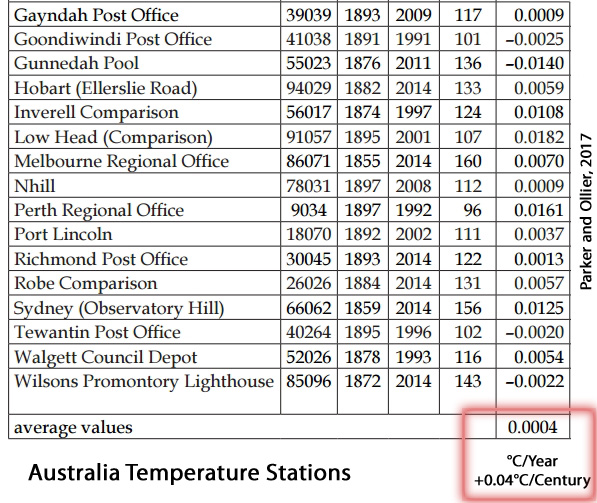
Parker and Ollier, 2017
“The Global Historical Climatology Network (GHCN) v2 temperature time series (GISS Surface Temperature Analysis, 2012) in Alice Spring and all the 36 other stations located in a circle of 1,000 km from Alice Spring do not show any warming. There are stations covering different time windows having very close patterns of temperatures. In this circle of 3,141,593 km2 (roughly 50% of Australia) that is mostly underdeveloped, none of the stations […] has a warming trend. … It is therefore only an artefact by BOM to produce the warming. Homogenization is supposed to be used to account for upwards biases such as Urban Heat Island, not to introduce upwards biases. … In the centre of Australia, all the stations available in a circle of radius 1,000 km were showing very little or no warming, as still acknowledged in the GHCN v2 data set up to October 2011 (Fig. 6). … Table 1 presents the warming trend for the 30 longest temperature records of Australia collected in a single location, with measurements started before 1900 and continued until after 1985. … In the 30 locations, the monthly mean maximum temperature is warming 0.0004°C/year, or 0.04°C/century. That means there is no change within the limits of accuracy of the measurements. … The climate trend maps compiled by Bureau of Meteorology in their climate change section are completely unreliable, as the alleged increasing temperature is obtained by lowering temperatures of the past by “adjustments”. The longest of the Australian temperature records that were considered the most reliable by Bureau of Meteorology on February 2009 (BOM 2009) are still available as raw temperatures in the climate data online section and consistently show no warming and no increased extreme events within the limit of accuracy of measurements.”


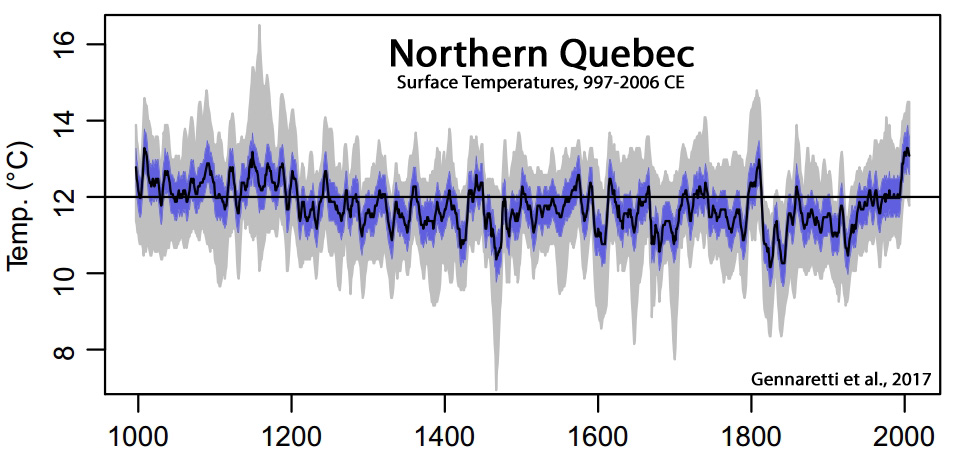
Gennaretti et al., 2017
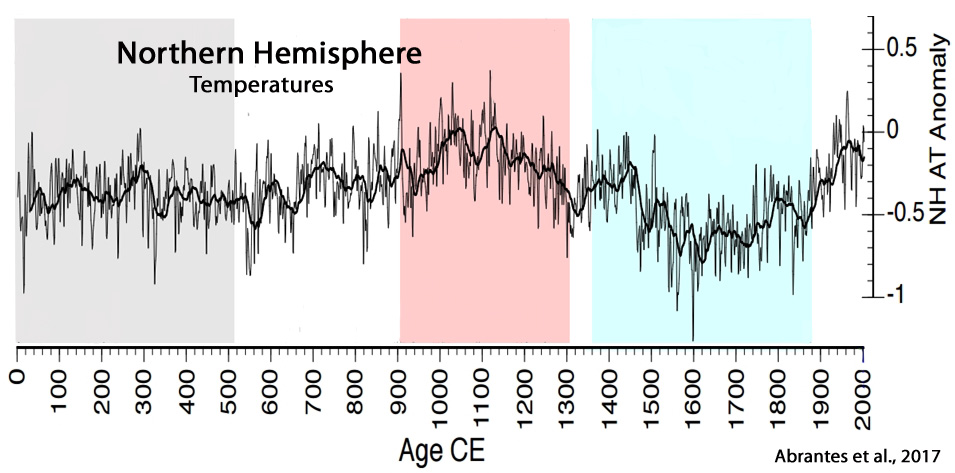
Abrantes et al., 2017
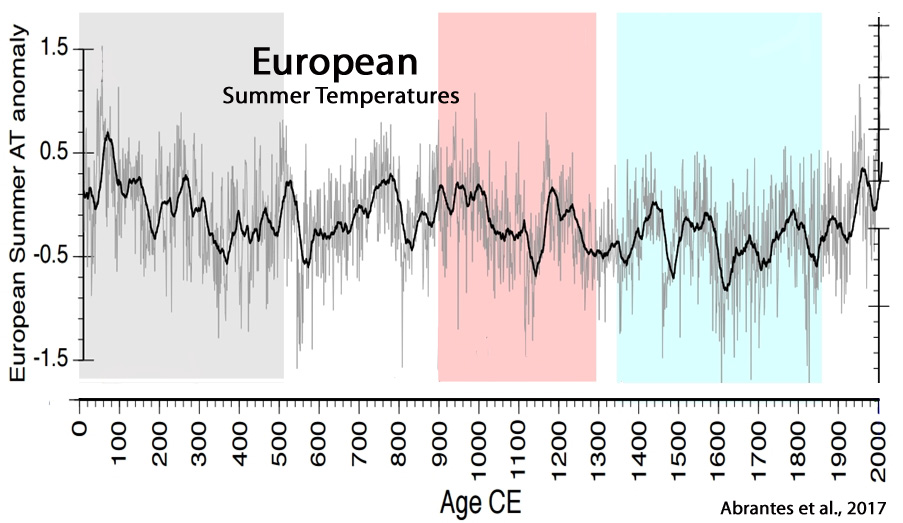
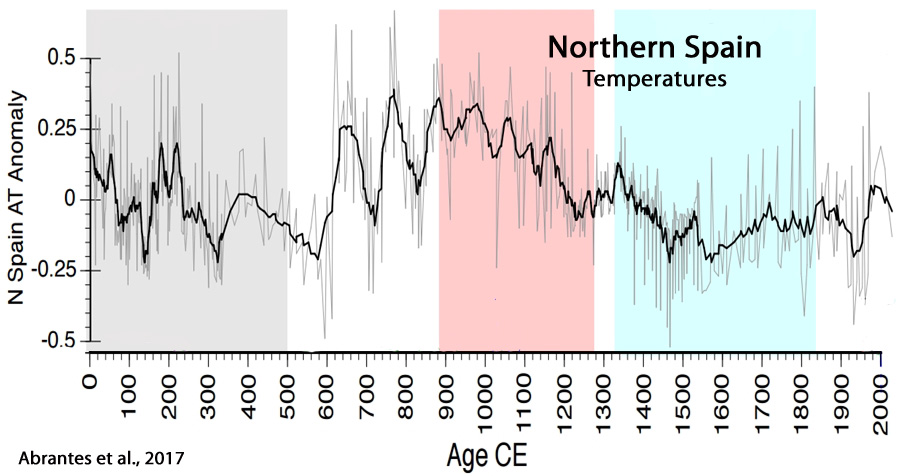
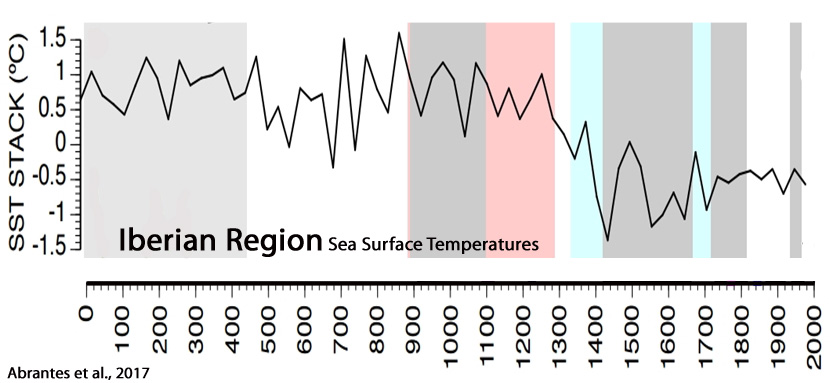
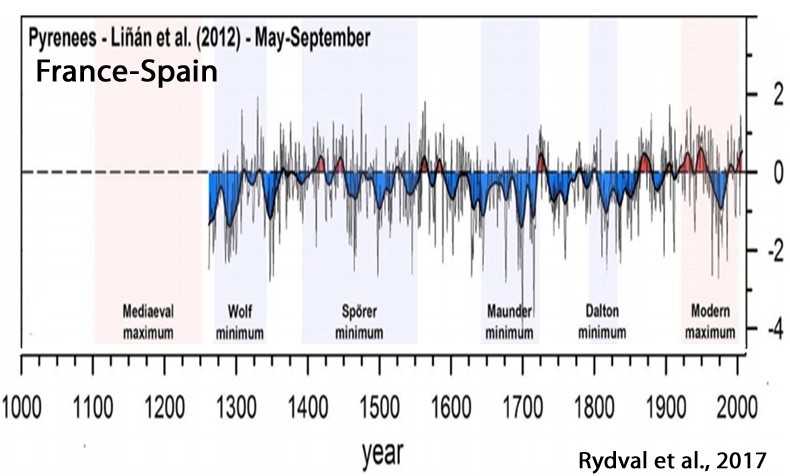
“The transition from warm to colder climatic conditions occurs around 1300 CE associated with the Wolf solar minimum. The coldest SSTs are detected between 1350 and 1850 CE, on Iberia during the well-known Little Ice Age (LIA) (Bradley and Jones, 1993), with the most intense cooling episodes related with other solar minima events, and major volcanic forcing and separated by intervals of relative warmth (e.g. (Crowley and Unterman, 2013; Solanki et al., 2004; Steinhilber et al., 2012; Turner et al., 2016; Usoskin et al., 2011). During the 20th century, the southern records show unusually large decadal scale SST oscillations in the context of the last 2 millennia, in particular after the mid 1970’s, within the Great Solar Maximum (1940 – 2000 (Usoskin et al., 2011)) and the “greater salinity anomaly” event in the northern Atlantic (Dickson et al., 1988), or yet the higher global temperatures of the last 1.4 ky detected by (Ahmed et al., 2013).”
Werner et al., 2017

Deng et al., 2017
“The results indicate that the climate of the Medieval Climate Anomaly (MCA, AD 900–1300) was similar to that of the Current Warm Period (CWP, AD 1850–present) … As for the Little Ice Age (LIA, AD 1550–1850), the results from this study, together with previous data from the Makassar Strait, indicate a cold and wet period compared with the CWP and the MCA in the western Pacific. The cold LIA period agrees with the timing of the Maunder sunspot minimum and is therefore associated with low solar activity.”

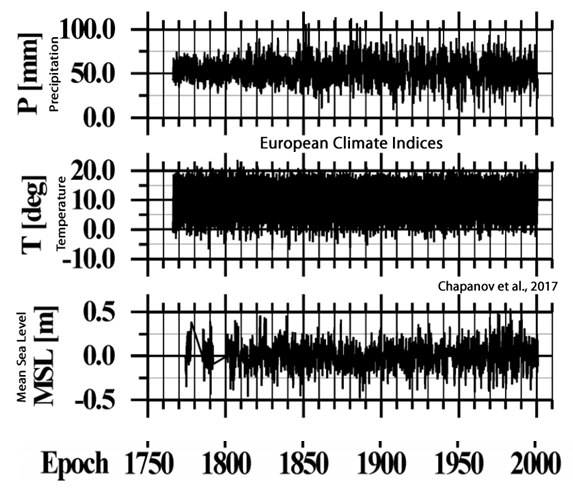
Chapanov et al., 2017
“A good agreement exists between the decadal cycles of LOD [length of day], MSL [mean sea level], climate and solar indices whose periods are between 12-13, 14-16, 16-18 and 28-33 years.”
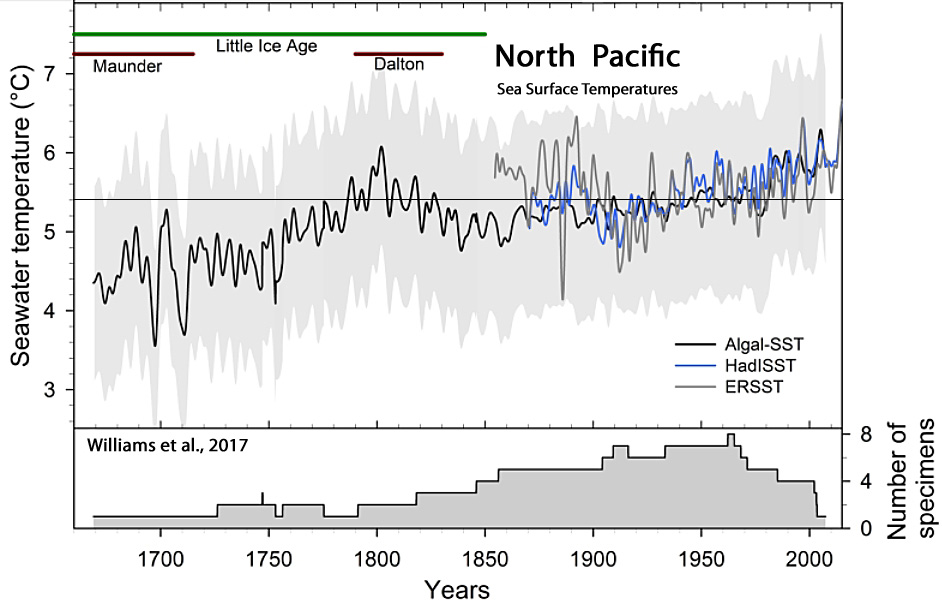
Williams et al., 2017
“Reconstructed SSTs significantly warmed 1.1°C … from 1660s to 1800 (rate of change: 0.008°C/year), followed by a significant cooling of 0.8°C … until 1840 (rate of change: 0.02°C/year), then a significant warming of 0.8°C from 1860 until the end of reconstruction in 2007 (rate of change: 0.005°C/year).” [The amplitude of sea surface temperature warming and cooling was higher and more rapid from the 1660s to 1800 than from 1860-2007.]
‘In fact, the SST reconstruction significantly co-varied with a reconstruction of solar irradiance [Lean, 2000] on the 11-year periodicity only from ~1745 to 1825. In addition, the reconstructed SSTs were cool during the period of lower than usual solar irradiance called the Maunder minimum (1645–1715) but then warmed and cooled during the Dalton minimum (1795–1830), a second period of reduced solar irradiance. … The Dalton solar minimum and increased volcanic activity in the early 1800s could explain the decreasing SSTs from 1800 to 1850.”
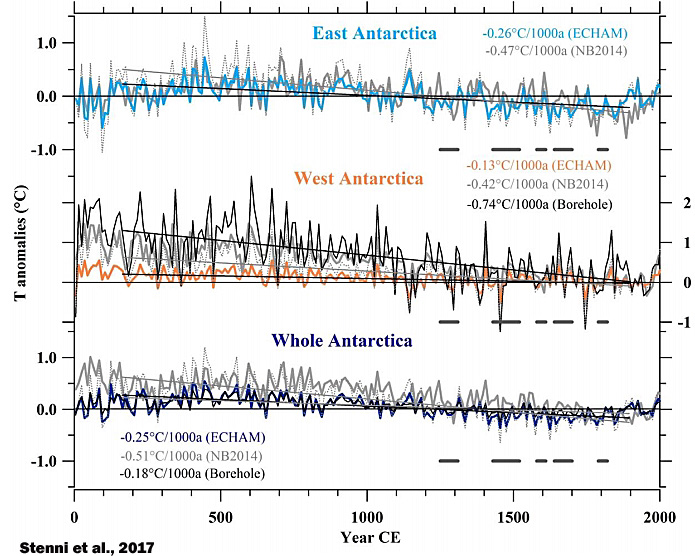
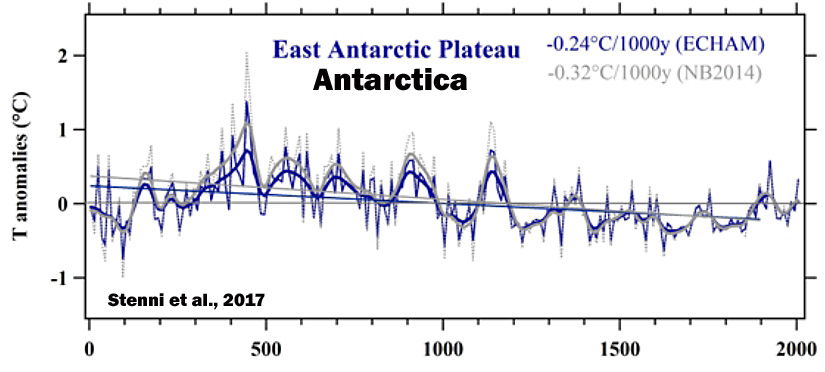
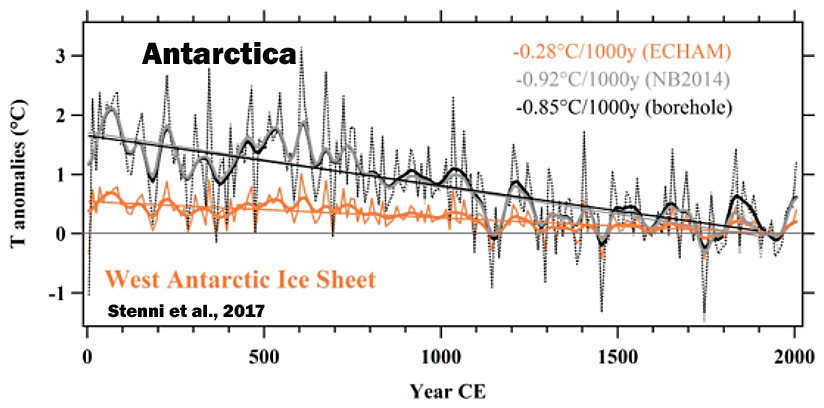
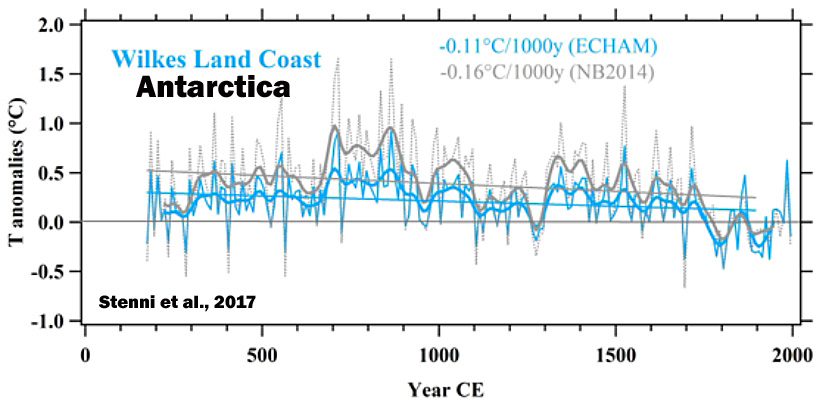
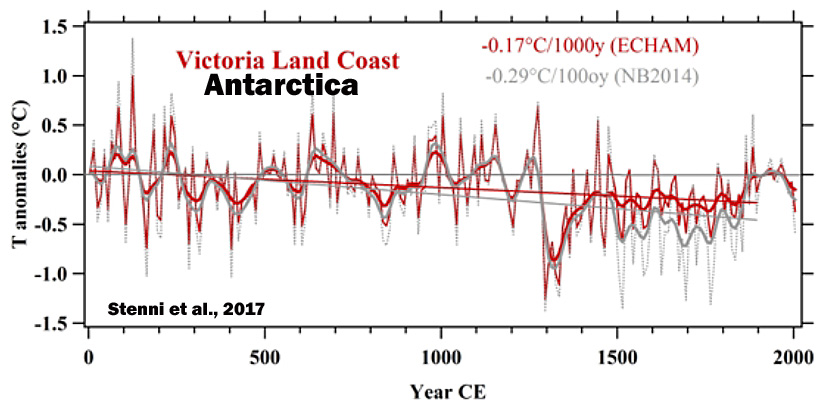
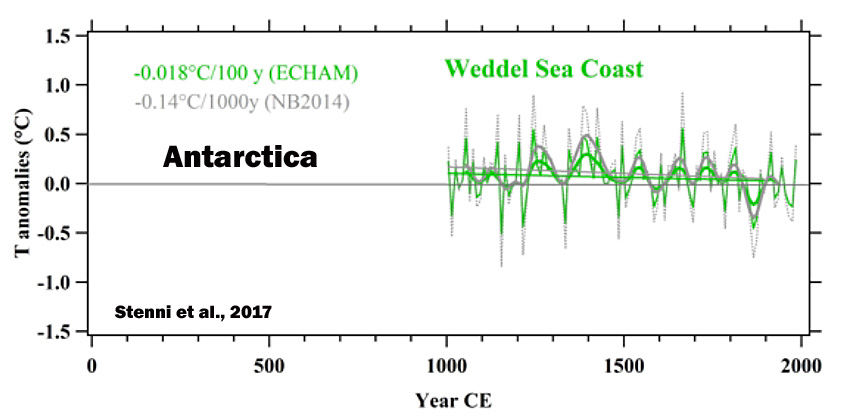
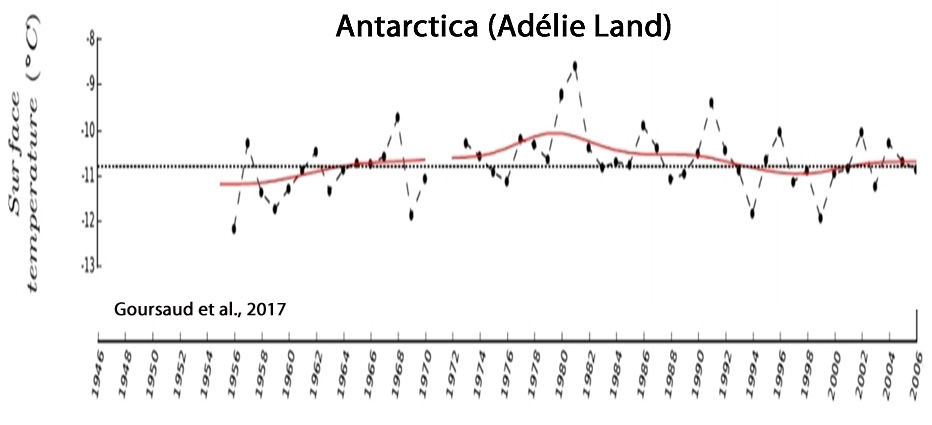
Stenni et al., 2017
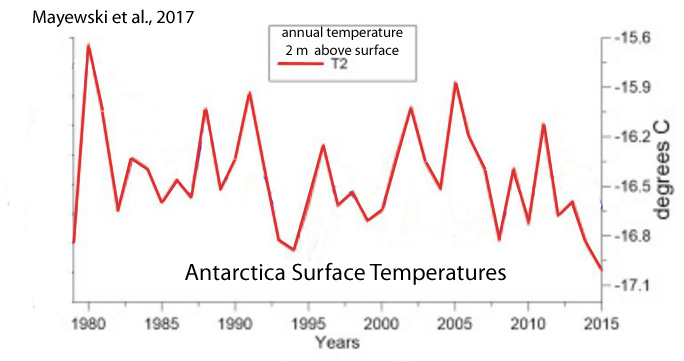
“A recent effort to characterize Antarctic and sub-Antarctic climate variability during the last 200 years also concluded that most of the trends observed since satellite climate monitoring began in 1979 CE cannot yet be distinguished from natural (unforced) climate variability (Jones et al., 2016), and are of the opposite sign [cooling, not warming] to those produced by most forced climate model simulations over the same post-1979 CE interval. … (1) Temperatures over the Antarctic continent show an overall cooling trend during the period from 0 to 1900CE, which appears strongest in West Antarctica, and (2) no continent-scale warming of Antarctic temperature is evident in the last century.”
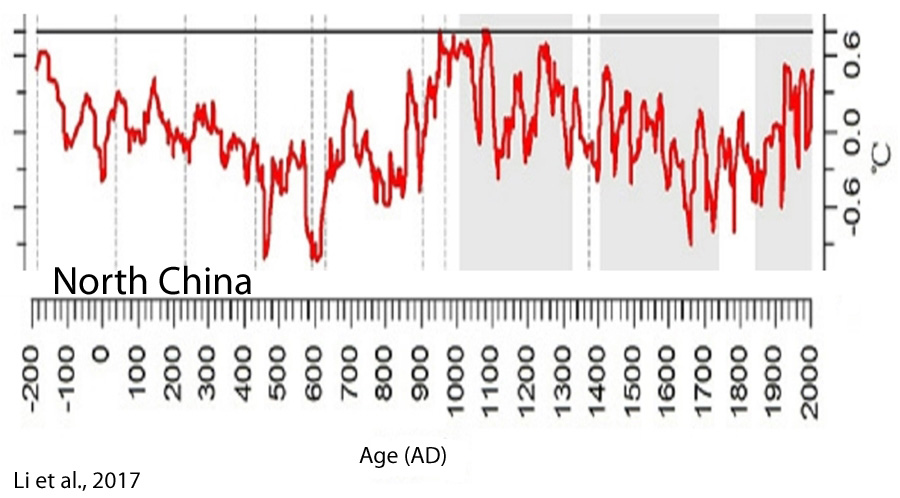
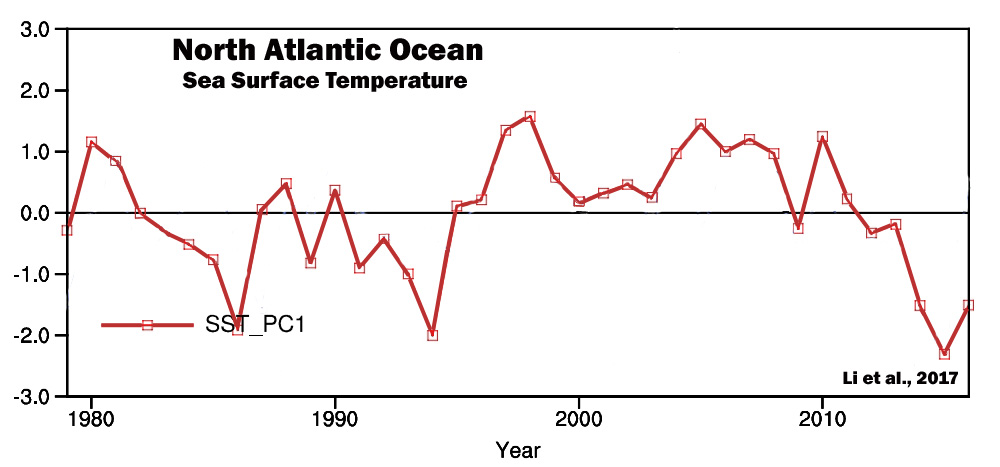
Li et al., 2017
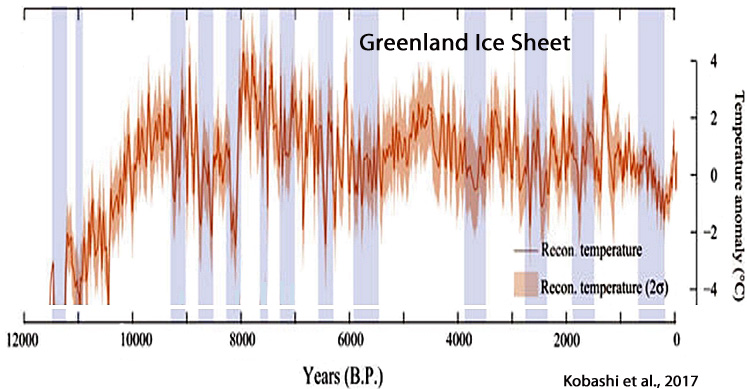
Kobashi et al., 2017
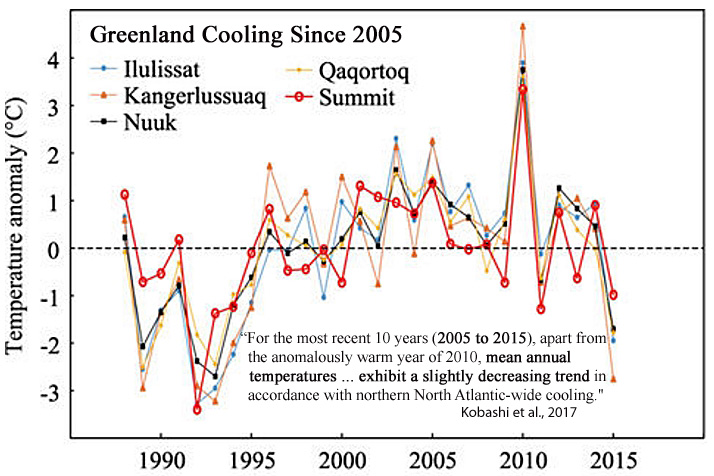
“After the 8.2 ka event, Greenland temperature reached the Holocene thermal maximum with the warmest decades occurring during the Holocene (2.9 ± 1.4 °C warmer than the recent decades) at 7960 ± 30 years B.P. … For the most recent 10 years (2005 to 2015), apart from the anomalously warm year of 2010, mean annual temperatures at the Summit exhibit a slightly decreasing trend in accordance with northern North Atlantic-wide cooling. The Summit temperatures are well correlated with southwest coastal records (Ilulissat, Kangerlussuaq, Nuuk, and Qaqortoq).”
“For the most recent 10 years (2005 to 2015), apart from the anomalously warm year of 2010, mean annual temperatures at the Summit exhibit a slightly decreasing trend in accordance with northern North Atlantic-wide cooling. The Summit temperatures are well correlated with southwest coastal records (Ilulissat, Kangerlussuaq, Nuuk, and Qaqortoq).”
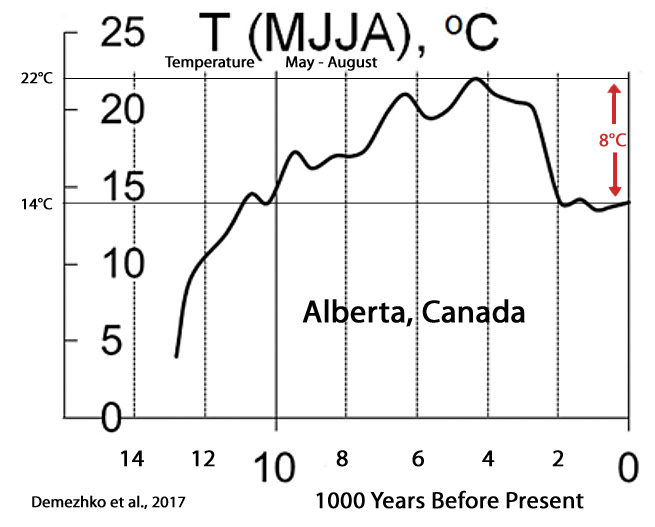
Demezhko et al., 2017
“GST [ground surface temperature] and SHF [surface heat flux] histories differ substantially in shape and chronology. Heat flux changes ahead temperature changes by 500–1000 years.”
Luoto and Nevalainen, 2017

Li et al., 2017
“The main driving forces behind the Holocene climatic changes in the LYR [Lower Yangtze Region, East China] area are likely summer solar insolation associated with tropical or subtropical macro-scale climatic circulations such as the Intertropical Convergence Zone (ITCZ), Western Pacific Subtropical High (WPSH), and El Niño/Southern Oscillation (ENSO).”

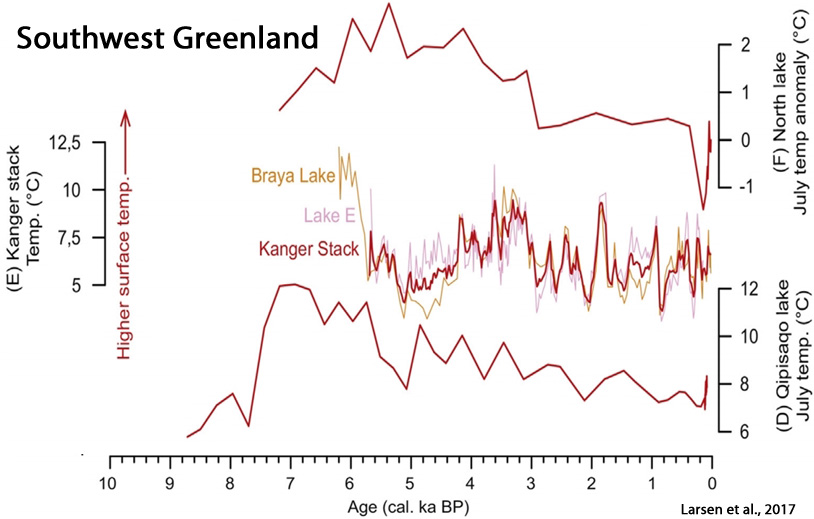
Larsen et al., 2017
“[K]nowledge remains sparse of GICs [glaciers and ice caps] fluctuations in Greenland and whether they survived past warmer conditions than today, e.g. the Holocene Thermal Maximum (HTM) ~8-5 cal. ka BP and the Medieval Climate Anomaly (MCA) ~1200-950 C.E. Only a few available studies have provided continuous records of Holocene glacier fluctuations in east Greenland (Lowell et al., 2013; Levy et al., 2014; Balascio et al., 2015) and west Greenland (Schweinsberg et al., 2017). These records show that local GICs [glaciers and ice caps] were significantly reduced and most likely completely absent during the HTM [Holocene Thermal Maximum].”
Zywiec et al., 2017
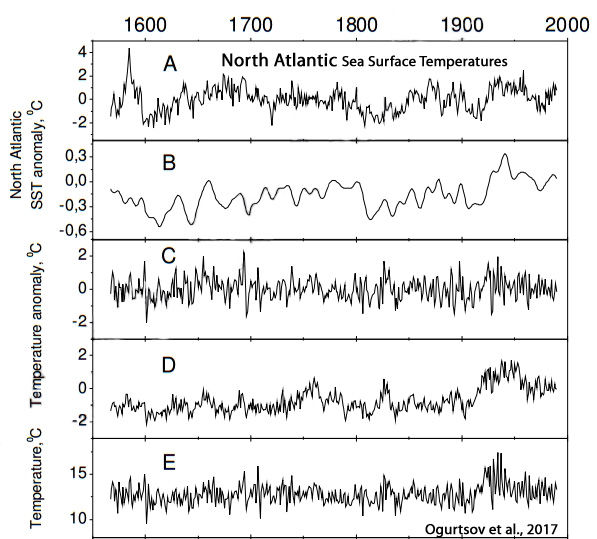
Ogurtsov et al., 2017
“Our analyses reveal appreciable and stable positive correlation between summer temperatures in Northern Fennoscandia and sea surface temperature in North Atlantic over AD 1567–1986. Thus a connection between climates of Northern Fennoscandia and North Atlantic basin is established for more than the last four centuries. Significant correlation was found between SST [sea surface temperatures] in NA [the North Atlantic] and solar activity (both instrumental data and proxies) during AD 1716–1986. … Thus, the connection between Northern Fennoscandian climate and solar activity, which has been previously established at century-scale (Ogurtsov et al., 2001, 2002, 2013) and millennial-scale (Helama et al., 2010), is confirmed for AD 1716–1986 over the entire frequency range using unfiltered records (with the exception for AMO reconstruction after Mann et al. (2009)).”
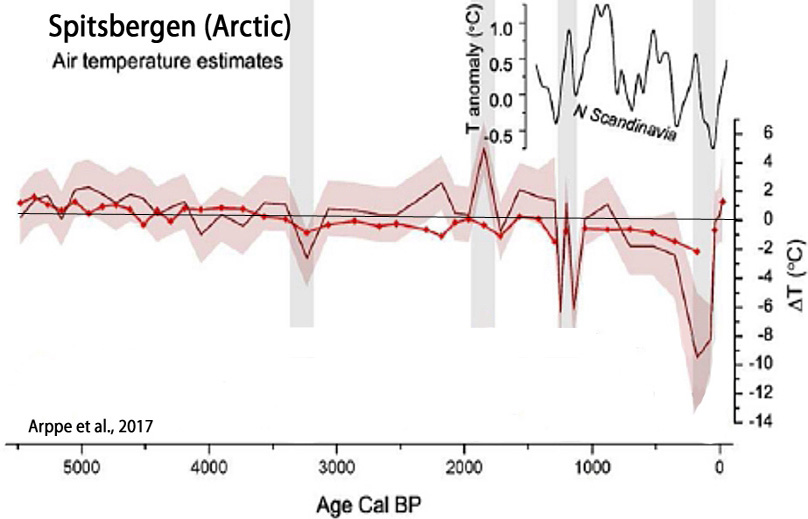
Arppe et al., 2017
“The highest δ18O [temperature proxy] value of the record occurs at ca. 1900–1800 cal. yr BP (~50–150 CE), coinciding with a period of general warmth referred to as the Roman Warm Period (RWP). In the North Atlantic Ocean, the RWP interval (ca. 2500–1500 cal. yr BP) is associated with, for example, increased temperatures and productivity, decreased evidence of ice … Northern Hemisphere terrestrial environments widely display evidence of elevated temperatures between 1 and 300 CE (Ljungqvist, 2010). … southern Spitsbergen experienced a significant late-Holocene cold spell prior to the onset of the LIA [Little Ice Age]. These negative shifts overlap with the latter part of a cooling known as the Dark Ages Cold Period (DACP, ca. 1500–1000 cal. yr BP; Bianchi and McCave, 1999; McDermott et al., 2001). The event is directly preceded by a minimum in total solar irradiation (Renssen et al., 2006; Steinhilber et al., 2009) … A wealth of proxy evidence testifies to the LIA [Little Ice Age] cooling, thought to have been triggered by reduced solar irradiance, extended volcanism, and internal characteristics of the ocean–atmosphere system (Miller et al., 2010, 2012; Wanner et al., 2011). … Factoring in respective age-model uncertainties, it appears that all major negative shifts, that is, ‘cold’ periods, in the δ18Olw record are roughly synchronous with periods of major negative anomalies in total solar irradiation and high modeled probabilities for extremely cold years in the Nordic Seas (Renssen et al., 2006), and widespread evidence of North Atlantic ‘cold spells’ (Bond et al., 2001; Sarnthein et al., 2003; Solomina et al., 2015; Wanner et al., 2008) linked to solar forcing.”
Mayewski et al., 2017
Rydval et al., 2017
“[T]he recent summer-time warming in Scotland is likely not unique when compared to multi-decadal warm periods observed in the 1300s, 1500s, and 1730s“
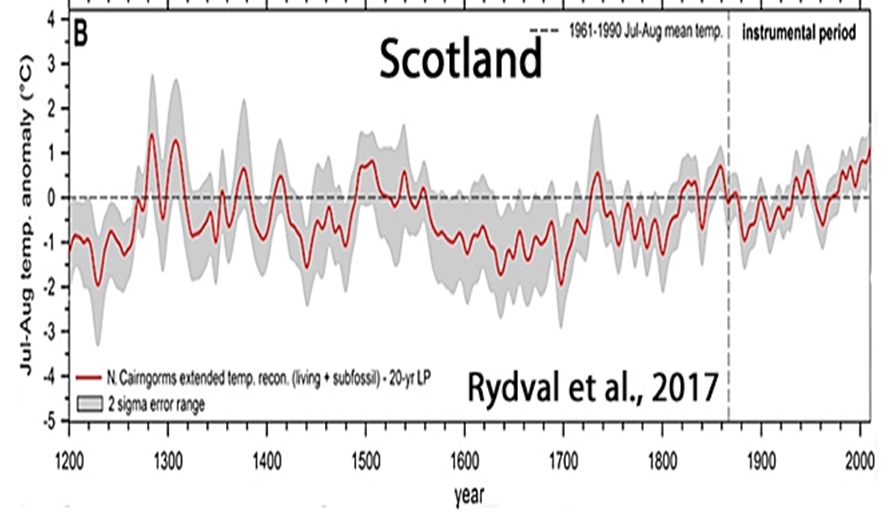
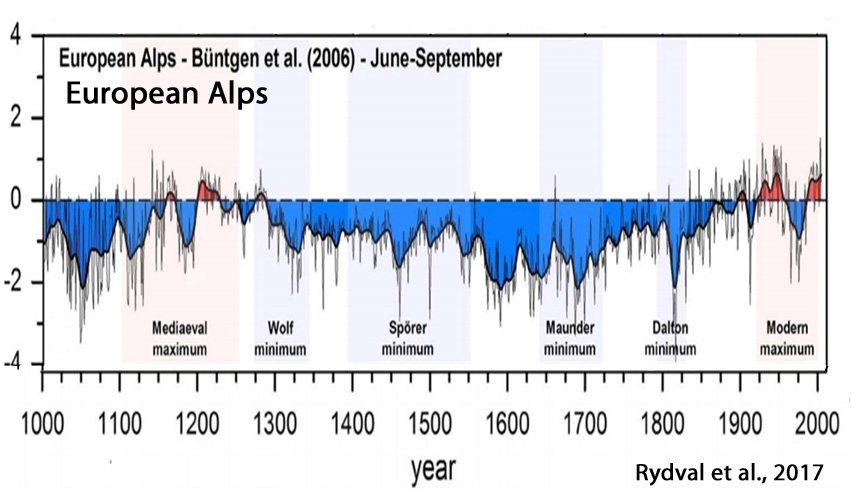

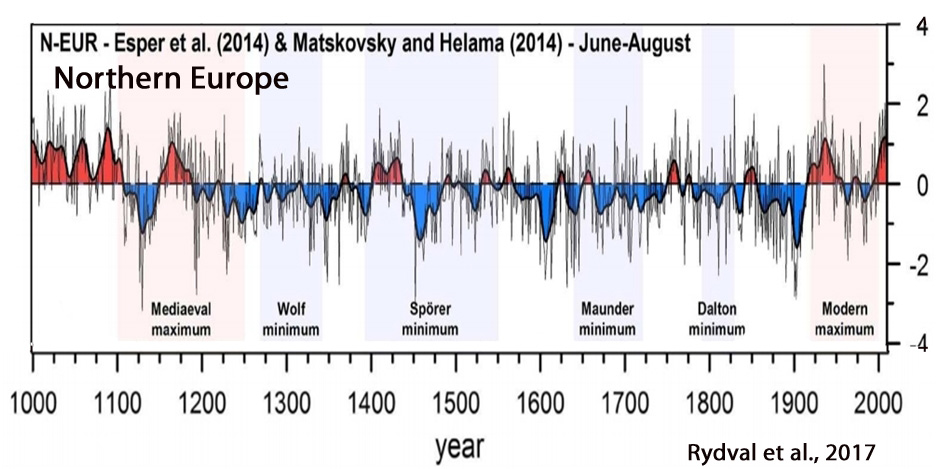
Reynolds et al., 2017
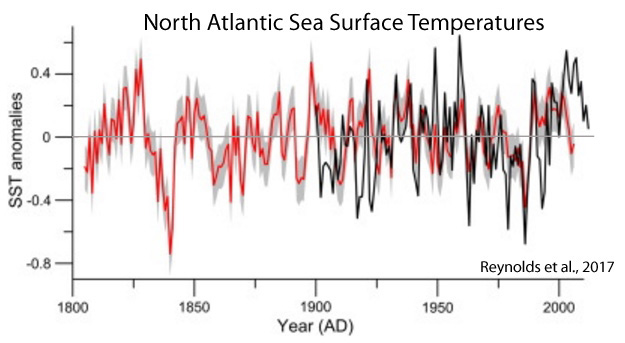
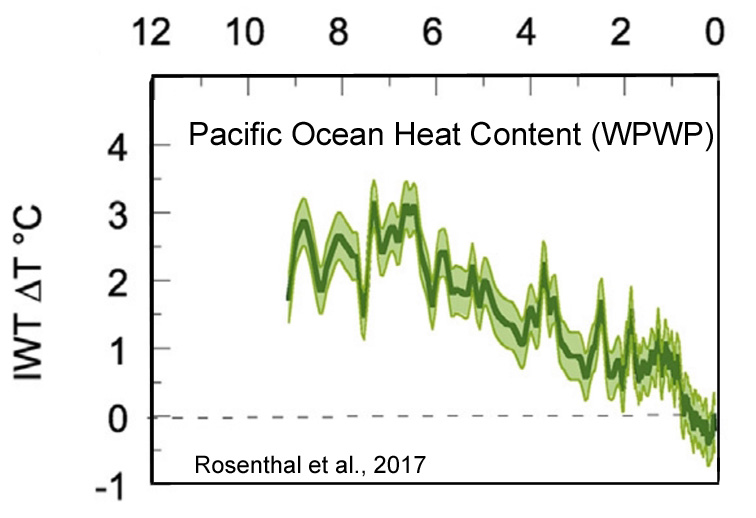
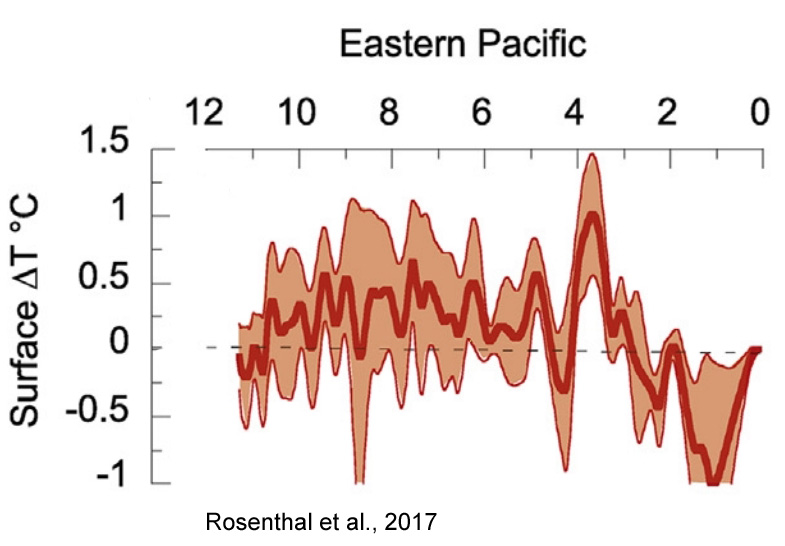
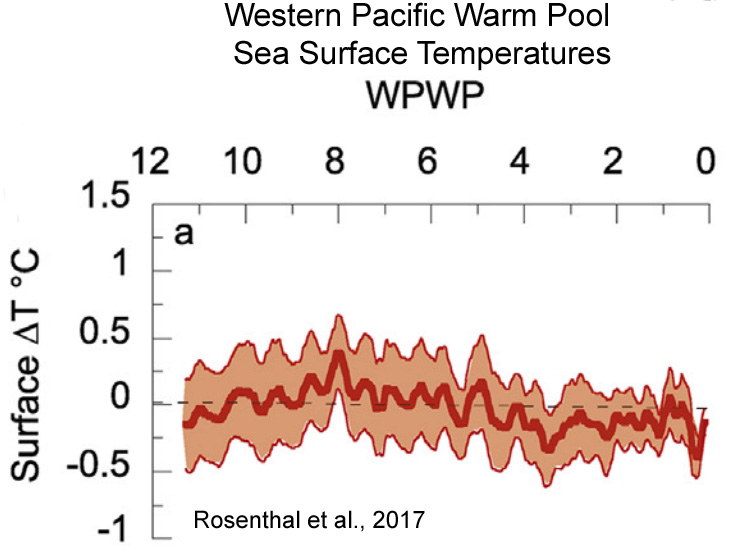
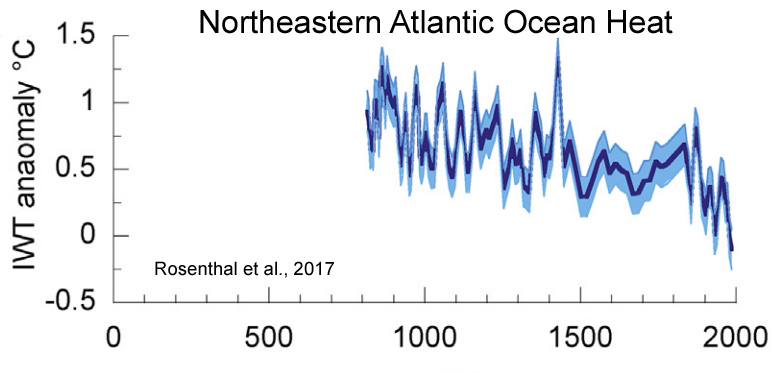
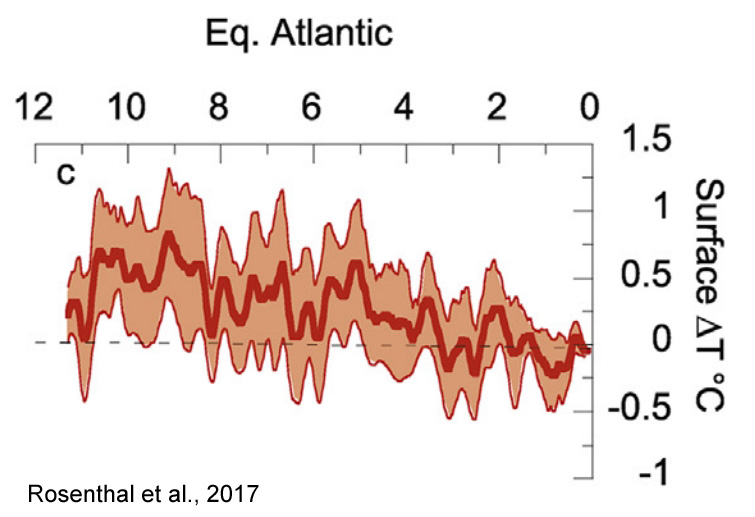
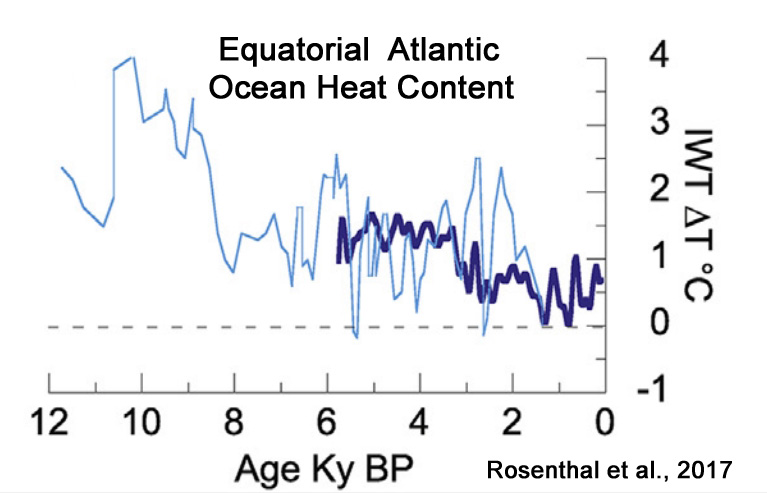
Rosenthal et al., 2017
“Here we review proxy records of intermediate water temperatures from sediment cores and corals in the equatorial Pacific and northeastern Atlantic Oceans, spanning 10,000 years beyond the instrumental record. These records suggests that intermediate waters [0-700 m] were 1.5-2°C warmer during the Holocene Thermal Maximum than in the last century. Intermediate water masses cooled by 0.9°C from the Medieval Climate Anomaly to the Little Ice Age. These changes are significantly larger than the temperature anomalies documented in the instrumental record. The implied large perturbations in OHC and Earth’s energy budget are at odds with very small radiative forcing anomalies throughout the Holocene and Common Era. … The records suggest that dynamic processes provide an efficient mechanism to amplify small changes in insolation [surface solar radiation] into relatively large changes in OHC.”
Li et al., 2017
“We suggest that solar activity may play a key role in driving the climatic fluctuations in NC [North China] during the last 22 centuries, with its quasi ∼100, 50, 23, or 22-year periodicity clearly identified in our climatic reconstructions. … It has been widely suggested from both climate modeling and observation data that solar activity plays a key role in driving late Holocene climatic fluctuations by triggering global temperature variability and atmospheric dynamical circulation“
Goursaud et al., 2017
Guillet et al., 2017

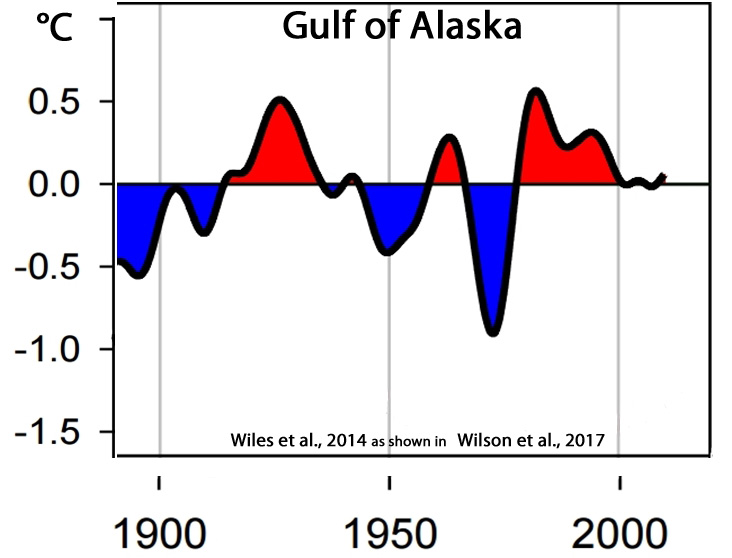
Wilson et al., 2017

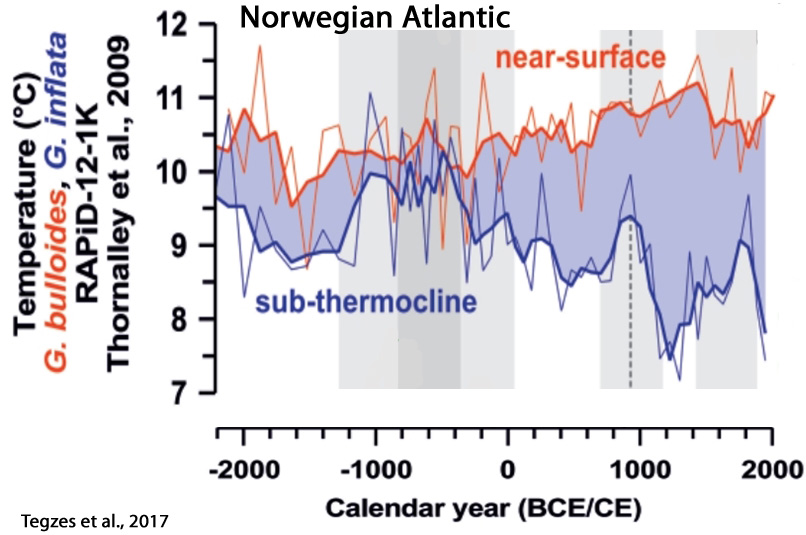
Tegzes et al., 2017
“Our sortable-silt time series show prominent multi-decadal to multi-centennial variability, but no clear long-term trend over the past 4200 years. … [O]ur findings indicate that variations in the strength of the main branch of the Atlantic Inflow may not necessarily translate into proportional changes in northward oceanic heat transport in the eastern Nordic Seas.”
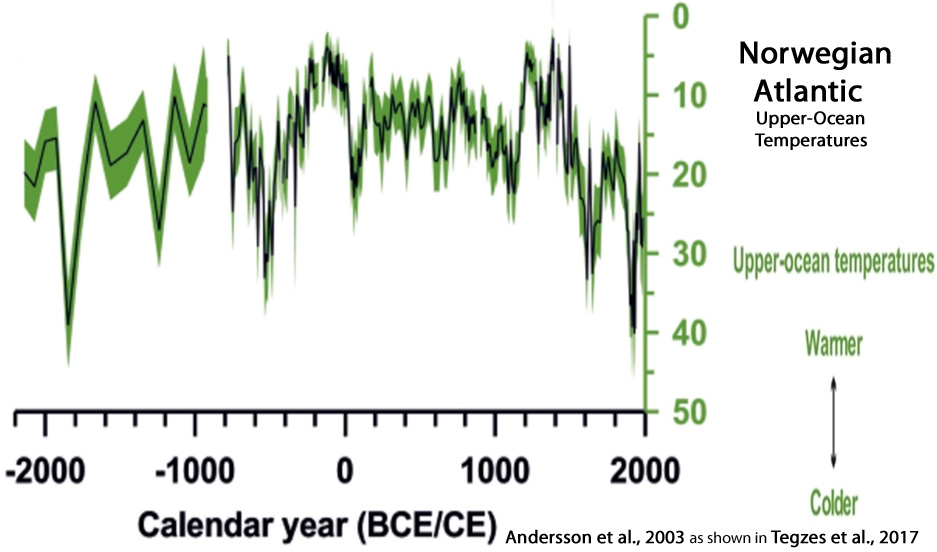
Tejedor et al., 2017

Fernández-Fernández et al., 2017

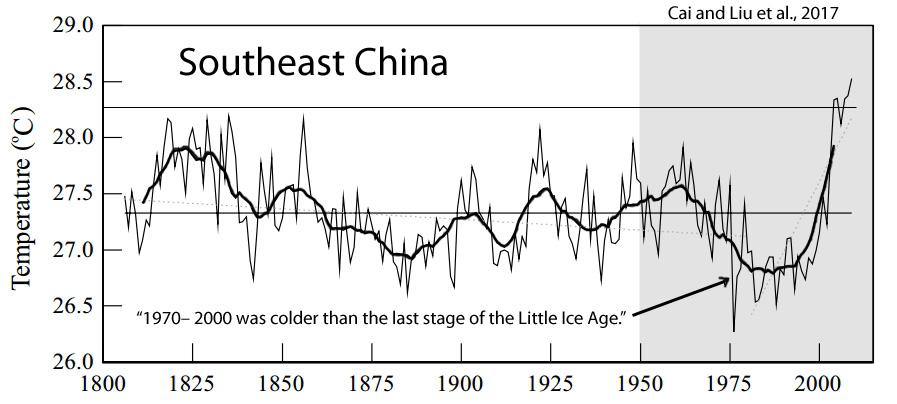
Cai and Liu et al., 2017
“2003– 2009 was the warmest period in the reconstruction. 1970– 2000 was colder than the last stage of the Little Ice Age (LIA).”
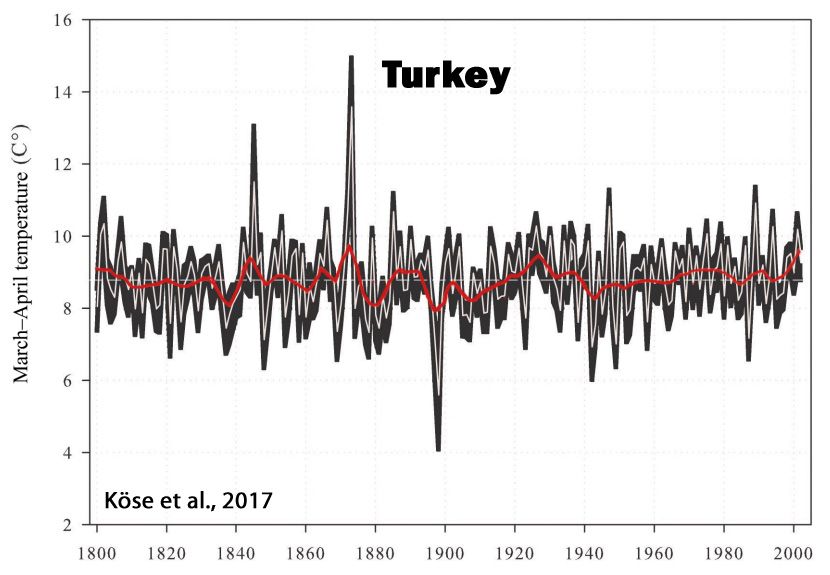
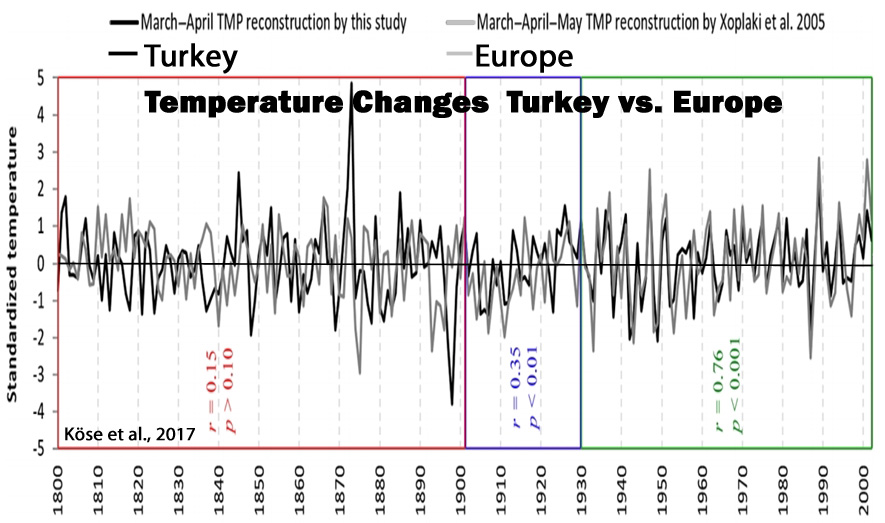
Köse et al., 2017
“The reconstruction is punctuated by a temperature increase during the 20th century; yet extreme cold and warm events during the 19th century seem to eclipse conditions during the 20th century. We found significant correlations between our March–April spring temperature reconstruction and existing gridded spring temperature reconstructions for Europe over Turkey and southeastern Europe. … During the last 200 years, our reconstruction suggests that the coldest year was 1898 and the warmest year was 1873. The reconstructed extreme events also coincided with accounts from historical records. … Further, the warming trends seen in our record agrees with data presented by Turkes and Sumer (2004), of which they attributed [20th century warming] to increased urbanization in Turkey.”
Flannery et al., 2017
“The early part of the reconstruction (1733–1850) coincides with the end of the Little Ice Age, and exhibits 3 of the 4 coolest decadal excursions in the record. However, the mean SST estimate from that interval during the LIA is not significantly different from the late 20th Century SST mean. The most prominent cooling event in the 20th Century is a decade centered around 1965. This corresponds to a basin-wide cooling in the North Atlantic and cool phase of the AMO.”

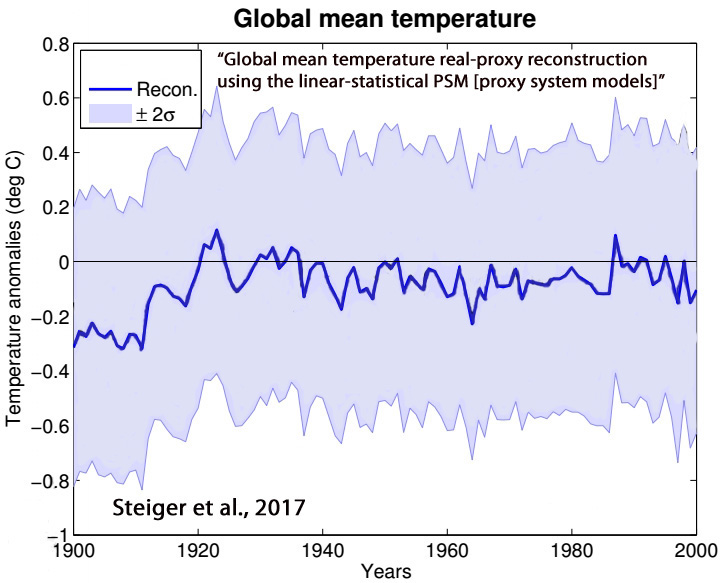
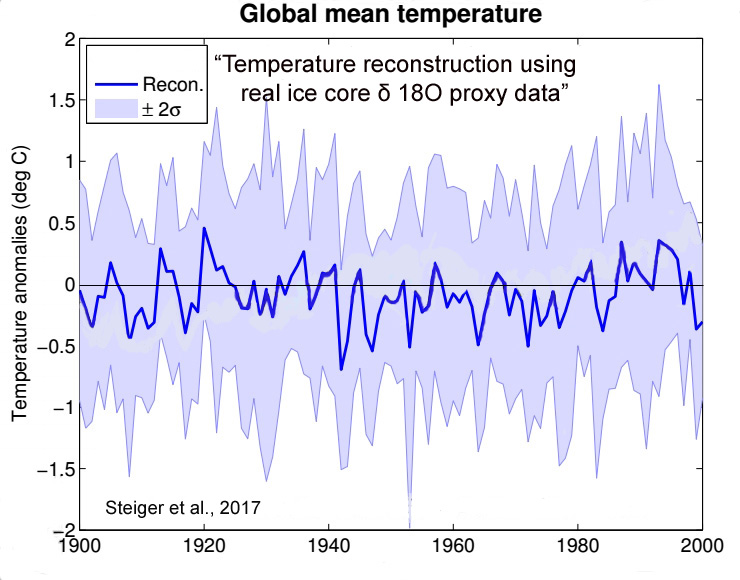
Steiger et al., 2017
“Through several idealized and real proxy experiments we assess the spatial and temporal extent to which isotope records can reconstruct surface temperature, 500 hPa geopotential height, and precipitation. We find local reconstruction skill to be most robust across the reconstructions, particularly for temperature and geopotential height, as well as limited non-local skill in the tropics. These results are in agreement with long-held views that isotopes in ice cores have clear value as local climate proxies, particularly for temperature and atmospheric circulation.”
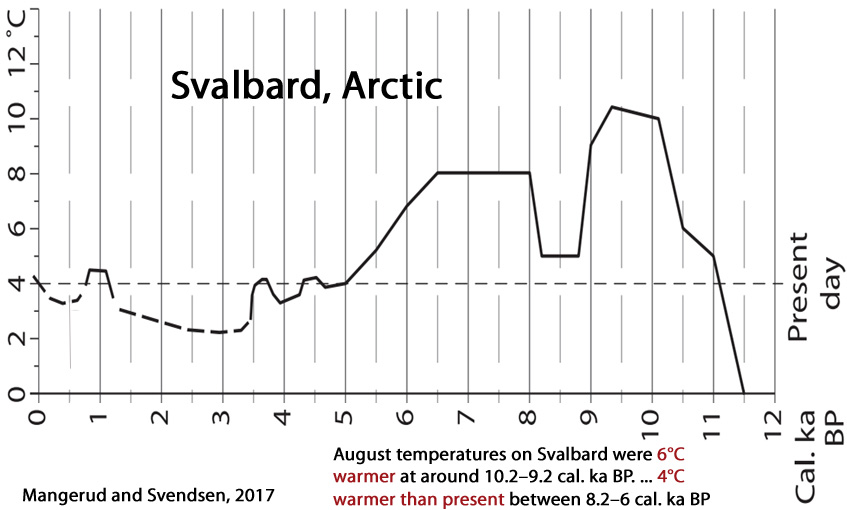
Mangerud and Svendsen, 2017
“Shallow marine molluscs that are today extinct close to Svalbard, because of the cold climate, are found in deposits there dating to the early Holocene. The most warmth-demanding species found, Zirfaea crispata, currently has a northern limit 1000 km farther south, indicating that August temperatures on Svalbard were 6°C warmer at around 10.2–9.2 cal. ka BP, when this species lived there. … After 8.2 cal. ka, the climate around Svalbard warmed again, and although it did not reach the same peak in temperatures as prior to 9 ka, it was nevertheless some 4°C warmer than present between 8.2 and 6 cal. ka BP. Thereafter, a gradual cooling brought temperatures to the present level at about 4.5 cal. ka BP. The warm early-Holocene climate around Svalbard was driven primarily by higher insolation and greater influx of warm Atlantic Water, but feedback processes further influenced the regional climate.”
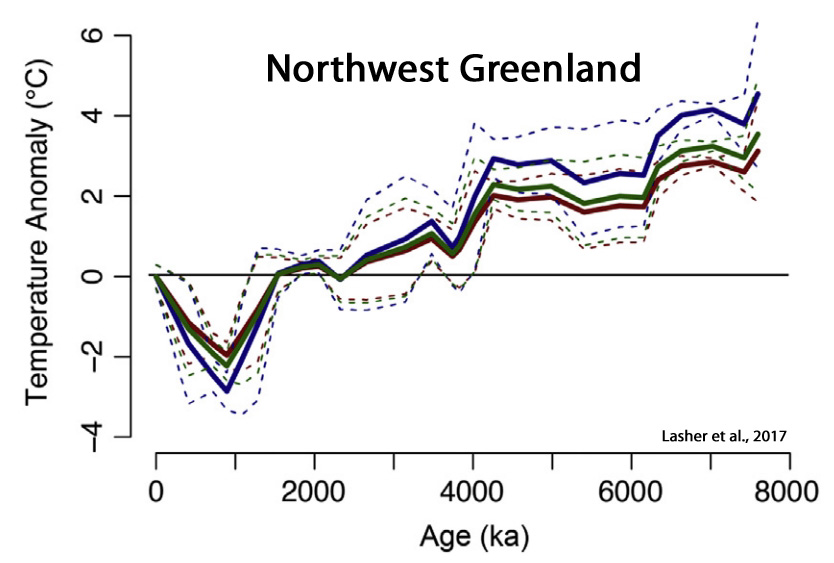
Lasher et al., 2017
“This paper presents a multi proxy lake record of NW Greenland Holocene climate. … Summer temperatures (2.5–4 °C warmer than present) persisted until ∼4 ka [4,000 years ago] … Continual cooling after 4 ka led to coldest temperatures after 1.2 ka, with temperature anomalies 2-3°C below present. Approximately 1000 km to the south, a 2-3°C July temperature anomaly (relative to [warmer than] present) between 6 and 5 ka was reported based upon chironomid assemblages near Illulisat and Jakobshavn (Axford et al., 2013). Across Baffin Bay on northeastern Baffin Island, HTM summer temperatures were an estimated ~5°C warmer than the pre-industrial late Holocene and 3.5°C warmer than present, based upon chironomid assemblages (Axford et al., 2009; Thomas et al., 2007). … Following deglaciation, the GrIS [Greenland Ice Sheet] retreated behind its present margins (by as much as 20-60 km in some parts of Greenland) during the HTM [Holocene Thermal Maximum] (Larsen et al., 2015; Young and Briner, 2015).”
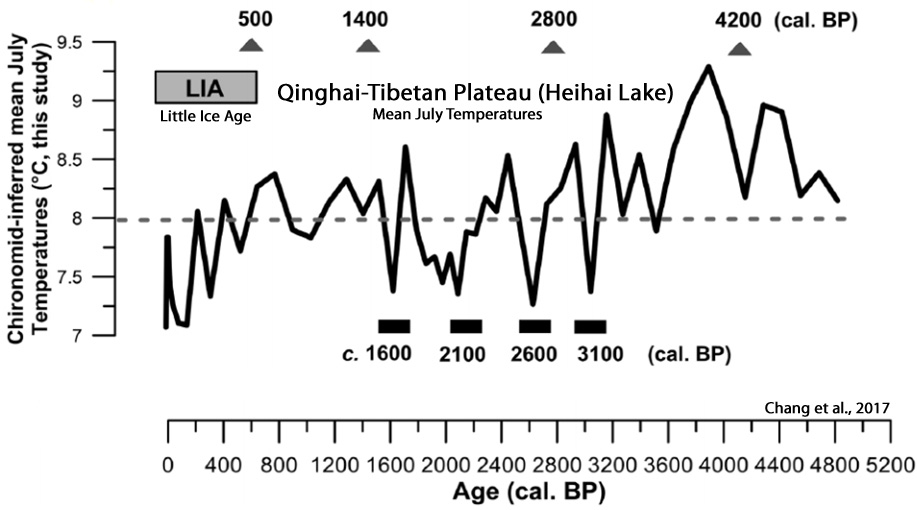
Chang et al., 2017
“The chironomid-based record from Heihai Lake shows a summer temperature fluctuation within 2.4°C in the last c. 5000 years from the south-east margin of the QTP [Qinghai–Tibetan Plateau]. … The summer temperature changes in this region respond primarily to the variation in the Asian Summer Monsoon. The variability of solar activity is likely an important driver of summer temperatures, either directly or by modifying the strength and intensity of the Indian Ocean Summer Monsoon. … We observed a relatively long-lasting summer cooling episode (c. 0.8°C lower than the 5000-year average) between c. 270 cal. BP and AD c. 1956. … The record shows cooling episodes occurred at c. 3100, 2600, 2100 and 1600 cal. BP. This is likely related to the period defined as the Northern Hemisphere Little Ice Age (LIA; c. AD 1350–1850, equivalent to 600–100 cal. BP). These possibly relate to the 500-year quasi-periodic solar cycle. Cooling stages between c. 270 and 100 cal. BP were also recorded and these are possibly linked to the LIA suggesting a hemisphere-wide forcing mechanism for this event.”
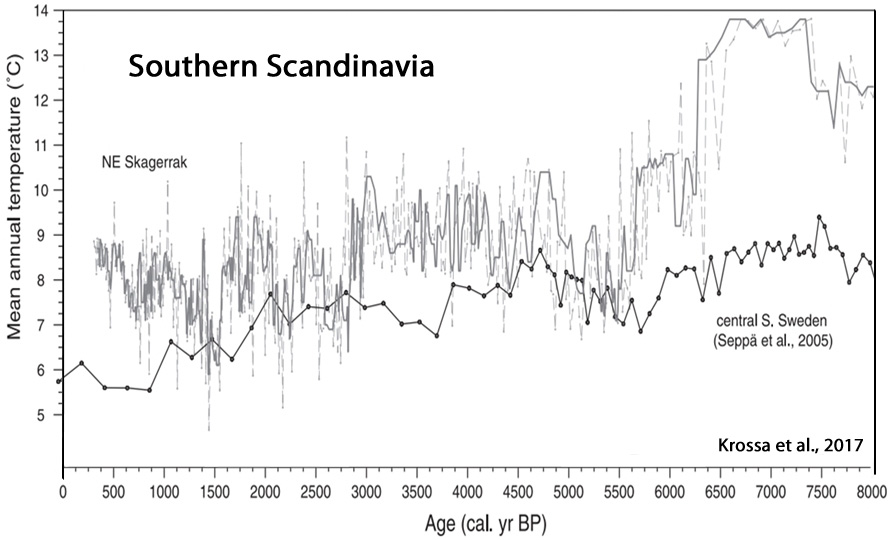
Krossa et al., 2017
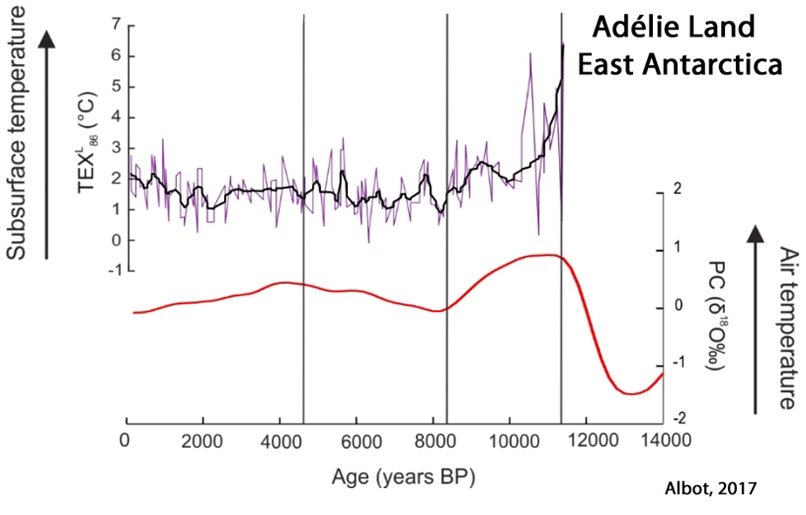
Albot, 2017
“Growing paleoclimatic evidence suggests that the climatic signals of Medieval Warm Period and the Little Ice Age events can be detected around the world (Mayewski et al., 2004; Bertler et al., 2011). … [T]he causes for these events are still debated between changes in solar output, increased volcanic activity, shifts in zonal wind distribution, and changes in the meridional overturning circulation (Crowley, 2000; Hunt, 2006).”
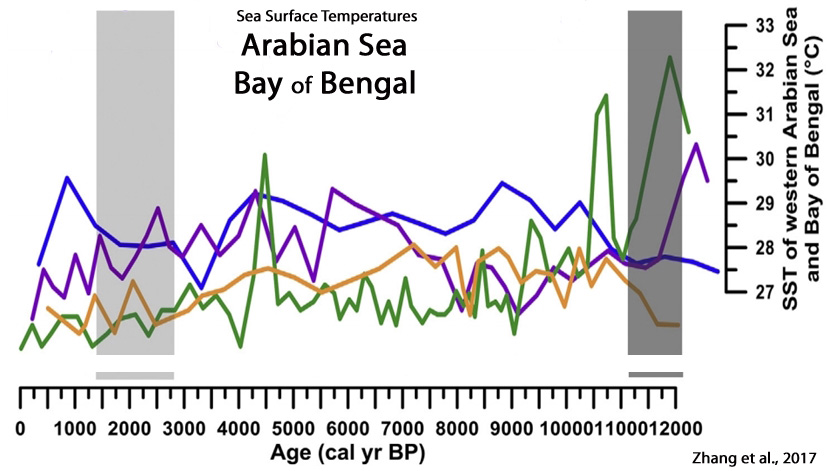
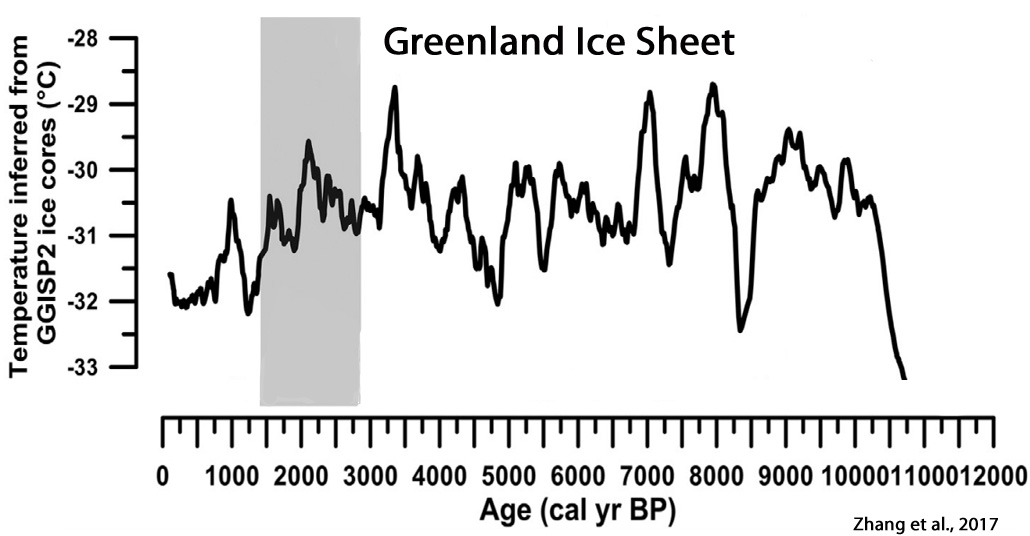
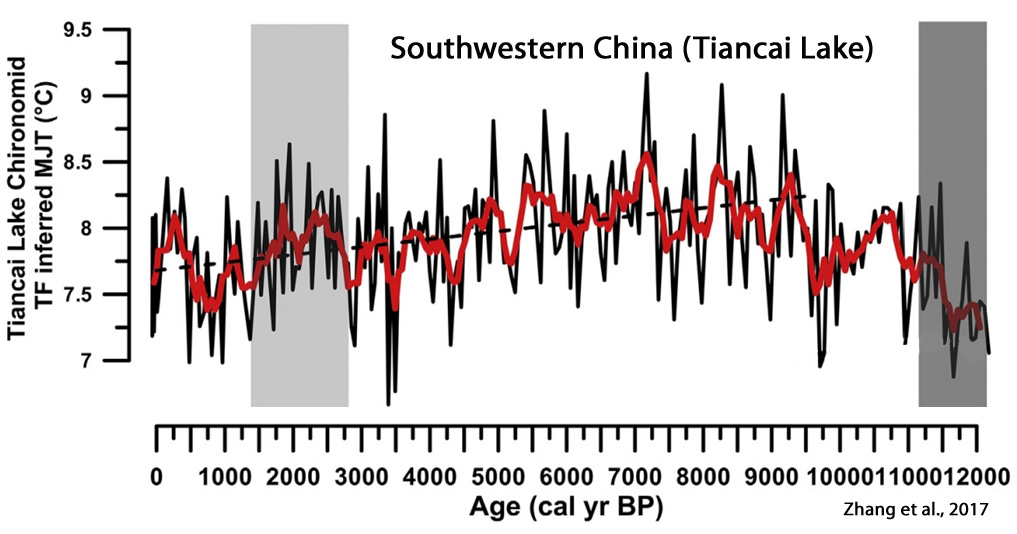
Zhang et al., 2017
“[S]ummer temperature variability at the QTP [Qinghai-Tibetan Plateau] responds rapidly to solar irradiance changes in the late Holocene”
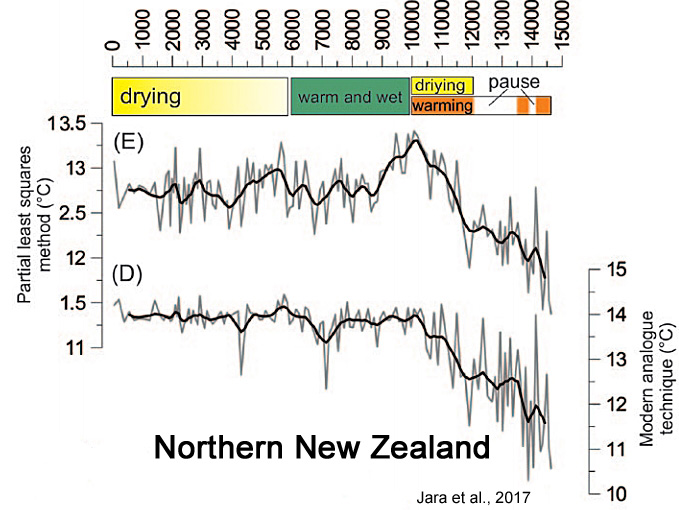
Jara et al., 2017
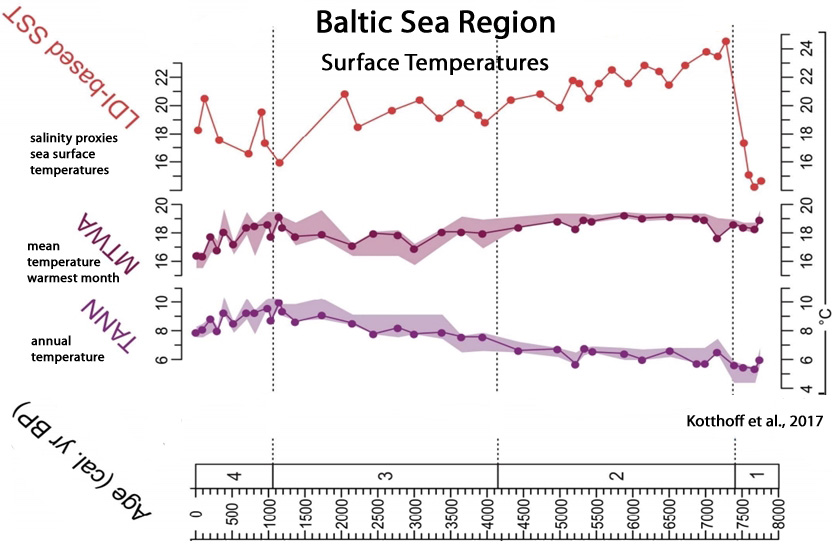
Kotthoff et al., 2017
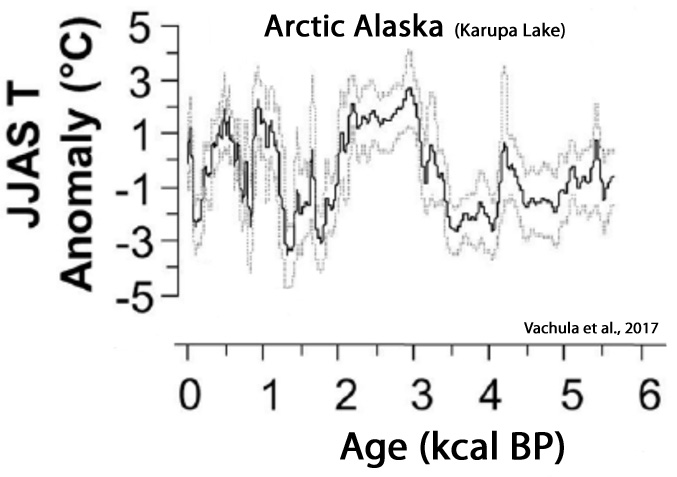
Li et al., 2017
“Overall, the strong linkage between solar variability and summer SSTs is not only of regional significance, but is also consistent over the entire North Atlantic region.”
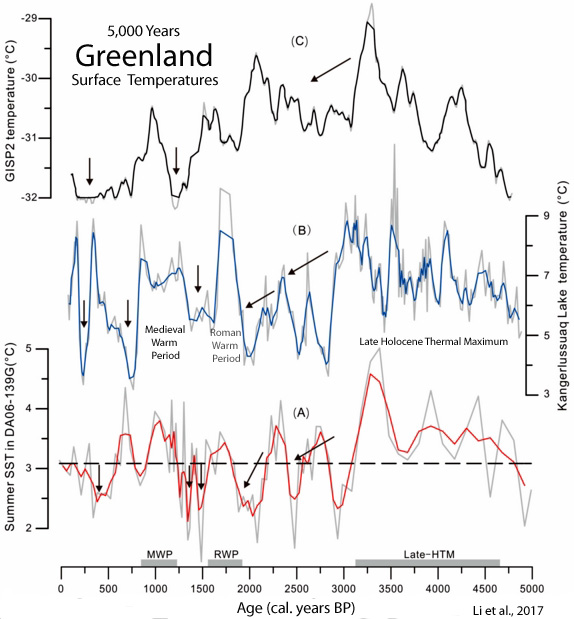
Jones et al., 2017
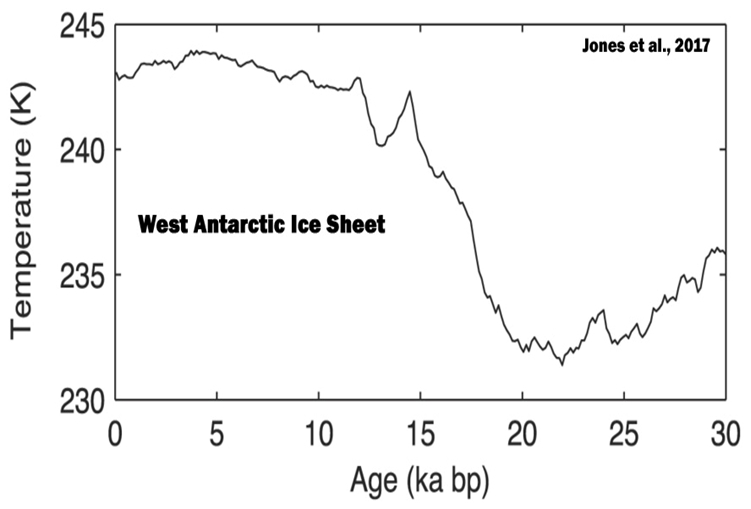
Vachula et al., 2017
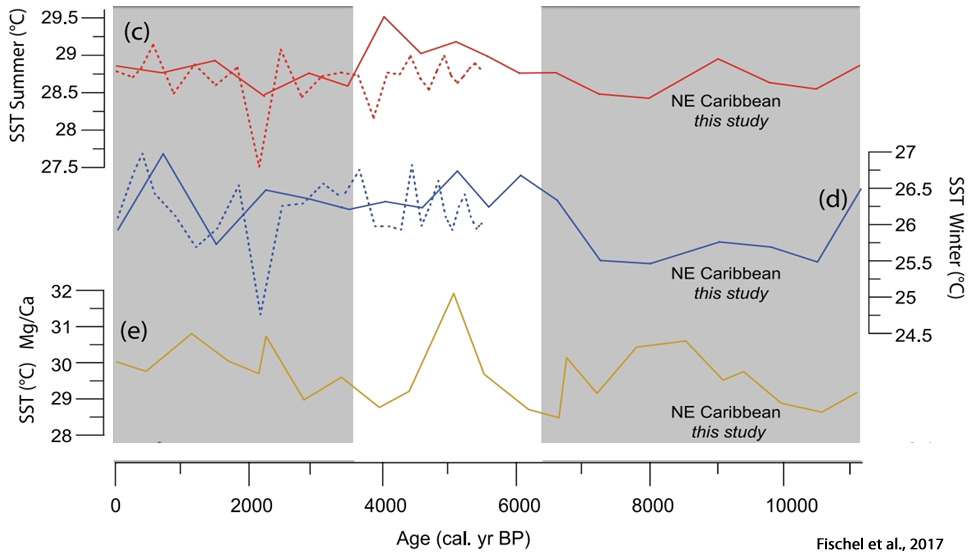
Fischel et al., 2017
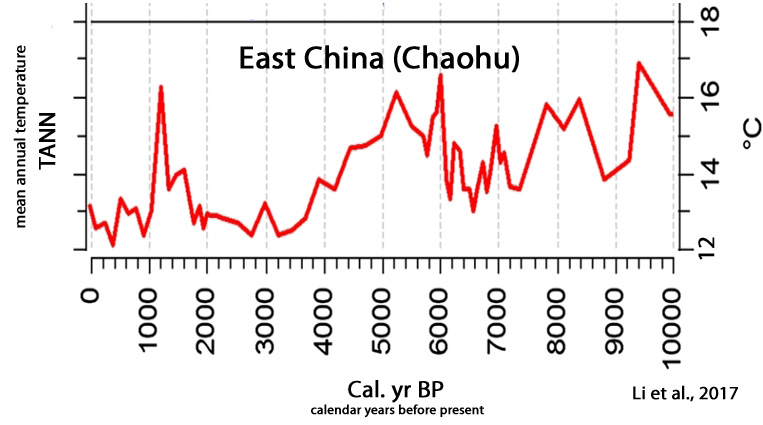
Li et al., 2017
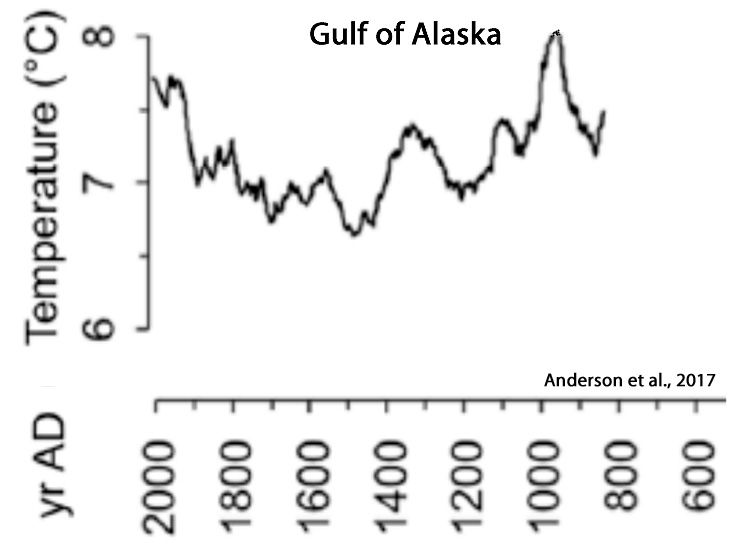
Anderson et al., 2017
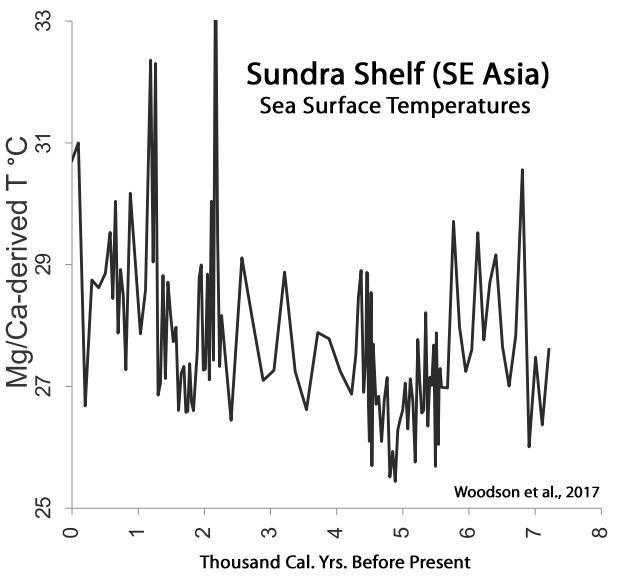
Woodson et al., 2017
“The last ca. 1000 years recorded the warmest SST averaging 28.5°C. We record, for the first time in this region, a cool interval, ca. 1000 years in duration, centered on 5000 cal years BP concomitant with a wet period recorded in Borneo. The record also reflects a warm interval from ca. 1000 to 500 cal years BP that may represent the Medieval Climate Anomaly. Variations in the East Asian Monsoon (EAM) and solar activity are considered as potential drivers of SST trends. However, hydrology changes related to the El Nino-Southern Oscillation (ENSO) variability, ~ shifts of the Western Pacific Warm Pool and migration of the Intertropical Convergence Zone are more likely to have impacted our SST temporal trend. … The SA [solar activity] trends (Steinhilber et al., 2012) are in general agreement with the regional cooling of SST (Linsley et al., 2010) and the SA [solar activity] oscillations are roughly coincident with the major excursions in our SST data.”
Koutsodendris et al., 2017
“Representing one of the strongest global climate instabilities during the Holocene, the Little Ice Age (LIA) is marked by a multicentennial-long cooling (14-19th centuries AD) that preceded the recent ‘global warming’ of the 20th century. The cooling has been predominantly attributed to reduced solar activity and was particularly pronounced during the 1645-1715 AD and 1790-1830 AD solar minima, which are known as Maunder and Dalton Minima, respectively.”

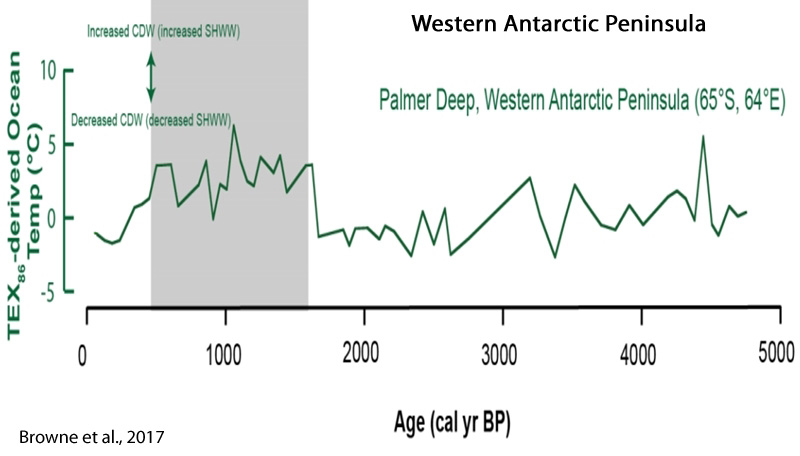
Browne et al., 2017
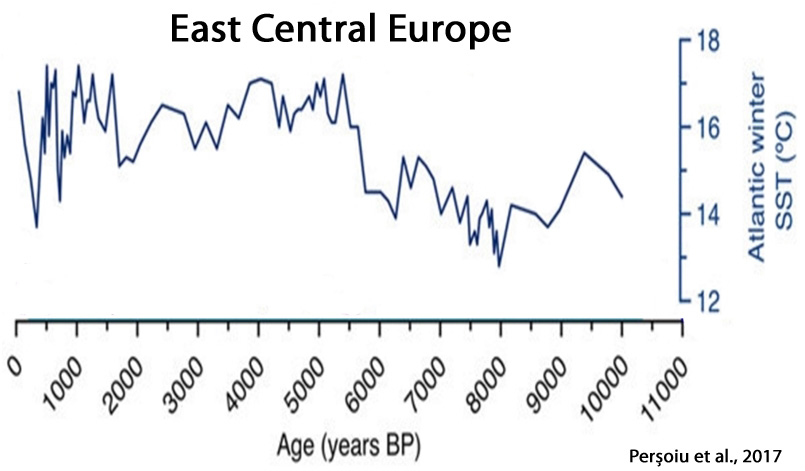
Perșoiu et al., 2017
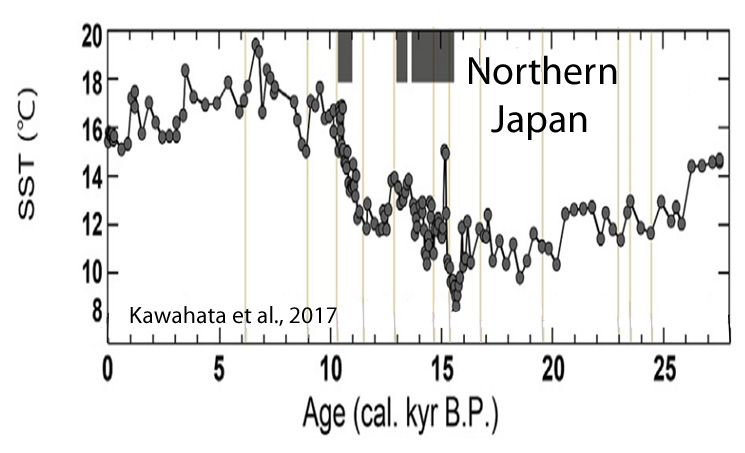
Kawahata et al., 2017
“The SST [sea surface temperature] shows a broad maximum (~17.3 °C) in the mid-Holocene (5-7 cal kyr BP), which corresponds to the Jomon transgression. … The SST maximum continued for only a century and then the SST [sea surface temperatures] dropped by 3.5 °C [15.1 to 11.6 °C] within two centuries. Several peaks fluctuate by 2°C over a few centuries.”
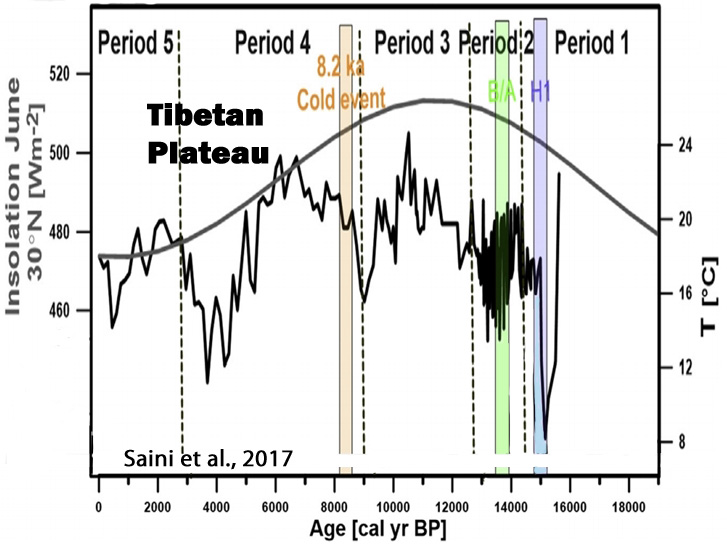
Saini et al., 2017
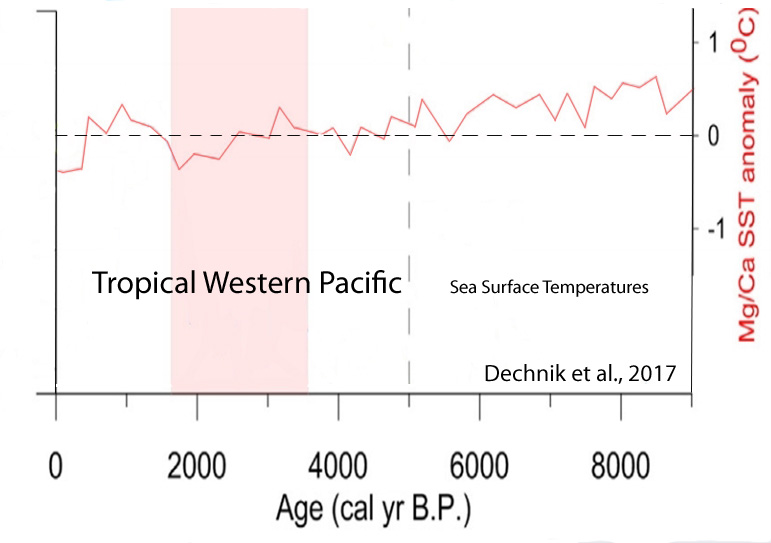
Dechnik et al., 2017
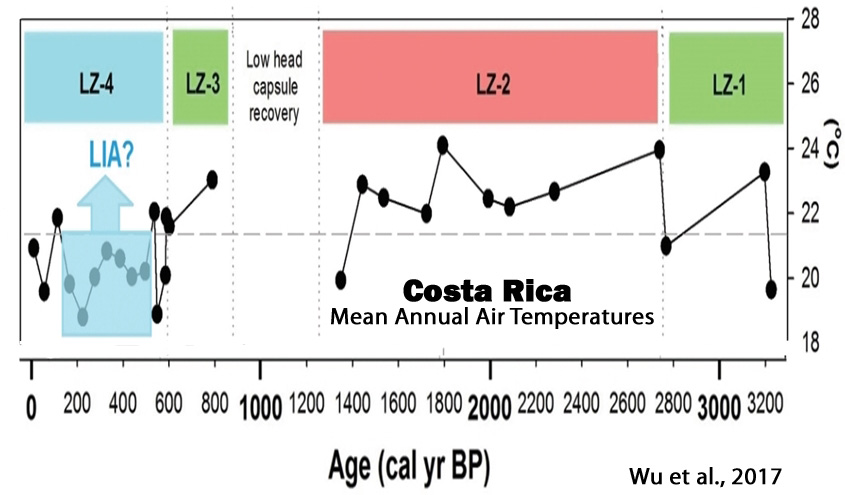
Wu et al., 2017

Sun et al., 2017
“Our findings are generally consistent with other records from the ISM [Indian Summer Monsoon] region, and suggest that the monsoon intensity is primarily controlled by solar irradiance on a centennial time scale. This external forcing may have been amplified by cooling events in the North Atlantic and by ENSO activity in the eastern tropical Pacific, which shifted the ITCZ further southwards.”

Wu et al., 2017
“The existence of depressed MAAT [mean annual temperatures] (1.3°C lower than the 3200-year average) between 1480 CE and 1860 CE (470–90 cal. yr BP) may reflect the manifestation of the ‘Little Ice Age’ (LIA) in southern Costa Rica. Evidence of low-latitude cooling and drought during the ‘LIA’ has been documented at several sites in the circum-Caribbean and from the tropical Andes, where ice cores suggest marked cooling between 1400 CE and 1900 CE. Lake and marine records recovered from study sites in the southern hemisphere also indicate the occurrence of ‘LIA’ cooling. High atmospheric aerosol concentrations, resulting from several large volcanic eruptions and sea-ice/ocean feedbacks, have been implicated as the drivers responsible for the ‘LIA’.”
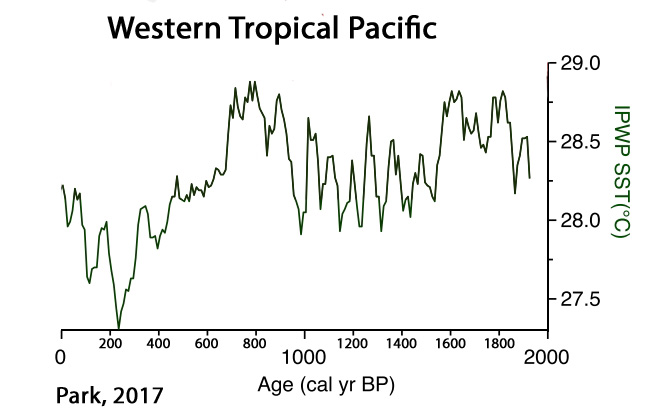
Park, 2017
“Late Holocene climate change in coastal East Asia was likely driven by ENSO variation. Our tree pollen index of warmness (TPIW) shows important late Holocene cold events associated with low sunspot periods such as Oort, Wolf, Spörer, and Maunder Minimum. Comparisons among standard Z-scores of filtered TPIW, ΔTSI, and other paleoclimate records from central and northeastern China, off the coast of northern Japan, southern Philippines, and Peru all demonstrate significant relationships [between solar activity and climate]. This suggests that solar activity drove Holocene variations in both East Asian Monsoon (EAM) and El Niño Southern Oscillation (ENSO).”
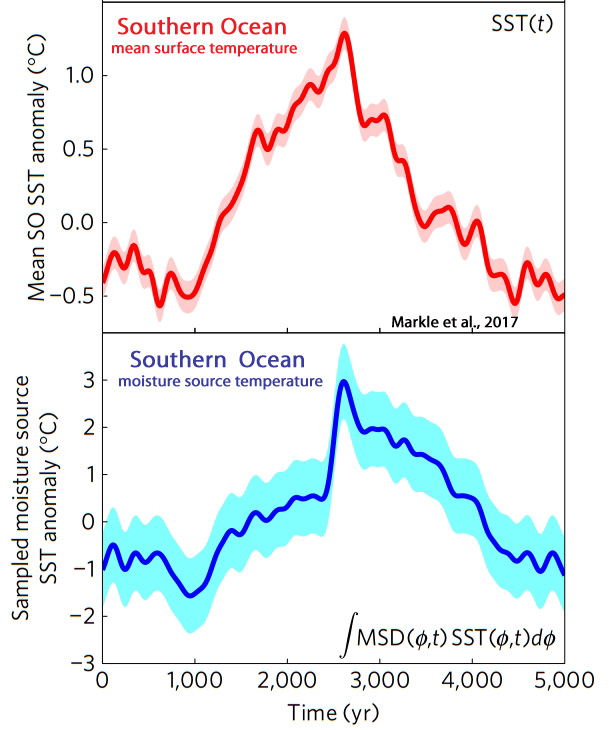
Markle et al., 2017
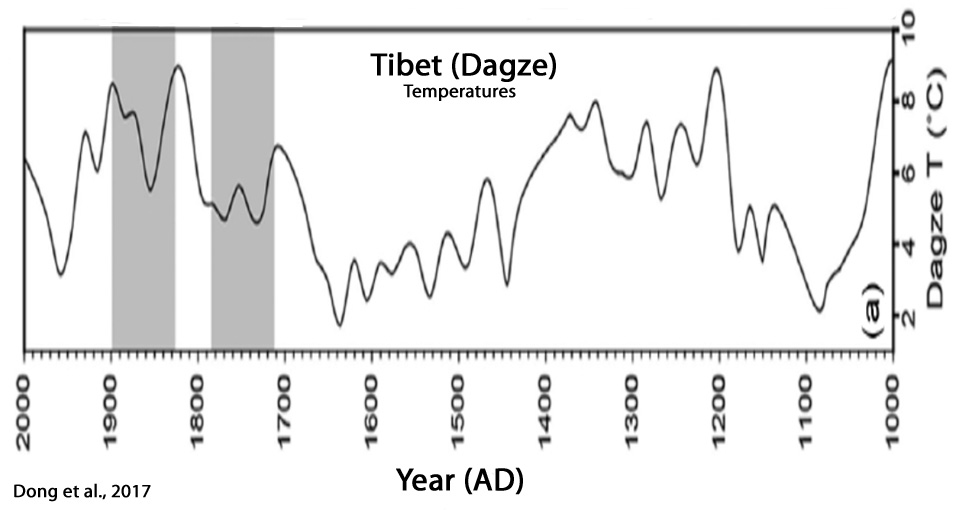
Dong et al., 2017
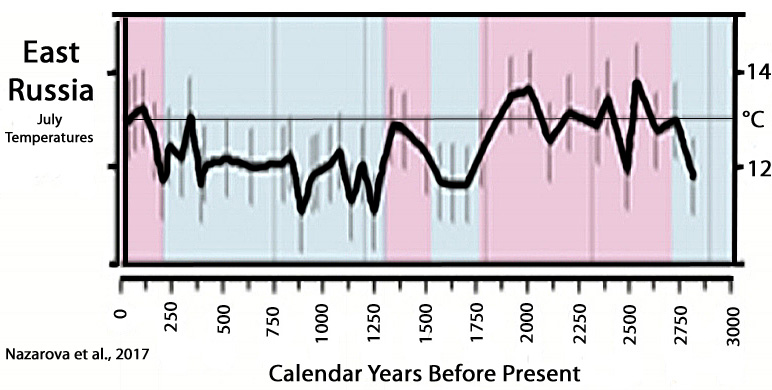
Nazarova et al., 2017
“The application of transfer functions resulted in reconstructed T July fluctuations of approximately 3 °C over the last 2800 years. Low temperatures (11.0-12.0 °C) were reconstructed for the periods between ca 1700 and 1500 cal yr BP (corresponding to the Kofun cold stage) and between ca 1200 and 150 cal yr BP (partly corresponding to the Little Ice Age [LIA]). Warm periods (modern T[emperatures] July or higher) were reconstructed for the periods between ca 2700 and 1800 cal yr BP, 1500 and 1300 cal yr BP and after 150 cal yr BP.”
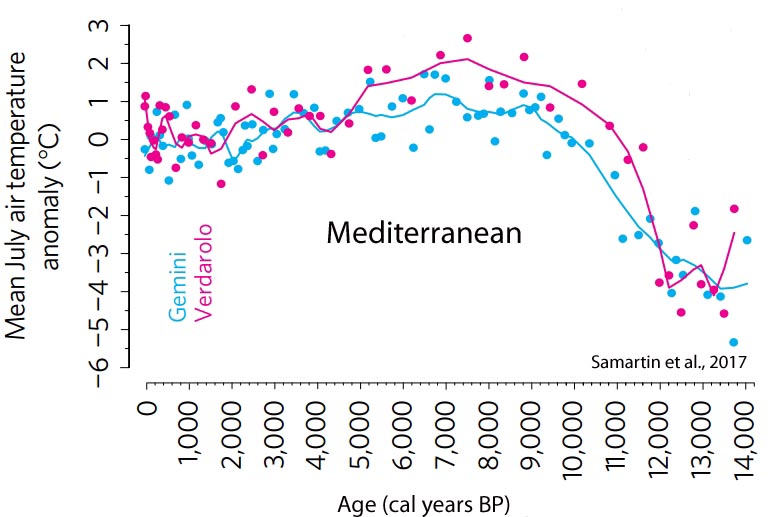
Samartin et al., 2017
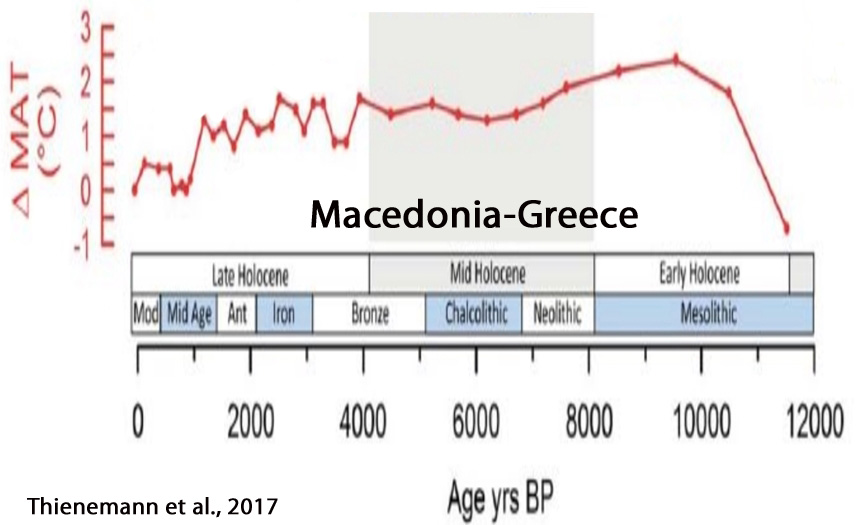
Thienemann et al., 2017
“[P]roxy-inferred annual MATs[annual mean air temperatures] show the lowest value at 11,510 yr BP (7.6°C). Subsequently, temperatures rise to 10.7°C at 9540 yr BP followed by an overall decline of about 2.5°C until present (8.3°C).”
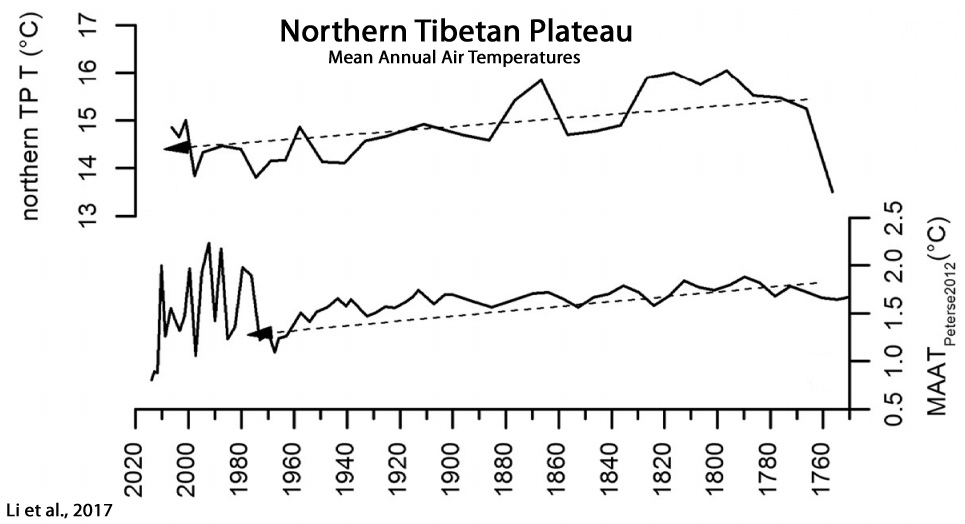
Li et al., 2017
“Contrary to the often-documented warming trend over the past few centuries, but consistent with temperature record from the northern Tibetan Plateau, our data show a gradual decreasing trend of 0.3 °C in mean annual air temperature from 1750 to 1970 CE. This result suggests a gradual cooling trend in some high altitude regions over this interval, which could provide a new explanation for the observed decreasing Asian summer monsoon. In addition, our data indicate an abruptly increased interannual-to decadal-scale temperature variations of 0.8 – 2.2 °C after 1970 CE, in terms of both magnitude and frequency, indicating that the climate system in high altitude regions would become more unstable under current global warming.”
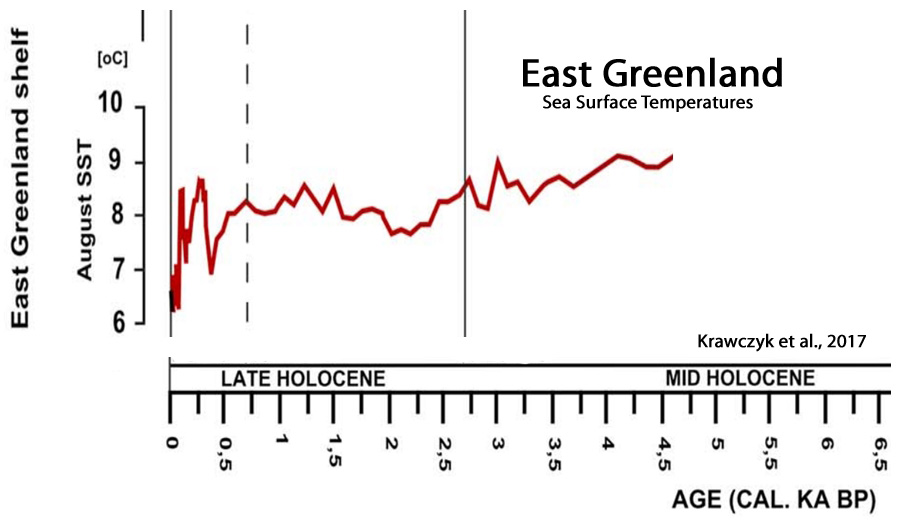
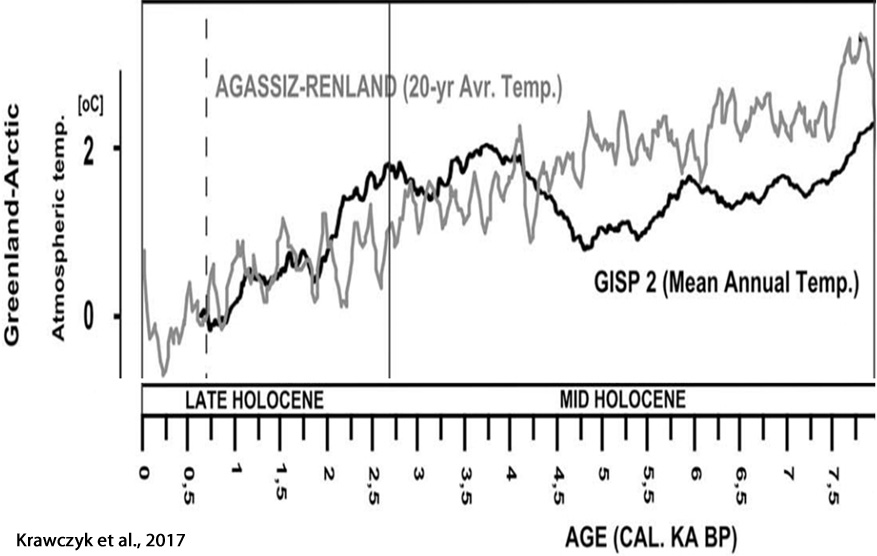
Krawczyk et al., 2017




Kenneth Richard. The issue was calculating LW absorption at the ocean surface.It is governed by the laws of radiation transport, not by what is happening in the deep ocean.The consequences to the deep ocean temperature is another matter, and is governed by the laws of convective heat transfer.
Correct. In other words, you have acknowledged that the oceans are not warmed due to downwelling longwave. In fact, you have said LW has “nothing to do” with ocean warming. So, far from just “another matter”, the acknowledgement that long wave does not heat the ocean is rather significant since 93% of the net heat changes in the climate system occur in the subsurface ocean, and just 1% of the net heat energy changes occur in the air.
Consider the trajectory is predominantly that the ocean heats the atmosphere, and not the other way around…
—
http://www.sciencedirect.com/science/article/pii/0004698184901185
The current eager acceptance of oceanic thermal lag as the “explanation” as to why CO2 warming remains undetected, reemphasizes that the atmosphere cannot warm until the oceans do.
—
http://onlinelibrary.wiley.com/doi/10.1029/1999GL011133/pdf
“[N]et surface heat flux is almost always from ocean to atmosphere, resulting in a cool ocean skin.
—
…and that you acknowledge that the oceans aren’t heated up by downwelling LW, you have effectively acknowledged that “global warming” is not forced by LW forcing. Hence, your claim that LW dominates (330 W m-2) the imbalance in heat budget of the climate system is not supported.
Kenneth Richard. The issue was calculating LW absorption at the ocean surface.It is governed by the laws of radiation transport, not by what is happening in the deep ocean.The consequences to the deep ocean temperature is another matter, and is governed by the laws of convective heat transfer.Moderator:This is not duplicate comment!
The “Climate Change” supporters are targeting a symptom, not the disease. The sickness the Earth has is Global Pollution, not “climate change.” A change in climate could be only one possible symptom of a polluted earth, but it doesn’t have to be. I can dump tons of toxic chemicals in your nearest lake or river without ever changing the temperature of the earth at all. The fact that Global Climate change supporters are not addressing the real problem (pollution) head-on, (a problem that should be obvious to any scientist), tells me they are doing all of it for their own selfish benefit. That is, to tax the world and make a profit.
Spot on!
[…] warming” is a myth — so say 80 graphs from 58 peer-reviewed scientific papers published in […]
The principal indicators that warmists use is the correlation between CO2 levels and temperature.
Where their arguments fall apart is that it appears that CO2 rises lag behind temperature rise.
Why does nobody address this issue thoroughly to discredit the warmists?
The first half of this article lists about 10 scientific papers supporting this finding. This is just one of many problems with the narrative.
check facetime for pc official by facetimeforpc.site
uhhh, no, they dont, got reread the data, look at the bigger picture
IPCC AR4 (2007): “Atmospheric CO2 follows temperature changes in Antarctica with a lag of some hundreds of years.”
–
Caillon et al., 2003 “The sequence of events during Termination III suggests that the CO2 increase lagged Antarctic deglacial warming by 800 ± 200 years and preceded the Northern Hemisphere deglaciation.”
–
Fischer et al., 1999 “High-resolution records from Antarctic ice cores show that carbon dioxide concentrations increased by 80 to 100 parts per million by volume 600 ± 400 years after the warming of the last three deglaciations.”
–
Monnin et al., 2001 “The start of the CO2 increase thus lagged the start of the [temperature] increase by 800 ± 600 years.”
–
Humlum et al., 2013 “There exist a clear phase relationship between changes of atmospheric CO2 and the different global temperature records, whether representing sea surface temperature, surface air temperature, or lower troposphere temperature, with changes in the amount of atmospheric CO2 always lagging behind corresponding changes in temperature.”
—
Kovalenko, 2014 “Observable correlations between long-term variations in the global temperature (GT) and CO2 content do not mean that the CO2 increase causes an increase in the global temperature. Actually observable temperature rise in the ocean also results in the increased content of CO2 in the atmosphere; therefore, such changes can be a consequence, but not a cause of global heating.”
–
Kawamura et al., 2007 “Our chronology also indirectly gives the timing of the CO2 rise at [glacial] terminations, which occurs within 1 kyr of the increase in Antarctic temperature.”
–
Indermuhle et al., 2000 “The [CO2] lag was calculated for which the correlation coefficient of the CO2 record and the corresponding temperatures values reached a maximum. The simulation yields a [CO2] lag of (1200 ± 700) yr.
–
Landais et al., 2013 “[F]rom 130.5 to 129,000 years ago, the rise in atmospheric CO2 concentrations lagged that of Antarctic temperature unequivocally….At mid-slope, there is an unequivocal lead of δ15N [temperature] over CO2 of 900 ± 325 yr”.
–
Schneider et al., 2013 “Furthermore, a 5,000 yr lag in the CO2 decline relative to EDC [East Antarctica] temperatures is confirmed during the glacial inception at the end of MIS5.5 (120,000 yrs before present).”
–
Stott et al., 2007 “Deep-sea temperatures warmed by ∼2°C between 19 and 17 thousand years before the present (ky B.P.), leading the rise in atmospheric CO2 and tropical–surface-ocean warming by ∼1000 years.”
How does the fact that C02 has lagged warming in the past prove that C02 can’t be a driver? Surely you are familiar with the physics behind C02 trapping heat…this has been known for over 100 years. Also, I’m sure you understand positive feedback.
If, in fact, C02 isn’t the driver of the current warming period, what is? And, please use studies to back-up your claim.
Steve E. the reason why you got ignored is because you were given numerous published science papers showing that CO2 changes FOLLOWS Temperature changes.
Therefore it can not be a driver of temperature changes.
You show your ignorance with this statement that is absurd:
“Surely you are familiar with the physics behind C02 trapping heat…this has been known for over 100 years.”
CO2 doesn’t adsorb heat at all,it absorbs Infrared radiation,therefore it can’t trap what it never absorbs.
You also wrote this silliness:
“Also, I’m sure you understand positive feedback.”
yes it is in climate MODELS,but never found in nature,certainly not in the last 500 Million years.
Warmists like you never get around to posting science papers,using empirical data show that such claims exist.
Steve E.
Heat shows up only at BOUNDARY situation of energy transfer.
Here is a scholarly description:
From “Thermodynamics”, G. J. V. Wylen, John Wiley & Sons, 1960
“Heat is defined as the form of energy that is transferred across a boundary by virtue of a temperature difference or temperature gradient. Implied in this definition is the very important fact that a body never contains heat, but that heat is identified as heat only as it crosses the boundary. Thus, heat is a transient phenomenon. If we consider the hot block of copper as a system and the cold water in the beaker as another system, we recognize that originally neither system contains any heat (they do contain energy, of course.) When the copper is placed in the water and the two are in thermal communication, heat is transferred from the copper to the water, until equilibrium of temperature is established. At that point we no longer have heat transfer, since there is no temperature difference. Neither of the systems contains any heat at the conclusion of the process. It also follows that heat is identified at the boundaries of the system, for heat is defined as energy being transferred across the system boundary.”
====================================================
Steve you have been lied too,since Heat exist only in transitory conditions.
[…] warming” is a myth — so say 80 graphs from 58 peer-reviewed scientific papers published in […]
M. Gosselin:
Citing this post, James Delingpole informs Breitbart Readers:
“Global warming” is a myth — so say 80 graphs from 58 peer-reviewed scientific papers published in 2017.
In how many of the 58 papers you cite can any such phrase as:
“Global waming” is a myth” be found ?
if it does not, whay have you not posted a correction to
http://www.breitbart.com/big-government/2017/06/06/delingpole-global-warming-is-myth-58-scientific-papers-2017/ ?
Climate scientists, including myself, have experimentaly detrermined that Delingpole’s Breitbart column rejects, censors or quickly removes critical
comments from us, so it’s up to you to defend yourself in this matter.
The Breitbart headline – which is obviously not something we can control here – purposefully sensationalizes the content of this article by using the phrase “Global Warming Is A Myth.” Apparently it worked, as there are now about 10,000 comments logged at Breitbart…and nearly 20,000 shares and re-tweets here.
Of course, when regional or local paleoclimate reconstructions do not indicate an unprecedented or unusual warming in the last 50-60 years, the authors are not going to conclude that their reconstruction alone invalidates global warming. But as the title of this particular article suggests, the narrative that says modern warming has been global in its scope is not supported by an accumulation of hundreds of papers (extending back to 2014 alone) that show no significant change, or no change outside the range of natural variability (i.e., the Medieval or Roman periods had more warmth) in the era of assumed anthropogenic forcing. If you read the introduction to this article, it states:
As an example, take these 5 papers from 2016 in which the authors clearly state that there was no significant post-1950 warming in these regions:
Fortin and Gajewski
https://notrickszone.com/wp-content/uploads/2016/12/Holocene-Cooling-Canadian-Arctic-Fortin-16-copy.jpg
“[I]n the last 150 yr, the reconstructed temperatures do not indicate a warming during this time. … Modern inferred temperatures based on both pollen and chironomids are up to 3°C cooler than those inferred for the mid-Holocene.”
—
De Jong et al., 2016 (Andes, South America)
https://notrickszone.com/wp-content/uploads/2016/12/Holocene-Cooling-Andes-South-America-De-Jong-16.jpg
[T]he reconstruction…shows that recent warming (until AD 2009) is not exceptional in the context of the past century. For example, the periods around AD 1940 and from AD 1950–1955 were warmer. This is also shown in the reanalysis data for this region and was also observed by Neukom et al. (2010b) and Neukom and Gergis (2011) for Patagonia and central Chile. Similarly, based on tree ring analyses from the upper tree limit in northern Patagonia, Villalba et al. (2003) found that the period just before AD 1950 was substantially warmer than more recent decades.
—
Zhu et al., 2016 (China)
https://notrickszone.com/wp-content/uploads/2016/12/Holocene-Cooling-China-Zhu16.jpg
“[W]e should point out that the rapid warming during the 20th century was not especially obvious in our reconstructed RLST [surface temperature].”
—
Hasholt et al., 2016
https://notrickszone.com/wp-content/uploads/2016/12/Holocene-Cooling-Greenland-Southeast-Hasholt-16-1.jpg
“We determined that temperatures for the ablation measurement periods in late July to early September were similar in both 1933 and the recent period, indicating that the temperature forcing of ablation within the early warm period and the present are similar.”
—
Christy and McNider, 2016
https://notrickszone.com/wp-content/uploads/2016/12/Holocene-Cooling-Alabama-Christy-McNider-16-768×516.jpg
“The time frame is 1883-2014. … Varying the parameters of the construction methodology creates 333 time series with a central trend-value based on the largest group of stations of -0.07 °C decade-1 with a best-guess estimate of measurement uncertainty being -0.12 to -0.02 °C decade-1″
—
You may want to look at all 60 papers from 2016, which added to 2017 makes almost 120 papers just in the last 17 months that also indicate modern warming is neither unprecedented or unremarkable. When adding them all together, it would be hard to justify the claim that modern warming has been global in its scale. Some regions are warming, yes. But that doesn’t mean that the whole globe is. That was our point here. Breitbart’s point was to say that global warming is a myth…to garner more attention. Again, we have no control over the headlines used by media linking to our articles.
You could of course attempt to prove it is NOT a myth.
There is NO CO2 warming signature in the whole of the satellite data record.
The ONLY warming has come from EL Nino and ocean effects, NEITHER of which is in any way affected by CO2
We await your proof that it is NOT a myth.
Proof that CO2 causes warming in a convective atmosphere or causes warming of oceans has so far been absolutely ZERO.
[…] warming” is a myth — so say 80 graphs from 58 peer-reviewed scientific papers published in […]
Kennith, you don’t know shit. Now leave the science to us scientists and go miss-interpret something else
Question for you…
Between the Medieval Warm Period and Little Ice Age, the heat content of the Pacific Ocean plummeted by -0.9 C:
https://notrickszone.com/wp-content/uploads/2017/03/Holocene-Cooling-Pacific-Ocean-Heat-Content-Rosenthal-13.jpg
During this same period, CO2 concentrations rose. So what was the radiative source that caused the heat content (0-700 m layer) to drop so dramatically? What was the forcing mechanism for the cooling? Let’s see what you know.
There are a lot of examples of periods in the past with higher CO2 and lower temperatures. That’s because CO2 is not the only factor influencing global temperatures.
But that in itself can never refute the current global warming caused by CO2 …
By the way, the idea that there has been a Medieval Warm Period is only correct when you limit analysis to the northern hemisphere. As soon as you look at GLOBAL temperatures, it has been proven that there has been no Medieval Warm Period … :
http://www.nature.com/nclimate/journal/v4/n5/full/nclimate2174.html
As to the papers above: not one confirms the idea that there’s no AGW, more than one even explicitly confirms AGW, and overall, you cannot possibly conclude from the fact that the earth has warmed up before that this time, it’s not human activity that is causing it …
But what if the warming isn’t actually global in scale? Why do you call it “global” anyway? Between the 1940s and 1990s, the Arctic cooled…even though CO2 concentrations rose dramatically. It’s only begun warming again since the 1990s. The Arctic as a whole is no warmer now than it was in the 1920s-1940s. Since 1979, Antarctica and the Southern Ocean have been cooling. Many regions from around the world are no warmer now than they were in the 1940s. According to Robson et al., 2016, some regions of the ocean have cooled by as much as 1 degree C since the 1950s. The North Atlantic is no warmer now than it was in the 1960s…as it’s been cooling for the last 10 years. According to Wunsch and Heimbach (2014), since 1992 the “entirety of the Pacific and Indian Oceans, along with the eastern Atlantic basin” has been cooling below 2000 meters. In sum, what if the current regional and local warming isn’t anything unusual or unprecedented when compared to what has occurred due to natural variability? How does one detect an anthropogenic signal if there isn’t anything unusual about what is currently happening?
And the Medieval Warm Period was not limited to the Northern Hemisphere. I can provide dozens of examples of reconstructions that show much warmer temperatures during Medieval times from the SH. I highly doubt you are interested, though. You appear to be ensconced in your perspective.
So you obviously believe that changing the CO2 concentration above a body of water is what causes heat changes in that body of water…and since 93% of net heat changes in the Earth system occur in the ocean, therefore CO2 necessarily must be the dominant cause of heating or cooling the oceans to depths of 4000 meters. Do you have physical measurements from an actual scientific experiment that shows how much cooling occurs in water bodies when CO2 concentrations are reduced by, say, 10 ppm (-0.00001)?
Speaking of ocean-cooling, what was the mechanism that caused the Pacific Ocean to cool (mostly) and warm (sometimes) so dramatically during the last ~8,000 years (below link)?
https://notrickszone.com/wp-content/uploads/2017/03/Holocene-Cooling-Pacific-Ocean-Heat-Content-Rosenthal-13.jpg
What mechanism caused these heat losses…since CO2 rose as the oceans were cooling? Do you know?
Poor Eric, has your junior high non-science deserted you ?
Seems that a mindless twitter-like rant is all you have to offer.
At least its not full of meaningless analogies and anti-fact fantasies like seb and sob.
There is NO WAY you are any sort of real scientist.
Maybe a “social scientist” or a did you study “home science”??
[…] warming” is a myth — so say 80 graphs from 58 peer-reviewed scientific papers published in […]
[…] The scientific “consensus” about the global warming lie, cited by the left without hesitation, is not science and President Trump was right in pulling the U.S. out of the Paris Climate agreement, an agreement based on the pretense that the massive lie of global warming is true. […]
You got all wrong the message and plots from Persoiu et al. (2017). Please go back and read again the entire paper! Also, double check what we plotted in Fig. 3 and what you picked to support your argument!
a BS compilation I am afraid
nothing more to say, except if you think you have a story, write a paper – in this case a review – and let it go through peer review
I sputter at such nonsense!
“a BS compilation I am afraid”
How substantive. All of these papers have gone through peer-review. Here are another 60 more from 2016:
https://notrickszone.com/2016/12/22/the-hockey-stick-collapses-50-new-2016-scientific-papers-affirm-todays-warming-isnt-global-unprecedented-or-remarkable/
What does selecting isolated charts and graphs from disparate papers prove? What is more interesting is the opinion of the authors, not laymen such as you and I. What do the authors of the study conclude regarding global warming?
[…] In summation, the minute warming that we are seeing is neither global nor historically unusual. In fact, the eighty graphs published by those fifty-eight papers prove that climate change is neither uniform nor significant (via No Tricks Zone). […]
[…] warming” is a myth — so say 80 graphs from 58 peer-reviewed scientific papers published in […]
[…] Of course, they will ignore them because they don’t actually care about real science. They only care about the bogus science that has been repeatedly debunked and proven to be intentionally falsified, because they are cultists. From No Trick Zone: […]
[…] Of course, they will ignore them because they don’t actually care about real science. They only care about the bogus science that has been repeatedly debunked and proven to be intentionally falsified, because they are cultists. From No Trick Zone: […]
[…] Of course, they will ignore them because they don’t actually care about real science. They only care about the bogus science that has been repeatedly debunked and proven to be intentionally falsified, because they are cultists. From No Trick Zone: […]
[…] « réchauffement climatique anthropique » est un mythe : c’est ce que démontre une série impressionnante de 80 graphiques publiés depuis début 2017 dans le cadre d’articles scientifiques certifiés par des comités de […]
[…] 60 Scientific Papers in 2017 Reject Global Warming Papers confirm climate fluctuations are normal part of climate cycles. FULL STORY […]
[…] as collated by Kenneth Richard at No Tricks Zone, are just some of the charts to prove […]
[…] Even worse for the “climate change is all man’s fault” crowd is that more and more scientists are starting to issue peer reviewed papers that show a different story: […]
[…] « réchauffement climatique anthropique » est un mythe : c’est ce que démontre une série impressionnante de 80 graphiques publiés depuis début 2017 dans le cadre d’articles scientifiques certifiés par des comités […]
[…] The scientific “consensus” about the global warming lie, cited by the left without hesitation, is not science and President Trump was right in pulling the U.S. out of the Paris Climate agreement, an agreement based on the pretense that the massive lie of global warming is true. […]
[…] https://notrickszone.com/2017/05/29/80-graphs-from-58-new-2017-papers-invalidate-claims-of-unpreceden… […]
[…] 80 Graphs From 58 New (2017) Papers Invalidate Claims Of Unprecedented Global-Scale Modern Warming (NoTricksZone, May 29, 2017) […]
[…] substance of Delingpole’s claim comes from a post at something called “No Tricks Zone,” which aggregated 80 graphs that are only […]
Congratulations. This post (and Deller’s) has made Snopes.
http://www.snopes.com/scientific-papers-global-warming-myth/
On 6 June 2017, Breitbart News ran an article titled “‘Global Warming’ Is a Myth, Say 58 Scientific Papers in 2017”. This article, which is in essence merely a link to a post from a blog that goes by the name “No Tricks Zone” and some added musings on “grant-troughing scientists,” “huxter politicians,” “scaremongering green activists,” and “brainwashed mainstream media environmental correspondents,” claims that this ragtag collection of studies proves that the long-standing scientific consensus on climate change is nothing but a myth.
The blog post Breitbart linked to is a list of 80 graphs (so many graphs!) taken from 58 studies. The analysis of the findings presented by No Tricks Zone is crude, misinformed, and riddled with errors.
—–
They have some good points, e.g.:
This was the case for University of Washington PhD candidate Bradley Markle, whose paper (“Global Atmospheric Teleconnections During Dansgaard-Oeschger Events”) was also included in the No Tricks Zone:
My study, and almost all I saw mentioned on the blog post, are studies of climate change in the past. My study investigates connections between different parts of the climate system during climate events that happened over 10,000 years ago. Studying climate change in the past can provide context for recent climate change. However, my study in no way investigates or tries to attribute the causes of recent climate change. It does not deal with human influences on climate at all.
Similar fault as “Thinking port” fakers linked below:
You trust an ex-prostitute outlet Snopes ? Snopes is an archetype of fake news, at least half of their rulings are politically driven false claims, the prostitute that works now as a presstitute… And so more and more they cry “fake news” at others, in order to obscure – such as “thief calls: catch the thief”…
That Snopes claims something, you can be at least 50% sure it is false and just opposite. (Or is it only about their claims that make it to the opposing media?)
—–
So the scientist says, that “I say NOTHING about Climate change being of human origin”. Well. Neither do others.
As an independent climate scientist, I am happy to see most charts here:
There IS a Climate Change ongoing now.
There ALWAYS is a Climate change ongoing, since there is nothing stable about the climate, and never was…
The current climate change is in no way unexceptional, is still very far from harmful, and is absolutely not caused by CO2, since:
CO2 levels depend on temperature (oceans releasing CO2 with it’s solubility depending on temperature),
but 1000x stronger green-house effect has WATER, the changing structure of clouds. Change of proportion of Cirrus clouds has very profound effect on temperature, that is far above and beyond of any possible effect of CO2.
It is a pitty, that ISCCP cloud structure datasets are poisoned with unreal “fixes“, that completely preclude studying long-term changes (like a step and completely unreal almost 2°C increase in middle-cloud temperature just at september 2001). It is a pitty, that SST dataset is poisoned with similar unreal “fix” of step increase at 1998, but they at least explain, that ratio of buoys and ships changes over time, with satelite measurements scarce, and buoy measures real surface temperature but ship stirrs waters, so their measurements differ and need to be “adjusted” for computing… (Or was it so strong el-Nino that it’s effects are permanent?)
Since I believe the climate change is mostly attributed to higher amount of cirrus-type clouds (letting Solar radiation down but not letting reflected IR radiation out – surely you know which days and nights are most warm… And nights on Sahara are very cold, because there is no water in the air…) It partially depends on antropogenic factors, on air travel *trails and possibly on industry dust polution (not CO2)… But politicians would be much more reluctant to reduce air travelling, wont’t they ?
Higher levels of CO2 are very profitable for plants and twice or three times current levels of CO2 would be extremely profitable for feeding the hungry regions of the planet. CO2 is the Green-allowing gas, in the best possible sense of that “Green”, it’s like a manna for all plants…
http://www.naturalnews.com/2017-06-06-trump-just-saved-america-from-the-disastrous-paris-climate-treaty-fraud.html
Otherwise if there is such a huge change in peer-reviewed papers, it does not show the climate changed, or that the scientists changed opinion, but it shows, that peer-review process has changed it’s position, allowing some former dissidents’ voices be heard…
The Paris climate deal was hugest ever financial tunnel : the industry of developed countries shall pay $100 billion a year, so that africans and inds can buy from _jews_ building of “clean energy” power plants… Guess, who will profit most ? And why such a huge crying, that Trump said: “No!” ?
(The exploit patterns are changing. (((They))) now devised, that exploiting developing countries in Africa is much less profitable, than _helping_ developing countries in Africa and elsewhere based on Euro-American expense, the infrastructure will be built for the needy, while money will pour to the right coffers… Do you dare to oppose? All those bought by the profiteers, and the unfledged youth deformed by bought academia, will aim to destroy you! )
[…] warming” is a myth — so say 80 graphs from 58 peer-reviewed scientific papers published in 2017. In other words, the so-called “Consensus” on global warming is a massive […]
[…] The scientific “consensus” about the global warming lie, cited by the left without hesitation, is not science and President Trump was right in pulling the U.S. out of the Paris Climate agreement, an agreement based on the pretense that the massive lie of global warming is true. […]
[…] substance of Delingpole’s claim comes from a post at something called “No Tricks Zone,” which aggregated 80 graphs that are only […]
Steve someone asked if CO2 isn’t causing GW what is.
The warming that ended the LIA is of unknown origin and didn’t follow a rise in CO2…..CO2 rise lagged that warming by 800years.
THIS insignificant warming can’t just be attributed to CO2 when it’s not known what precipitated THAT warming except that it WASN’T CO2.
In the 1970s the world was obsessing about the ‘coming ice age’…some of the very same scientists who want us terrified of CAGW…but that soon disappeared when a completely natural event called the Great Pacific Climate Shift occurred and world temperature had an upward step shift.
Then another upward step shift occurred with the all-natural uber-El Nino of 1998…and world temperature was on a new plateau.
Since then pretty much nothing….so the trend is TINY and all natural.
Any warming from CO2 is logarithmic and of diminishing effect is it not?
Hence the ongoing PAUSE admitted by IPCC AR5…along with many other AR5 admissions that are now ignored …like no increase in strength or frequency of severe weather events….no ACCELERATION in SLR.
[…] Delingpole утверждают, происходит от должности за то, что называется «без фокусов зону», которая […]
[…] Kenneth Richards writing in NoTricksZone points out that in the last two years there have been almost 120 peer reviewed papers (58 this year already) invalidating the theory. That could be the start point for new editorial line from The Australian. God knows, it’s not going to come from any other mainstream media outlet. […]
[…] The scientific “consensus” about the global warming lie, cited by the left without hesitation, is not science and President Trump was right in pulling the U.S. out of the Paris Climate agreement, an agreement based on the pretense that the massive lie of global warming is true. https://notrickszone.com/2017/05/29/80-graphs-from-58-new-2017-papers-invalidate-claims-of-unpreceden… […]
[…] Scientists Increasingly Discarding “Hockey Stick” Temperature Graphs “[W]hen it comes to disentangling natural variability from anthropogenically affected variability the vast majority of the instrumental record may be biased.” – Büntgen et al., 2017 […]
[…] 80 Graphs From 58 New (2017) Papers Invalidate Claims Of Unprecedented Global-Scale Modern Warming […]
[…] Of course, they will ignore them because they don’t actually care about real science. They only care about the bogus science that has been repeatedly debunked and proven to be intentionally falsified, because they are cultists. From No Trick Zone: […]
[…] Of course, they will ignore them because they don’t actually care about real science. They only care about the bogus science that has been repeatedly debunked and proven to be intentionally falsified, because they are cultists. From No Trick Zone: […]
[…] 58 New Papers Invalidate Claims Of Unprecedented Modern Global Warming […]
[…] as collated by Kenneth Richard at No Tricks Zone, are just some of the charts to prove […]
[…] News cita in particolare 80 grafici ricavati dai paper, tutti raccolti e vagamente commentati in un post sul blog No Tricks Zone, da sempre schierato contro l’esistenza del riscaldamento […]
[…] News cita in particolare 80 grafici ricavati dai paper, tutti raccolti e vagamente commentati in un post sul blog No Tricks Zone, da sempre schierato contro l’esistenza del riscaldamento […]
[…] an article citing over 80 graphs from scientific papers published in 2017 — and another 55 graphs from 2016 — established that modern “global” […]
[…] – 80 Graphs From 58 New (2017) Papers Invalidate Claims Of Unprecedented Global-Scale Modern Warming […]
Many of them contradict each other (if you compare in more detail, when it warmed or cooled, how much)…
At first glance it seems, that third of them are Chinese, with “Li et al” most prominent contributing 10% of all your charts here ?
“At first glance it seems, that third of them are Chinese, with ‘Li et al’ most prominent contributing 10% of all your charts here ?”
Do you believe scientists from China are somehow inferior, P.A. Semi? If you had written “it seems that a third of the scientists represented are Arabs” — do you think that would somehow undermine their results?
Many scientists nowadays just fulfil and serve the agenda of their pay-masters.
Which is why british MetOffice scientists (and some Americans) have produced their “hockey-stick” fraud, in the interest of their grant sponsors.
Then if there is some strong trend visible in different data, you have to ask, if this differing group of scientists, as presented here, may serve a different agenda of different grant pay-masters, and how much it may influence their “results”…
It may be an agenda-serving result, and it also may be a fair result, but it’s usually better to be suspicious initially.
Which is why I singled out Chinese influence in this, because it seemed a significant trend in this group-dataset…
Also, if you take thousand scientific works with wide spread of conflicting results – which is what “science” looks like today, and then select a 10% of them best serving your interests and confirming your predetermined aim, as was usually done by peer-review in journals, and may have been done by this article’s author too — possibly, then you also may create a “trend” out of a chaos…
(Otherwise, my position is, that there is a “climate change”, which is nothing unusual, because there always is a “climate change”, and that CO2 makes no harm at all, even it is highly beneficial for the nature… And I’ve got no financial or political interest in this conjecture.)