Software engineering expert Tony Heller has put out a video blasting recent claims made in report by U.S. government officials.
In the video below Heller, who also operates the influential Real Climate Science site here, says that there is an “extremely high probability of fraud by government climate scientists” regarding the recently “exclusively obtained” report written by scientists from 13 U.S. government agencies. Heller in fact says:
The level of fraud in this report is really quite sickening.”
Heller says some of the details in the report are “wildly fraudulent” and claims “the amount of misinformation in this report is overwhelming.”
Heller demonstrates how the report’s authors manipulated their conclusions through the careful selection of dataset start dates, depending on what they were trying to show.
The expert software engineer and data analyst shows how heat records in fact have been decreasing over the past 100 years in the USA – contradicting U.S. government scientists’ claims. In fact extreme heat and extreme cold overall have been declining since the 1930s, as the following chart shows:
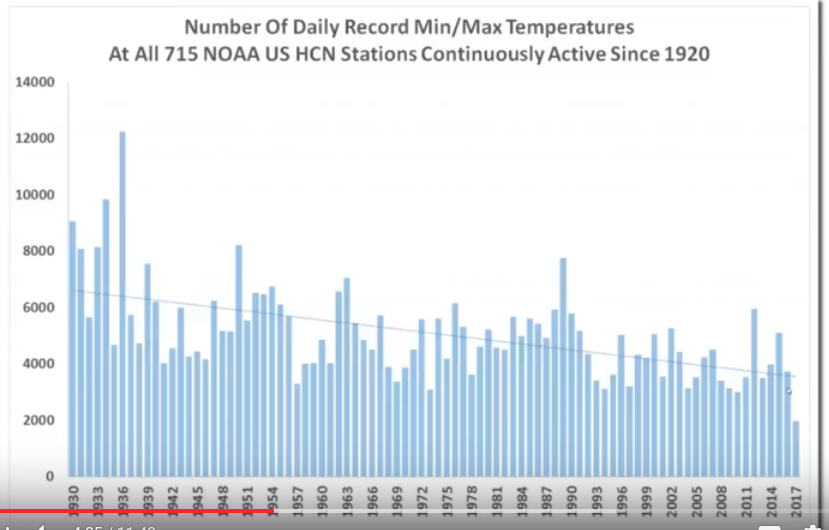
U.S. cold and heat extremes have been declining. Image cropped here.
As garbage as garbage science can get
Tony Heller then explains how the scientists made a huge mathematical mistake, one that is tantamount to the computer programming error of dividing by zero. That error, Heller says, horrendously distorted the chart the scientists used to show how the ratio of heat records to cold records was growing. The question that now arises is: Was this an honest mistake, or done intentionally with malicious intent to deceive the public? Heller called the results produced by the methodology “meaningless garbage“….”I don’t know how you can do science any worse than this garbage.”
U.S. hot days have been falling for 100 years
Another false point made by the report was the claim that the number of days with 90°F temperatures and higher was going to increase in the future “with very high confidence“. Yet Heller presents a chart showing that the number of hot days has in fact been trending significantly downward over the past century:
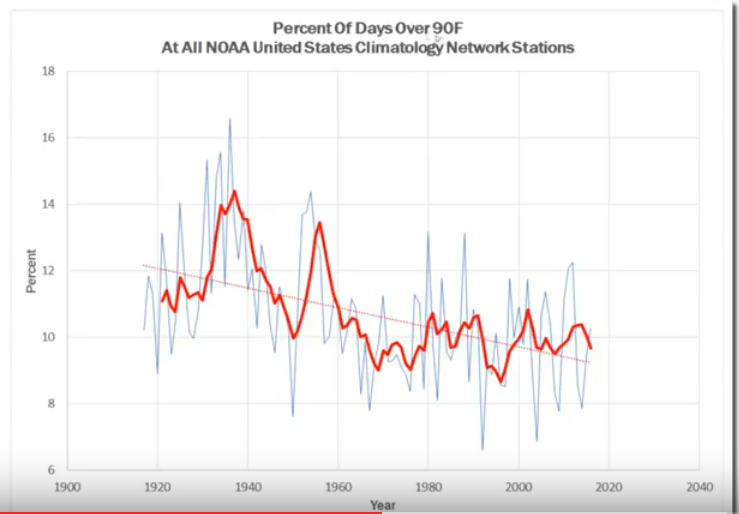
U.S. percentage of hot days have been declining! Image cropped here.
The U.S. government report also claims that temperatures have risen by 1.0°C since 1901. But that claim too is false, as Heller shows with the following chart:
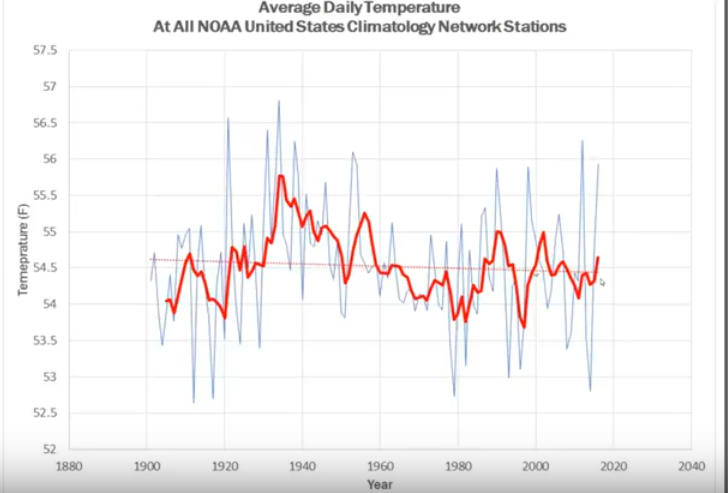
U.S. average daily temperature has been declining! Image cropped here.
The fearless Heller says of the government scientists: “Their claim is completely fraudulent. The United States is not warming. It is actually cooling.”
Heller then shows a newspaper clipping from 1989 (8:00), where the NOAA itself stated that there had not been any warming over the past 100 years. This was once again confirmed by NASA’s James Hansen in 1999. So how can it be possibly be warming just 18 years later?
Heller explains that since 1989 NASA’s James Hansen and current NASA GISS director Gavin Schmidt have put the historical data through a series of alterations in order to fabricate a warming trend.
Heller concludes that the latest, leaked government report is far from trustworthy:
Everything in this report is based on fake data, manipulated data, bad mathematics and general junk science.”
Heller suspects that the report was a purely politically motivated attempt to pressure President Donald Trump to change his position on the climate change issue.


And it’s all been happening in America, folks. Didn’t Stalin use these same kind of tactics? Unbelievable.
Flashback here: https://notrickszone.com/2016/07/25/software-expert-exposes-potential-nasa-climate-data-fraud-trend-completely-fake-and-manipulated/#sthash.pcJZyf22.dpbs
And let us recall what’s happening in Australia.
I started frequenting Tony Heller’s site when he was using the Pseudonym Steven Goddard. His site concentrates on exposing the adjustments and scientific fraud with occasional forays into other political issues and notable historic events. He uses an extensive cache of newspaper archives of newspaper demonstrate the lies we’re being told by the press and government officials now. He also provides the code and database sources so that those so inclined can do their own analysis of weather and climate data.
Some of his material has been used in congressional testimony and I suspect that in the future more will be used. Thanks for giving him a shout out here. He has done all of the above on his own dime and has been at it for a long time and deserves the recognition.
[…] Expert Software Engineer Calls Level Of Fraud In Leaked US Gov Climate Report “Sickening” […]
Fraud is what many climate scientists do.
Why the surprise?
[…] Hat -tip to Pierre Gosselin; who has more at NoTricksZone. […]
With ‘climate science™’ it has always been ‘they who pays the piper calls the tune’.
[…] Source: Expert Software Engineer Calls Level Of Fraud In Leaked US Gov Climate Report “Sickening” […]
[…] Source: Expert Software Engineer Calls Level Of Fraud In Leaked US Gov Climate Report “Sickening” […]
Rather than fraud, a better explanation is motivated reasoning. They believe their own anti-CO2 models so much (CO2 causes 90% of climate change) that they cannot imagine any other cause of surface temperature changes. So they change the past to match their models. As Javier says here: http://euanmearns.com/making-the-measurements-match-the-models-part-2-sea-surface-temperatures/
Mark, the cheaters jumped the shark long time ago. I agree that motivated reasoning is a common occurrence in human affairs but these people are not stupid despite saying some very stupid things at times.
By now they know very well they have a problem and their beliefs have nothing to do with it anymore. I’m sure you know that business modeling and forecasting is routinely used across all industries and it is being constantly updated as real data keeps coming in.
If instead of revising and updating the financial models the CEOs of banks and public companies used “motivated reasoning” and changed the reported past data to match their beliefs and expectations, they’d be all in jail.
Have you ever heard of Enron? Trust me, the executives were highly motivated but how in the world was their conduct not fraud?
More like it is just the ignorance of some experts.
For some of these ‘expert’ their motivated reasoning is politically, for some emotionally, and for some monetarily motivated, for some it is all three. With deranged ideas to ‘save the world’ (as rubbish an idea as it was back in 1970) by feathering their own nest with transitory fame, hubris, and some fortune. These same ‘experts’ believe it is their job to cajole and hector politicians into making disastrous decisions. Decisions that will do the least good for the majority, and the most good for the rich empowered minority, both now and for the foreseeable future.
It’s like you didn’t even watch the video.
I’m a big global warming skeptic, however pointing out that the number of record temperatures decreased over time proves nothing. The temperature records only go back 100 years or so and one would expect the number of records to decline even if there’s no trend, simply because the data set grows larger over time. Need to correct the graph for the decreasing probability.
A good point but the more salient point is that according to what the alarmist’s believe there should be more and more hot records occurring now. Something that clearly isn’t happening and which this chart demonstrates.
Actually the number of reporting surface USHCN stations in the US has been DECREASING markedly over the last 20 years.
Mark Roberts 12. August 2017 at 5:54 PM writes:
Another one who didn’t watch the video, …or didn’t understand it, …or worse yet, wants us to miss the point?
It is the climate “scientists” who are using the ratio of max/min temps to create a meaningless but scary graph to give the illusion that temps are rocketing up. Heller is pointing out what’s wrong with what they did, and you are critical of him? Seriously?
And yes, pointing out that the number of record lows decreased does prove that NASA’s using them to calculate anything is fraudulent.
So why do you imply that it’s Heller who is wrong, when he’s just saying essentially what you wrote – that it’s illegitimate to use those numbers to calculate what they do. Why are you trying to blame him for NASA’s fraudulent misuse of the data?
CLARIFICATION
That’s (record daily) max(record daily) min record temps that NASA is using, just so it’s clear that’s what I meant above.
So the argument of Tony Heller is “the data used is all fake and fake fake fake” (imagined in the voice of Donald Trump which the narrator of the video is annoyingly very close to)?
He even mentions that the climate mafia got to Mears from RSS, so he manipulated the data to also become fake.
Is that really all?
Or is your outrage based on him calling it fraudulent when you calculate a ratio from two time-series? Does he really claim that you can’t do that? Or is just that he dislikes how the graph looks? Why is it a problem that the ratio (A / B) can change and we don’t know (from the graph) if it was A or B or a combination of both that changed? Graphs like these just visualize how the ratio changed … nothing more, nothing less.
Anyway, did I mention that the “Trumpish” narrator voice is really annoying? They should use a different narrator, it was very hard to listen to this for over 11 minutes …
This is a great rebuttal. You are unable to follow Heller’s argument and you dislike his voice.
Did I mention this is a great rebuttal?
Sebastian, enters the “Twilight Zone” ………………….
Taking the position of a juror seeking to find the truth, I’m skeptical of all sides and deem none as the “keepers of the truth”. They’re are plenty of wackos on both sides.