Hurricane activity trend declines significantly over the past 65 years
Dr. Sebastian Lüning and Prof. Fritz Vahrenholt posted here yesterday results showing that hurricane activity has decreased over the past decades, despite all the hysteria we’ve been hearing from the usual suspects.
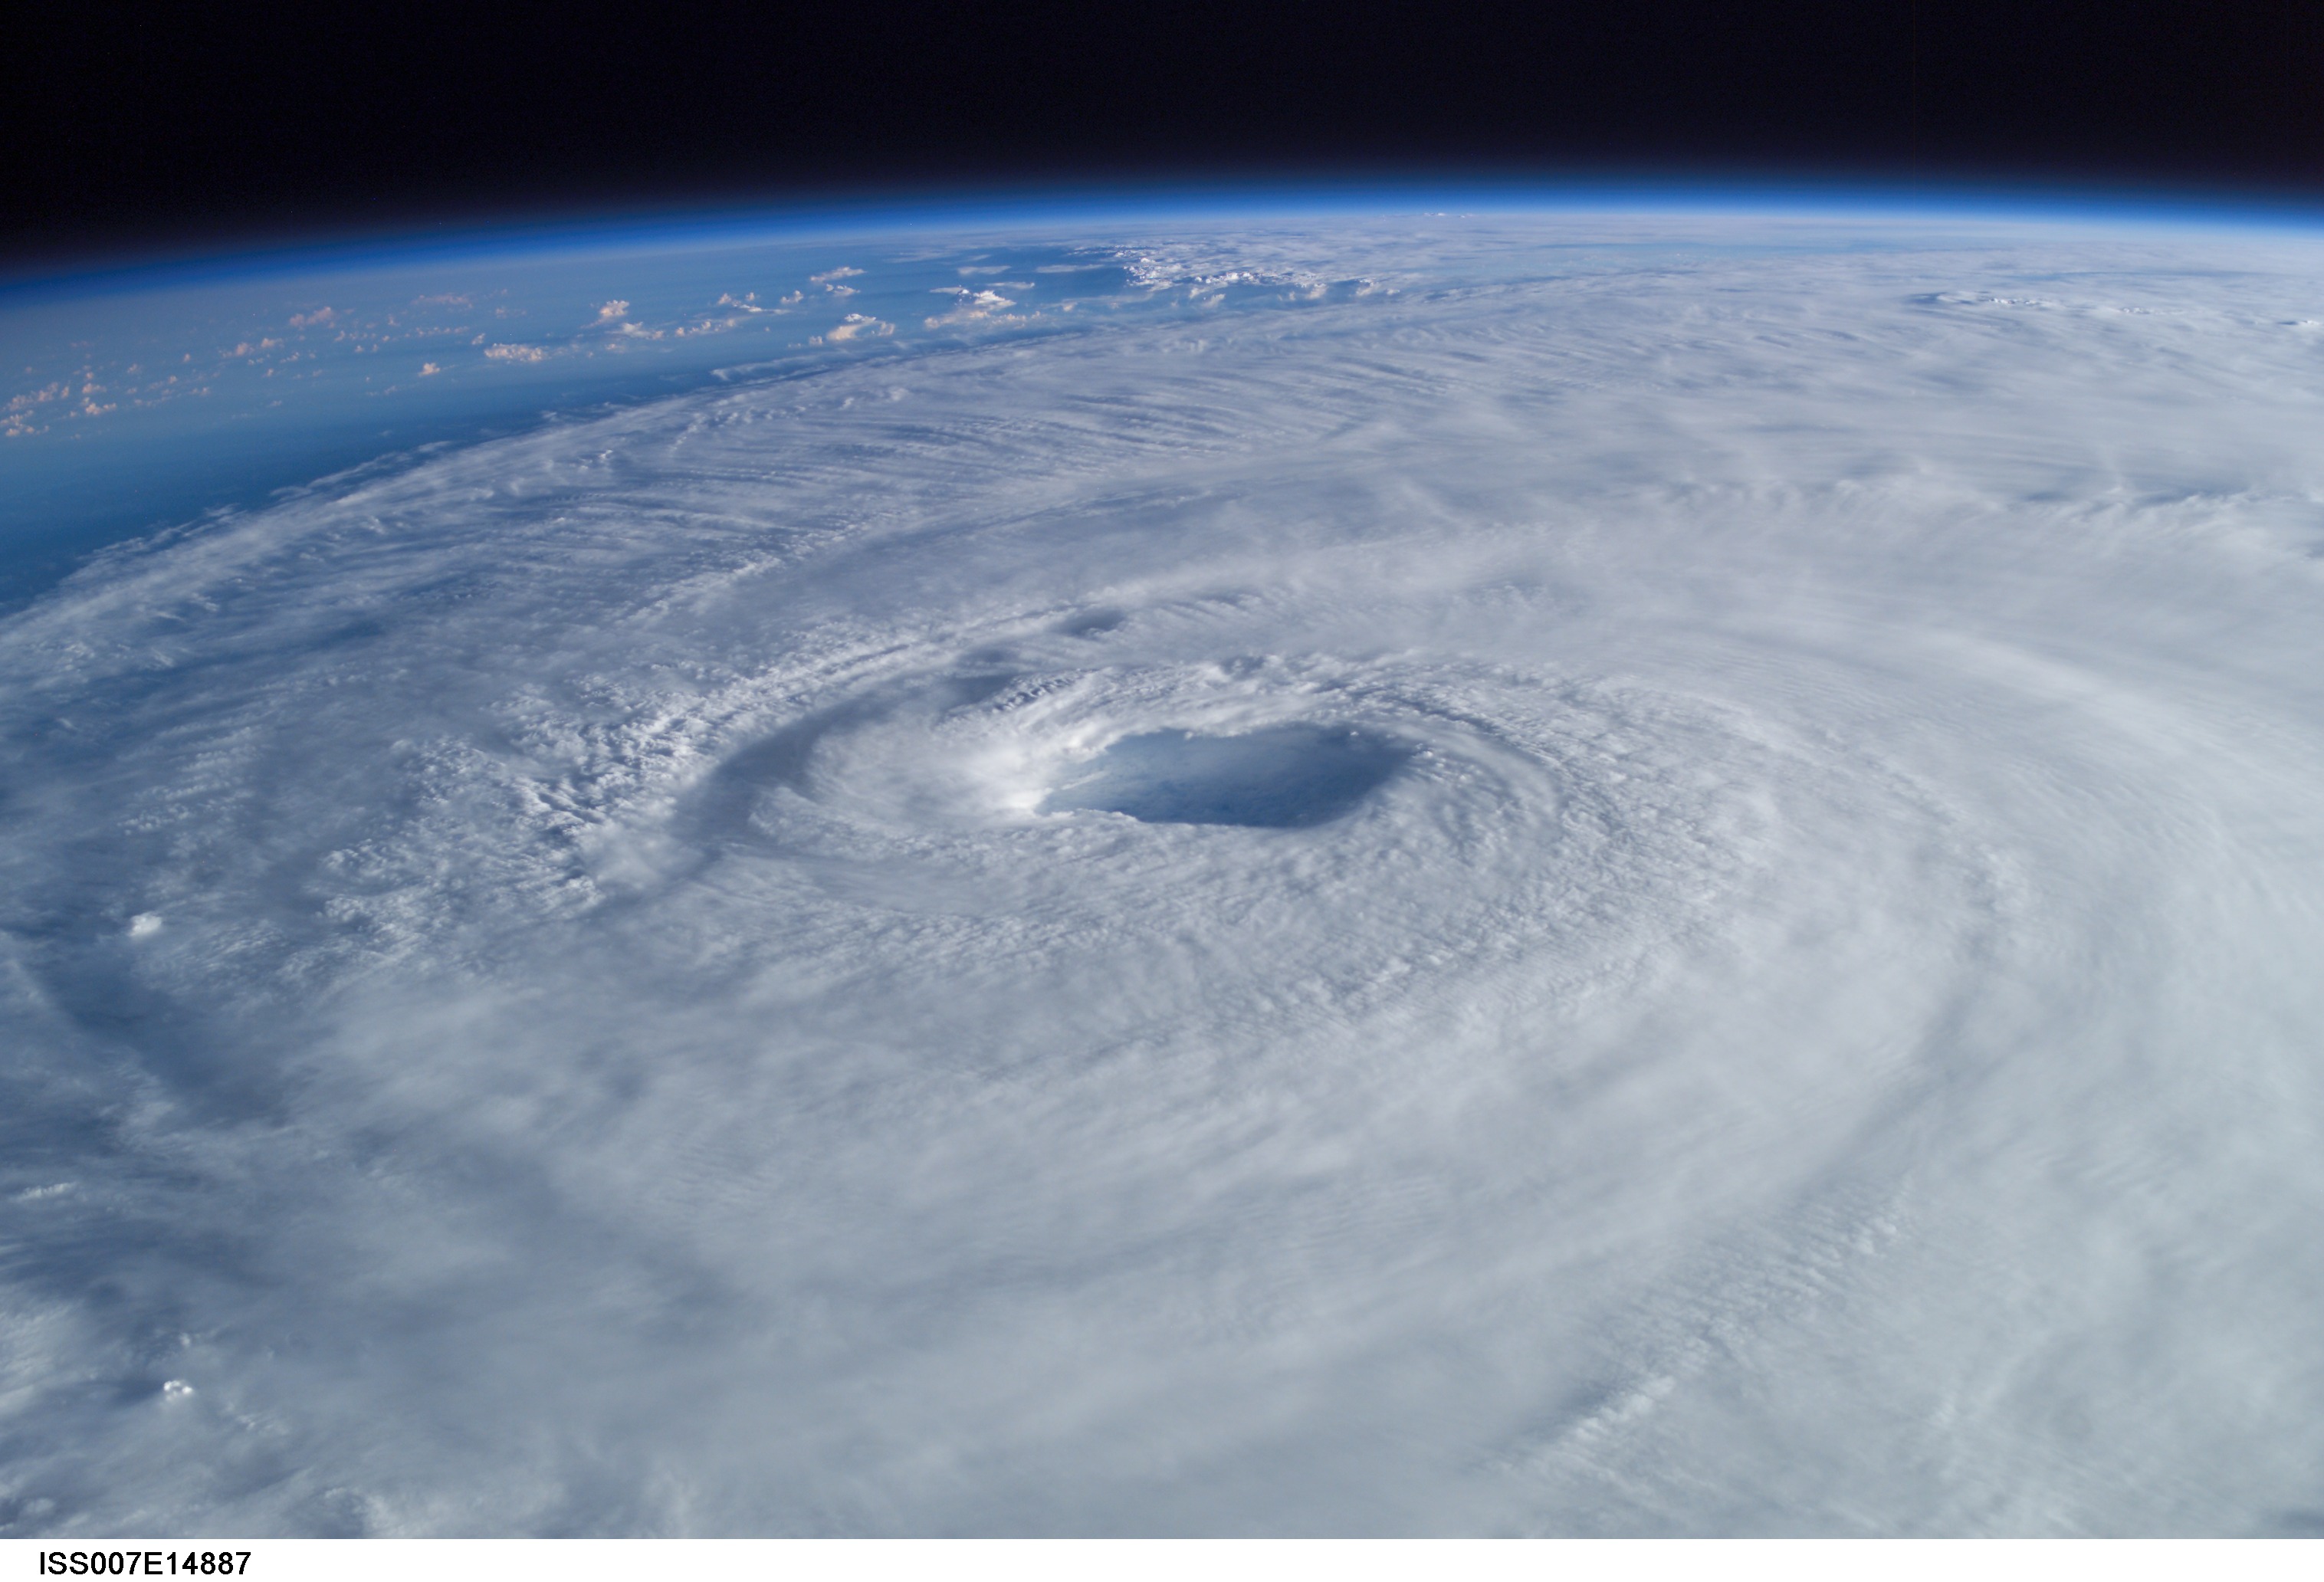
Data and studies show that Potsdam Institute thinly veiled claims that hurricanes are connected to man-made CO2 are spurious. Photo: Hurricane Isabel, NASA (public domain).
Taking a look at the recent literature, we find a paper authored by Ryan Truchelut and Erica Staehling appearing in the Geophysical Research Letters on December 8, 2017. They looked at the development of American hurricanes based on accumulated cyclone energy (ACE).
CO2 and hurricanes are not connected
The two authors found a statistically significant reduction in hurricane activity over the past 65 years. The relative inactivity of the past years (except for the very active 2017 season) was the most inactive phase of the examined time period. The abstract (emphasis added):
An Energetic Perspective on United States Tropical Cyclone Landfall Droughts
The extremely active 2017 Atlantic hurricane season concluded an extended period of quiescent continental United States tropical cyclone landfall activity that began in 2006, commonly referred to as the landfall drought. We introduce an extended climatology of U.S. tropical cyclone activity based on accumulated cyclone energy (ACE) and use this data set to investigate variability and trends in landfall activity. The drought years between 2006 and 2016 recorded an average value of total annual ACE over the U.S. that was less than 60% of the 1900–2017 average. Scaling this landfall activity metric by basin-wide activity reveals a statistically significant downward trend since 1950, with the percentage of total Atlantic ACE expended over the continental U.S. at a series minimum during the recent drought period.”
As CO2 in the atmosphere continuous to rise unabated, hurricane activity is decreasing. Obviously the two trends have little to do with each other.
Experts advise caution in assigning blame
Looking at the very clear body of facts, it is little wonder that the NOAA (via the Geophysical Fluid Dynamics Laboratory, GFDL) cautioned against linking the greenhouse gases and hurricanes in an official statement:
It is premature to conclude that human activities–and particularly greenhouse gas emissions that cause global warming–have already had a detectable impact on Atlantic hurricane or global tropical cyclone activity. That said, human activities may have already caused changes that are not yet detectable due to the small magnitude of the changes or observational limitations, or are not yet confidently modeled (e.g., aerosol effects on regional climate).”
Shrill in Potsdam
However in Germany, scientists scientists at the Potsdam Institute for Climate Impact Research (PIK) don’t accept the facts for what they are. For them t’s more important to be shrill and to set off alarms. For example in the wake of Hurricane Harvey, PIK scientist Anders Levermann gave a radio interview at Radio Eins on September 1, 2017. He said that when it’s warmer, more water vapour ends up in the air, and thus more rain and a hurricane with a flooding catastrophe in Houston. It’s just that simple, right? Then later in the interview Levermann added a “maybe”.
What Levermann committed here of course was an irresponsible misleading of the listeners. The clear decrease in hurricanes over the past 65 years contradicts his extraordinarily simplistic claims.
Poor urban planning
At the BBC the journalists were more serious with the subject, and did not stay silent regarding the complexity that is involved as it is known that a vast number of factors are at play. In Houston, for example, a blocking pattern was at work and thus led to a heavy rainfall over an urban area for a protracted time period. Anyone who claims that a part of the disaster can be attributed to man is unrealistically simplifying the system and ought to know better.
The answer to the question as to what the problem in Houston was is provided by an article by the BBC:
Climate change did not make people build along a vulnerable coastline so the disaster itself is our choice and is not linked to climate change.”
On ARD German public television, they too have gotten much more careful. TV meteorologist Donald Bäcker flatly dismissed the shot from the hip from Potsdam.
Forecasts thanks to link to AMO
In June, 2017, at the start of the hurricane season, Judith Curry and CFAN published a prognosis for the hurricane season. Here they anticpated an above-average hurricane activity season. They were right. If they are successful next year as well, then we’ll have an important forecasting method that will be of great use for society.
Other prognoses: Hurricanes have a certain development. Satellite photos allow the creation of storms to be tracked. But not all West African hurricane babies make it across the Atlantic and reach America. Tel Aviv University developed a model that allows us to determine which storms pose a risk and which ones will die off. Read the press release here.
Over the mid-term, hurricane activity can be forecast quite well because it is closely coupled to the Atlantic Multidecadfal Osciallation (AMO) ocean cycle, which has a periodicity of about 60 years. Michel de Rougemont reminds us in an essay appearing at WUWT.
Building in flood-prone areas is negligent
In Germany’s leading political daily FAZ of August 31, 2017, Winand von Petersdorff pointed out an important damage factor related to Hurricane Harvey. It was a man-made disaster in the sense that many homes and buildings had been built in classic flood-prone areas.
The enormous costs were foremost caused by the fact that the booming Houston metropolitan area, with its 6.5 million inhabitants, permitted building in grand style in areas where flooding and high water would occur.”


“The enormous costs were foremost caused by the fact that the booming Houston metropolitan area, with its 6.5 million inhabitants, permitted building in grand style in areas where flooding and high water would occur.”
City of Houston was founded on MARSHY ground:
“Houston was founded on August 30, 1836 by brothers Augustus Chapman Allen and John Kirby Allen on land near the banks of Buffalo Bayou. The city was incorporated on June 5, 1837 and named after then President of the Republic of Texas, former General Sam Houston, who with the Texas Militia had avenged the Alamo and routed the Mexican Army under Santa Anna at the Battle of San Jacinto. The battle took place 25 miles (40 km) east of where the city was established.”
and,
“The city of Houston has a total area of 601.7 square miles (1,558.4 km²). Most of Houston is located on the Gulf coastal plain, and its vegetation is classified as temperate grassland and forest. Much of the city was built on forested land, marshes, swamp, or prairie, which are all still visible in surrounding areas.
The flatness of the local terrain, when combined with urban sprawl, has made flooding a recurring problem for the city. Downtown stands about 50 feet (15 m) above sea level, and the highest point in far northwest Houston is about 125 feet (38 m) in elevation. The city once relied on groundwater for its needs, but land subsidence forced the city to turn to ground-level water sources such as Lake Houston and Lake Conroe.
Houston has four major bayous passing through the city. Buffalo Bayou runs through downtown and the Houston Ship Channel, and has three tributaries: White Oak Bayou, which runs through the Heights neighborhood and towards downtown; Braes Bayou, which runs along the Texas Medical Center; and Sims Bayou, which runs through the south of Houston and downtown Houston. The ship channel continues past Galveston and into the Gulf of Mexico.”
http://www.newworldencyclopedia.org/entry/Houston,_Texas
This was a developing man made problem going back over 170 years.
No doubt the usual suspects will have a different and totally illogical viewpoint.
[…] Read more at No Tricks Zone […]
Hi Kenneth,
Please to stick to the topic and demonstrate that you understand the physics of greenhouse gases and by that be able to understand why the Holmes‘ theory is insufficient for explaining the temperature slope in the lower atmosphere. Therefore, send the questions to my explanations to make progress and solve your dilemma.
If you want to do an experiment do it – in my view it’s physical nonsense as one can derive from already proven laws of physics. Note, physics is deriving mathematical laws by doing empirical experiments. Therefore, old-fashioned, hstorical or stupid experiments are not very promising to investigate something new.
„According to the GHE theory, pre-industrial CO2 levels (200-280 ppm) provide 7.2 K of Earth’s 33 K greenhouse effect. …“
I guess, you mixed there something up. Show the original scientific paper or book where you found this number, it does not quantify what you relate it to.
“Finally, explain why it is that the dramatic rise in anthropogenic CO2 emissions during 1992-2014 had no warming impact on the overall greenhouse effect during that period, as the greenhouse effect went on hiatus during that time…”
That is turning back to your own dilemma. If you state that nature is as simple as you want then nature will likely surprise you! Your dilemma is caused by your postulate that CO2 increase and global warming is significantly correlated on each time scale. This is wrong, so you fall into your own trap. Have you ever heard about “signal to noise ratio”?
Awaiting your feedback on your questions regarding my explanations why Holmes’ paper is a hoax. Keep questions to other topics for later, otherwise you will get confused.
Hmm. The topic (not of this article, of course) is the capacity of the CO2 greenhouse effect to explain the planet’s temperatures. As you should know, 93% of the heat in the Earth system is contained in the oceans. The atmosphere holds just 1% of the heat energy. Therefore, for CO2 to be the controlling agent of the planet’s temperature, as the proponents of AGW presume, we should have physical measurements from a controlled scientific experiment that show how much a real-world heat change that a parts per million (0.000001) CO2 concentration change exerts on water temperatures. So do you have these figures available? How much, for example, does a body of water heat up (or cool down) when the CO2 concentration in the air above it is raised by 10 ppm? Do you know? If so, please cite this information that is essential for validation of the CO2-controls-the-ocean-temps hypothesis. After all, it’s “settled” science. Right?
Great. So if it’s already been proven how much water warms and cools by increasing or decreasing the CO2 concentration in the air above it, please cite this proven, real-world physical evidence from a controlled, empirical experiment. Let’s see the results, the physical measurements. How much does water cool when CO2 concentrations are reduced by 10 ppm (-0.00001)? What are those results?
CO2: 7.2 K of Earth’s 33 K greenhouse effect
Wow. This is actually a rather commonly cited value. See Krauter, 2007 and Boersema and Reijnders, 2009, for example. It’s why the IPCC indicates that water vapor’s contribution to the natural 33 K greenhouse effect is approximately “two to three times greater” than CO2.
Kramm et al., 2017
“This temperature value is subtracted from the globally averaged near-surface temperature of about ⟨Tns⟩ ≅ 288 K resulting in ⟨Tns⟩ − Te ≅ 33 K. This temperature difference commonly serves to quantify the atmospheric effect. The temperature difference is said to be bridged by optically active gaseous gases, namely H2O (20.6 K); CO2 (7.2 K); N2O (1.4 K);CH4 (0.8 K); O3 (2.4 K); NH3+freons+NO2+CCl4+O2+N2NH3+freons+NO2+CCl4+O2+N2 (0.8 K) (e.g. Kondratyev and Moskalenko, 1984).”
Now that you’ve learned the alleged CO2 contribution to the Earth’s greenhouse effect, please answer the question. The “settled science” says that (a) the “natural” (i.e., preindustrial, 280 ppm and less) CO2 concentration contributes 7.2 K to the 33 K greenhouse effect by itself (without feeedbacks), and that (b) when the Earth’s atmospheric CO2 concentration is “unnaturally” doubled to 560 ppm (from its “natural” 280 ppm state) by itself (without feedbacks), the radiative forcing (3.7 W m-2) and temperature increase associated with that doubling is just 1.16 K. So why are the effects of CO2 increase so much more muted and diminished the higher one goes above the “natural” threshold? Why would that 1.16 K value be so concerning? This should be an easy question for you to answer. After all, it’s “basic physics”. Empirical. Based on real-world observational evidence. Right, Markus?
So can I take it you don’t agree with Song et al. (2016) that there was a hiatus in the greenhouse effect’s influence on temperature during 1992-2014? Why are they wrong?
Markus, here’s the thing. I have no stakes in the Holmes paper. He could be wholly wrong about CO2 having a negligible effect on planetary temperatures. It has generated hundreds of responses here and elsewhere, and discussions about the massive uncertainties in planetary physics are healthy. That’s how I look at it, anyway. But then, if Holmes is wrong about CO2’s negligible impact, shouldn’t someone like you, a genuine non-denier, be able to empirically support the position you have taken with regard to CO2’s robust effect upon the Earth’s temperature? Shouldn’t you be able to cite the physical measurements from real-world experiments that verify how much heating/cooling is elicited in water bodies by changes in atmospheric CO2 concentration?
I take the position that the stated values for the CO2 greenhouse effect for planet Earth is worth questioning rather than just accepting as fact. Especially since there are so many problems (like the ones introduced above, among others) with assuming that CO2 concentration changes determine net water temperature changes on Earth. You obviously don’t think it’s worth questioning. To you, it’s truth. That’s why you call people a religious term – denier – if they dare question your version of truth.
Let’s see if you’ll continue to avoid answering these most basic of questions about the CO2 greenhouse effect.