‘Strong Influence Of Solar Activity’ On 1850s-2014
Ocean Temperatures, ‘Small Contribution From CO2’
According to the United Nations Intergovernmental Panel on Climate Change (UN-IPCC) and computer modeling, the Sun’s role in modern-era climate change checks in at somewhere slightly above nothing.
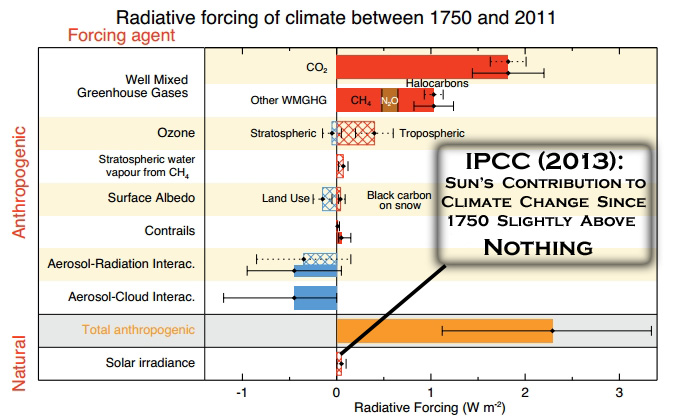
Image Source: IPCC AR5 (2013)
And yet it is increasingly evident that more and more scientists across the globe do not take the position that the Sun’s influence on climate change is negligible.
In 2016 and 2017, for example, over 250 papers (see here and here) linking the Sun to climate changes were published in scientific journals.
Less than 2 months into 2018, the scientific literature is still teeming with supporting evidence that says when it comes to climate changes, to a substantial degree, It’s The Sun. The list for 2018 has already swelled to 20, keeping pace with 2016 and 2017.
2 New (2018) Papers Indicate Modern Climate Still In A ‘Colder Stage’, Modulated By Solar Activity, ENSO
3 New (2018) Papers Link Modern Warming And Past Cooling Periods To High, Low Solar Activity
Below are 3 more new papers added to the list within the last week. Each paper documents a fundamental role for solar activity in modern climate changes.
Hemispheric Temperature Trends ‘Show Strong Relationship With TSI’ And ‘Poor Relation With Global CO2’
“The major harmonics centred at ~ 63 ± 5, 22 ± 2, and 10 ± 1 years are similar to solar periodicities and hence may represent solar forcing, while the components peaking at around 7.6, 6.3, 5.2, 4.7, and 4.2 years apparently falls in the frequency bands of El-Nino-Southern Oscillations linked to the oceanic internal processes. Our analyses also suggest evidence for the amplitude modulation of ~ 9–11 and ~ 21–22 year solar cycles, respectively, by 104 and 163 years in northern and southern hemispheric SST data [during 1850 to 2014].”
“The absence of the above periodic oscillations in CO2 fails to suggest its role on observed inter-hemispheric SST difference. The cross-plot analysis also revealed strong influence of solar activity on linear trend of NH- and SH-SST [Northern/Southern Hemisphere Sea Surface Temperature] in addition to small contribution from CO2. Our study concludes that (1) the long-term trends in northern and southern hemispheric SST variability show considerable synchronicity with cyclic warming and cooling phases and (2) the difference in cyclic forcing and non-linear modulations stemming from solar variability as a possible source of hemispheric SST differences. … The trend components of NH-SST and SH-SST show strong relationship with TSI [Total Solar Irradiance] trend variations and poor in relation with global CO2 trend.”
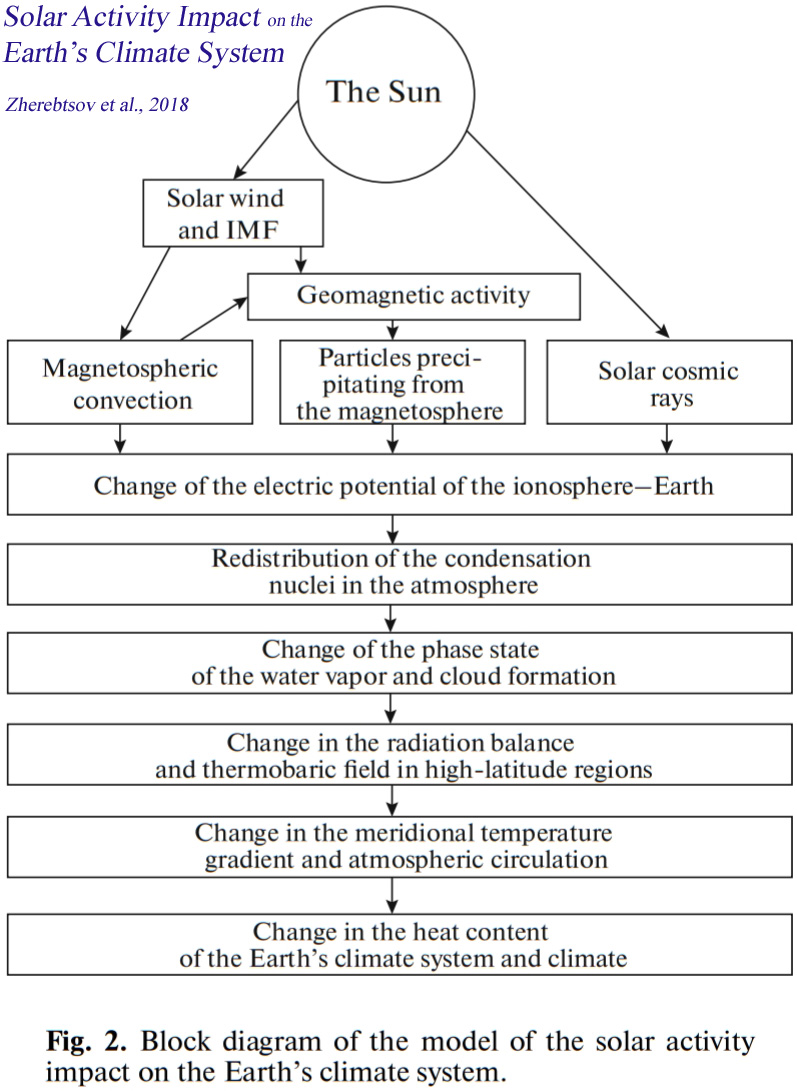
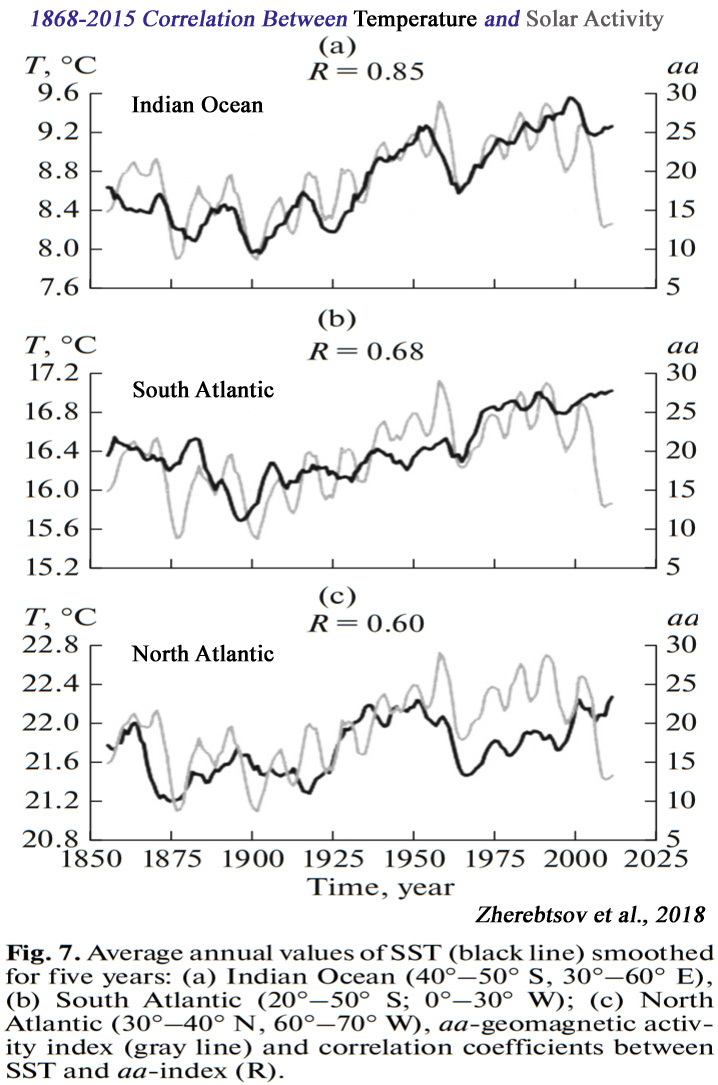
Changes In World Ocean Temperature During 1854-2015 ‘Reflect…Solar And Geomagnetic Activity’
“Based on a complex analysis of hydrometeorological data, it has been shown that changes in the temperature of the troposphere and the World Ocean reflect a response both to individual helio-geophysical perturbations and to long-term changes (1854–2015) of solar and geomagnetic activity. It is established that the climatic response to the influence of solar and geomagnetic activity is characterized by considerable spatio-temporal heterogeneity, is of a regional nature, and depends on the general circulation of the atmosphere. The largest contribution of solar activity to the global climate changes was observed in the period 1910–1943. … For the last 1000 years, the world climate experienced changes that quite closely corresponded to variations in SA [solar activity]: in the 11th–13th centuries, when SA was high, there was a warm period (the “medieval climatic optimum”), and two distinct temperature drops in the small ice age (16th–17th centuries) correspond to the Maunder and Spörer minima.
“A general rise in the level of SA [solar activity] occurred after the completion of the Maunder minimum [1700s], and the world climate became warmer during most of this period. … It is shown that solar activity contributed significantly to the global climate change, mainly during the first warming in the 20th century (1910–1943). This period is characterized by a significant positive trend in the level of geomagnetic activity that was maximal over the entire considered time interval (1868–2015) and coincided with enhanced meridional heat transfer in the North Atlantic.”
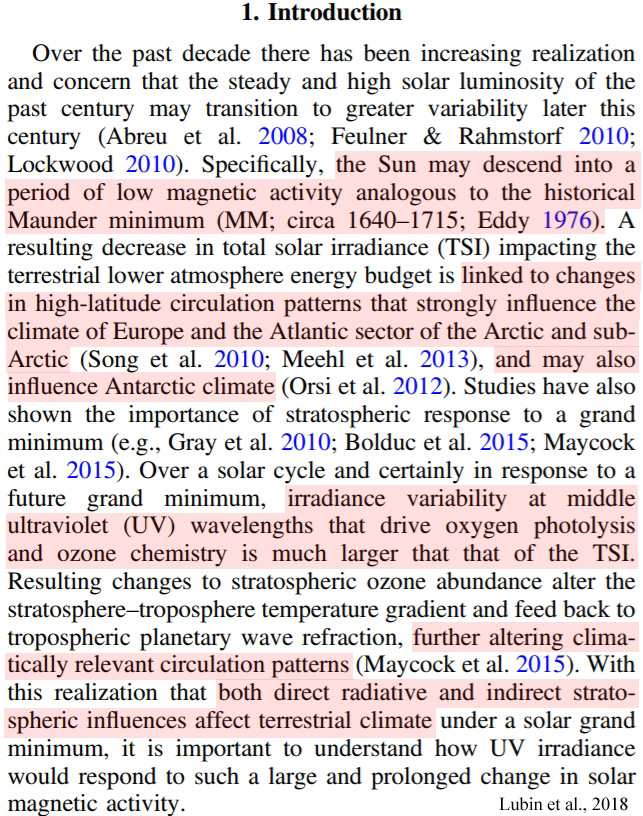
The Sun May Descend Into ‘Maunder Minimum’ Levels This Century, ‘Strongly Influenc[ing]’ The Climate
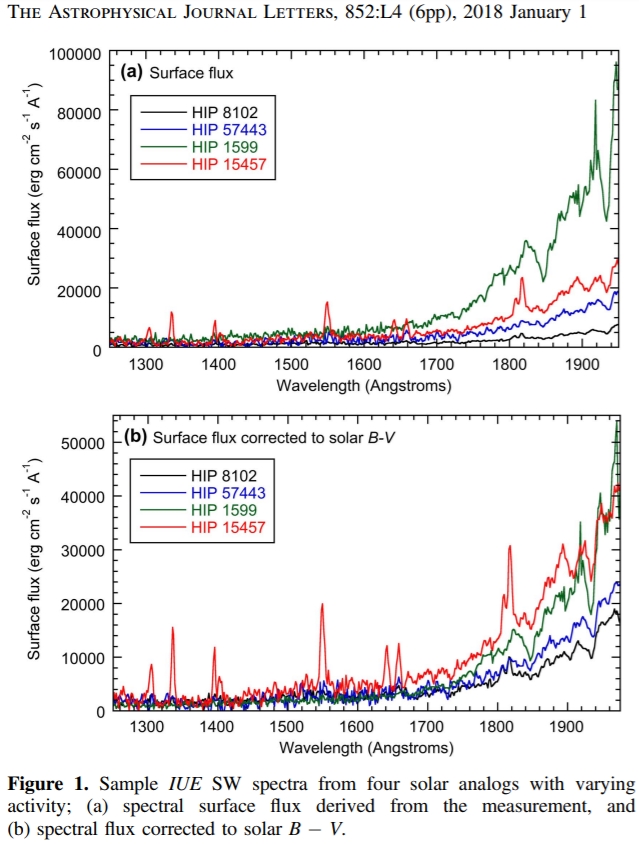
“Over the past decade there has been increasing realization and concern that the steady and high solar luminosity of the past century [20th] may transition to greater variability later this century (Abreu et al. 2008; Feulner & Rahmstorf 2010; Lockwood 2010). Specifically, the Sun may descend into a period of low magnetic activity analogous to the historical Maunder minimum (MM; circa 1640–1715; Eddy 1976). A resulting decrease in total solar irradiance (TSI) impacting the terrestrial lower atmosphere energy budget is linked to changes in high-latitude circulation patterns that strongly influence the climate of Europe and the Atlantic sector of the Arctic and subArctic (Song et al. 2010; Meehl et al. 2013), and may also influence Antarctic climate (Orsi et al. 2012). Studies have also shown the importance of stratospheric response to a grand minimum (e.g., Gray et al. 2010; Bolduc et al. 2015; Maycock et al. 2015).”
“Over a solar cycle and certainly in response to a future grand minimum, irradiance variability at middle ultraviolet (UV) wavelengths that drive oxygen photolysis and ozone chemistry is much larger that that of the TSI. Resulting changes to stratospheric ozone abundance alter the stratosphere–troposphere temperature gradient and feed back to tropospheric planetary wave refraction, further altering climatically relevant circulation patterns (Maycock et al. 2015). With this realization that both direct radiative and indirect stratospheric influences affect terrestrial climate under a solar grand minimum, it is important to understand how UV irradiance would respond to such a large and prolonged change in solar magnetic activity.”


One question I usually ask when the topic of the Maunder Minimum or the LIA appears is —
“How much ice was there at the North Pole when the LIA event started?”
I suspect that there was little, as now the polar vortex was probably not over the pole but wandering around the periphery of it, cooling the lands of Canada, Eurasia, and the oceans thereabouts. Ron Clutz has some interesting ideas about these kind of events over at https://rclutz.wordpress.com/2018/02/20/volatile-vortex/comment-page-1/ .
Temperature doesn’t seem to correlate with sun activity starting in the 1950s/60s:
http://woodfortrees.org/plot/gistemp/mean:12/plot/gistemp/mean:132/plot/pmod/offset:-1362/mean:132/plot/sidc-ssn/scale:0.005/mean:132/offset:-1.5/from:1870
Unfortunately none of those papers is open access, so we can’t check out what they really say and have to trust your interpretation. That’s a bit weak to call it “steamrolling”.
GISS doesn’t correlate to any sort of reality.
Even you must know its a load of mal-adjusted rubbish.
So why use it, it just makes your comment even more EMPTY.
DNFTT
Then take skeptic’s favorite UAH6:
http://woodfortrees.org/plot/uah6/mean:12/plot/uah6/mean:132/plot/pmod/offset:-1362/mean:132/plot/sidc-ssn/scale:0.005/mean:132/offset:-1.5/from:1870
Or RSS v3:
http://woodfortrees.org/plot/rss/mean:12/plot/rss/mean:132/plot/pmod/offset:-1362/mean:132/plot/sidc-ssn/scale:0.005/mean:132/offset:-1.5/from:1870
You’re using the PMOD, which is model based and changes the data (adjustments), rather than the ACRIM, which is based on direct observations/data. The PMOD models a downturn in solar forcing after the 1980s, whereas the ACRIM does not. That’s why the IPCC (and people like you) prefer the PMOD to the ACRIM…it helps the case of explaining temperatures with CO2.
Willson, 2014
“The ACRIM TSI composite is data driven. It uses ACRIM1, ACRIM2, ACRIM3 and Nimbus7/ERB satellite results published by the experiments’ science teams and the highest cadence and quality ACRIM Gap database, the Nimbus7/ERB, to bridge the ACRIM Gap. The PMOD TSI composite, using results from the Nimbus7ERB, SMM/ACRIM1, UARS/ACRIM 2 and SOHO/ VIRGO experiments, is model driven. It conforms TSI results to a solar-proxy model by modifying published ERB and ACRIM results and choosing the sparse, less precise ERBS/ERBE results as the basis for bridging the ACRIM Gap (Frohlich and Lean 1998).
[T]he ACRIM TSI composite and its +0.037 %/decade TSI trend during solar cycles 21–23 [1980s-2000s] is the most likely correct representation of the extant satellite TSI database. … The upward trend during solar cycles 21–23 coincides with the sustained rise in the global mean temperature anomaly during the last two decades of the 20th century.”
—
Van Geel and Ziegler, 2013
https://www.researchgate.net/profile/Bas_Geel/publication/275459414_IPCC_Underestimates_the_Sun's_Role_in_Climate_Change/links/5543916f0cf234bdb21bd1e8.pdf
“Hoyt and Schatten (1997) combined with the ACRIM data and suggest that TSI increased between 1900 and 2000 by about 3 Wm-2 and was subject to major fluctuations in 1950-1980 (Scafetta, 2013; Scafetta, 2007). … Assessment of the Sun’s role in climate change depends largely on which model is adopted for the evolution of TSI during the last 100 years (Scafetta and West, 2007; Scafetta, 2009; Scafetta, 2013). The ACRIM TSI satellite composite shows that during the last 30 years TSI averaged at 1361 Wm-2, varied during solar cycles 21 to 23 by about 0.9 Wm-2, had increased by 0.45 Wm-2 during cycle 21 to 22 [1980s to 2000s] to decline again during cycle 23 and the current cycle 24 (Scafetta and Willson, 2009). By contrast, the PMOD TSI satellite composite suggests for the last 30 years an average TSI of 1366, varying between 1365.2 and 1367.0 Wm-2 that declined steadily since 1980 by 0.3 Wm-2
[T]he cyclical temperature increase of the 20th century coincided with the buildup and culmination of the Grand Solar Maximum that commenced in 1924 and ended in 2008.”
Oh that’s cute, everything confirming the consensus is incorrect because it confirms it.
http://rspa.royalsocietypublishing.org/content/464/2094/1367#
Lookwood/Fröhlich 2008
It’s not convincing to prefer ACRIM over PMOD. But anyway, the difference is minimal and seems to come from the “gap”. That small difference doesn’t go far as temperatures are concerned.
P.S.: Have you seen the new BP energy outlook yet? 14% Wind&Solar by 2040 in their standard scenario. Their expected growth seems to be a lot smaller than reality in the last years though, so this is likely also to small a figure.
https://www.carbonbrief.org/analysis-bp-significantly-upgrades-global-outlook-wind-solar-again
No, didn’t write that. The ACRIM is data-driven. The PMOD is model-driven. The gap shows an increase in TSI using the data used for the ACRIM.
http://people.duke.edu/~ns2002/pdf/2008GL036307.pdf
The ACRIM-gap (1989.5–1991.75) continuity dilemma for satellite TSI observations is resolved by bridging the satellite TSI monitoring gap between ACRIM1 and ACRIM2 results with TSI derived from Krivova et al.’s (2007) proxy model based on variations of the surface distribution of solar magnetic flux. ‘Mixed’ versions of ACRIM and PMOD TSI composites are constructed with their composites’ original values except for the ACRIM gap, where Krivova modeled TSI is used to connect ACRIM1 and ACRIM2 results. Both ‘mixed’ composites demonstrate a significant TSI increase of 0.033%/decade between the solar activity minima of 1986 and 1996, comparable to the 0.037 % found in the ACRIM composite. The finding supports the contention of Willson (1997) that the ERBS/ERBE results are flawed by uncorrected degradation during the ACRIM gap and refutes the Nimbus7/ERB ACRIM gap adjustment Fro¨hlich and Lean (1998) employed in constructing the PMOD.
—
http://www.fel.duke.edu/~scafetta/pdf/2005GL023849.pdf
PMOD has been widely used in geophysical research. According to this composite, TSI has been almost stationary (0.009%/decade trend of the 21– 23 solar minima [Willson and Mordvinov, 2003]) and by adopting it, or the equivalent TSI proxy reconstruction by Lean et al. [1995], some researchers and the IPCC [Intergovernmental Panel on Climate Change (IPCC), 2001; Hansen et al., 2002] deduced that the Sun has not contributed to the observed global surface warming of the past decades. Consequently, the global surface warming of DT1980 – 2002 = 0.40 ± 0.04K from 1980 to 2002 shown in Figure 2 could only be induced, directly or indirectly, by anthropogenic added green house gas (GHG) climate forcing. Contrariwise, ACRIM presents a significant upward trend (+0.047%/decade trend of the minima) during solar cycles 21– 23 (1980 –2002) [Willson and Mordvinov, 2003].
We’ll see what happens in the mid-2040s. Both still sit at around 1% consumption share despite decades of exponential growth. I don’t expect that share to change much given the expected growth in demand for energy worldwide.
Exactly, but that is incompatible with GCR data. From the paper I linked to:
I highly recommend reading that paper. I wouldn’t be so confident that the shift during the “gap” is correct in the ACRIM composite.
Again, with exponential growth half of all installations have happened in the last x years. For a growth rate of 10% that’s 7.27 years, for 15% it’s 4.96 years, for 20% it’s 3.80 years. Even if it would still be around 1%, it would have been 0.5% around 5 years ago, 0.25% 10 years ago, and 0.015625% 30 years ago. And it would be 2% in 5 years, 4% in 10 years, 16% in 20 years and 64% in 30 years.
Growth_Fossil(A) + Growth_WindSolar(B) = Growth_Both(C)Even a math illiterate should be able to recognize that with B growing faster than A (percentage year over year) the share of B will increase and the share of A will decrease. That is true even if the absolute value of A’s increase will we bigger initially than B’s increase per year.
I guess we’ll have to agree to disagree that model-based adjusted data (PMOD) are more accurate than the directly obtained data found in the ACRIM.
This is completely flawed because, once again, you are assuming that fossil fuels (and other non wind/solar energy sources) will not grow right along with the growth in wind and solar, undercutting the growth in share due to the gigantic rise in global energy demand (as impoverished countries all over the world gain access to energy). This seems to be a perpetual statistical blindspot for you. Wind and solar combined will not make up 64% of energy consumption share in the mid-2040s. There isn’t enough land mass to cover the Earth with wind turbines to make that happen. Countries across the world will prefer reliable, perpetually-available energy to intermittent energy. Also, there is a threshold to how much pristine land will acceptably be ruined by covering the Earth with wind turbines. It’s reaching that point already now.
You are completely right on this one. That assumes nothing else would grow alongside.
They will likely not grow any faster than first world countries did. The BP outlook has the numbers for that … 1.3% growth in energy demand per year is smaller than 7.0% growth in wind/solar per year and thus the share of wind/solar will naturally increase even if you have something against it.
Renewables are projected to increase their share from 4% to 14% by 2040. Since the BP outlook attributes that nearly completely to the growth of wind and solar it is safe to say, they will be above 10% in the primary energy consumption metric and a quite bit higher in the final energy consumption.
Quick overview …
https://imgur.com/a/6wCLU
They expect slowing consumption growth, zero growth for coal, 0.5% for oil and 1.6% for gas. Nuclear 1.8%, Hydro 1.3%, Renewables (almost exclusively wind/solar) 7.0%
Of course, there is. There is also enough land mass to cover the Earth with solar panels. A 1 kWp panel would produce 2 MWh near the equator per year. We’d need roughly 70000 TWh to cover primary energy consumption with electricity from solar panels in 2040. So we need 35 billion 1 kWp panels in a desert. So if we calculate with 10 m² per 1 kWp panel we would need to cover an area of roughly 350000 km² with solar panels. That’s 592×592 km … I think we can handle that.
Wind turbines deliver roughly 6300 MWh per km², so we would need to cover 5.56 million km² with them. That’s 3.7% of the land mass and you could still use the land around wind turbines for other things like agriculture, or covering it with solar panels.
They will prefer cheap energy. Solar and wind power will inevitably be cheaper than fossil fuels.
You’ve seen nothing yet …
Lots of people have seen enough already and won’t accept more.
According to the same BP report you are extolling, fossil fuel energy consumption continues to rise, by about 20%, with no slow-down, through 2040. In other words, as I keep on telling you, wind and solar expansion will not even rise fast enough to offset the growth in fossil fuel consumption in the next 25 years.
There isn’t enough land mass to cover the Earth with wind turbines to make that happen.
No, there’s not. And it will ruin ecosystems and pristine landscapes.
No. People prefer energy that is readily available, reliable, and cheap. Wind is none of those.
It’s 18% to be precise and that is the ET scenario. The RE push scenario has fossil fuels not growing at all, the FT and EFT scenarios have them decreasing until 2040.
Of course, they won’t. In their ET scenario over the period from 2016 to 2040 renewables account for roughly 50% of the growth. Less closer to 2016, more closer to 2040.
And who’s to say that this year’s BP energy outlook won’t improve even more towards renewables in the next years? Like they have in the last years … https://imgur.com/a/ujCu8
After all they are only assuming a renewables growth rate of 7% year over year … that is pretty low compared to the last decades of growth (see https://imgur.com/a/6wCLU).
You are kidding, right? We can cover 5% of the surface with asphalt roads, but we can’t cover 4% with wind turbines and solar cells?
If you think so. I’ll guess someone has to remind of that when you’ll read news of cheap, reliable wind/solar energy power plants being built at ever increasing rates in the coming decades.
Asphalt can be used at night and on cloudy days, 24/7/365.
You’re trolling. And again your chosen vocational ignorance is glaring.
Pokemon also saw exponential growth in the 1990s – doesn’t mean it keeps going that way. People do come around to their senses, eventually.
Of course, it doesn’t mean that … that would mean renewables would eventually provide 200% then 400% of the total consumption, which is nonsense. It will most likely be an S-curve like with every switch to a new technology and we are just at the beginning. Early adopters had their fun, now it’s the early majority, then comes the late majority and it ends with the laggards who will eventually switch from their horses to a car, from their CRT monitor to a TFT or from their cassette player to an MP3 player.
That’s what “coming to their senses” means.
Again you are purposely IGNORING the huge technical and economic obstacles of wind/solar energy. Pull. your. head. out.
And seb’s FANTASIES on renewables continue…
…totally against any sort of science, engineering, economic or environmental common sense.
“now it’s the early majority”
ROFLMAO
Wind and solar were 4% or whatever of total German energy use last year.
Seb’s grasp of maths is yet again exposes as being TOTALLY BOGUS !!
hint, seb.. 4% (or whatever tiny % it was) IS NOT A MAJORITY..
Next you will be using your 1 + 1 = 3 analogy again as your comedy back-up for your ABJECT INABILITY to support even the most basic fallacy of your mind-numbed AGW religion.
So you think the growth will just stop at one point because the engineers don’t know how to further increase installations anymore? Where is that limit? 50-60% renewables like Mr. Sinn claims? It’s really weird that climate denier/skeptics only see the here and now and can’t extrapolate into the future, no matter the metric …
AndyG55,
just keep your thoughts for yourself if you have no idea what that means. It would make less of a fool out of you.
Poor seb, yet again shows.
HE HASN’T GOT A CLUE. !!
Maths and comprehension are beyond him.
He invents little phrases like “early majority”
….then gets all uppity when shown up as a FOOL, yet again.
So sad, So PATHETIC.
So seb. !!!
Northern Hemisphere Solar Activity and Climate Correlation
—
https://notrickszone.com/wp-content/uploads/2017/04/Soon-Connolly-2015-NH-Temps-and-TSI.jpg
—
https://notrickszone.com/wp-content/uploads/2017/11/TSI-20th-Century-Northern-Hemisphere-Schneider-2015.jpg
—
https://notrickszone.com/wp-content/uploads/2017/11/TSI-20th-Century-Northern-Hemisphere-Christiansen-Ljungqvist-2012.jpg
—
https://notrickszone.com/wp-content/uploads/2017/11/TSI-20th-Century-Northern-Hemisphere-Stoffel-2015.jpg
————————–
Southern Hemisphere Solar Activity & Climate Correlation
—
https://notrickszone.com/wp-content/uploads/2017/11/TSI-20th-Century-Antarctica-Schneider-2006.jpg
—
https://notrickszone.com/wp-content/uploads/2017/11/TSI-20th-Century-South-America-Patagonia-Elbert-2013.jpg
—
https://notrickszone.com/wp-content/uploads/2017/11/TSI-20th-Century-Andes-De-Jong-2016.jpg
—
https://notrickszone.com/wp-content/uploads/2017/11/TSI-20th-Century-Chile-de-Jong-2013.jpg
—
https://notrickszone.com/wp-content/uploads/2017/11/TSI-20th-Century-Indian-Ocean-Zinke-2016.jpg
—
These are not “interpretations”. These are exact quotes copied/pasted directly from the papers themselves. The 3rd one even shows an image of the copied text.
As I would assume most would understand by reading the introduction, the “steamrolling” refers to the volume of papers published since 2016 (275) supporting a strong Sun-Climate link, which is in stark contrast to the claims of negligible influence espoused by the IPCC and people like you.
So you are suggesting that they (IPCC) made the Sun’s influence very small out of thin air? Without support from science? Is that what you are saying?
Also there is this:
https://phys.org/news/2017-03-sun-impact-climate-quantified.html
Even if we get a 2 W/m² decrease of TSI in the next decade, that equals a solar forcing decrease by 0.5 W/m² averages over the whole planet. That’s not a lot of change …
Only IDIOTS think that TSI is the only solar change.
Well said!
“Even if we get a 2 W/m² decrease of TSI in the next decade, that equals a solar forcing decrease by 0.5 W/m² averages over…. blahhh. “
Great to see seb yet again displaying his abject ignorance.
Poor little trollette doesn’t realise that it is changes over the tropics that matter, and that averaging over the whole of Earth’s surface when the effect of increased TSI is not linear is the absolute depths of mathematical ignorance.
To be expected from seb, though.
This will never resonate. His reasoning comes from SkS (and he forgot to multiply by 0.7). Skeptical Science just can’t be wrong. FOUR. HIROSHIMA. BOMBS. PER. SECOND.
https://skepticalscience.com/print.php?r=263
“The solar radiative forcing is TSI in Watts per square meter (W-m-2) divided by 4 to account for spherical geometry, and multiplied by 0.7 to account for planetary albedo”
Yep K,
Its quite BIZARRE what passes as “science” at the cartoonist’s little propaganda site.
But there are STILL those so NIL-educated as to fall for it.
Ehrm, we are comparing the solar forcing to other forcings, aren’t we? Regarding heat content you have to average over the whole surface. But fine, let’s say only tropics matter, so we divide by 2 instead of 4 and apply it to only half the planet? How does that change the amount of energy? Or do you think a reduction by 2 W/m² in the tropics is far more powerful than a constant forcing planet wide from GHGs?
I guess we’ll see. Unfortunately all things climate take a long time to manifest. See you in 50-100 years then, when the last skeptic will have realized it’s not the Sun.
You need to read more about the variety mechanisms through which the sun impacts climate. Your lack of knowledge here appears to be glaring. Ignorance is okay…I don’t have a problem with that because everyone suffers from it to varying degrees. Willful ignorance, however, is not something I’m prepared to accept.
Surprise me (you or Kenneth) and explain in your own words (not quotes) how the Sun impacts climate. What are the relevant feedbacks, how much warming/cooling from a 1 W/m² change in TSI?
From what I’ve read the Sun approaching a minimum will cause a temperature change (the average) of at most 0.5°C. In the same timespan CO2 forcing will most likely compensate for it and temperature will still increase. And then the Sun’s output increases again … what happens then? Back to even higher temperatures.
Will skeptics in 20-30 years still be thinking that it’s the Sun? Only the craziest ones …
The problem is that you don’t want to know. You only want to dismiss and ram pinhead into the sand.
Again, you are grossly lacking in the knowledge of the various mechanisms through which the sun impacts our climate (much more than TSI). Read up on it! (and put aside your vocational willful ignorance).
“a constant forcing planet wide from GHGs?”
ROFLMAO!
Still the UNPROVEN anti-science BS, all the time, seb, all you have is this mindless FALLACY.
There is absolutely no empirical data supporting enhanced atmospheric CO2 warming oceans, atmosphere or anything
You are in an ANTI-SCIENCE FANTASY CULT, seb
Nothing more.
And your comment above show that you STILL haven’t got a clue. !!
“What are the relevant feedbacks, how much warming/cooling from a 1 W/m² change in TSI?”
As mentioned above, only an IGNORANT, NIL-EDUCATED IDIOT “believes” that TSI is the only variable of the Sun.
You obviously haven’t read or comprehended anything in the last few years…
Way TOO MUCH NEGATIVE KNOWLEDGE to overcome.
You are the absolute definition of WILFUL IGNORANCE !!
Problem is that he seems to have made climate science ignorance his chosen vocation in his life. Even though the science is merely at its infancy, he thinks (is convinced) it’s done and settled. That tells you everything.
I doubt you know much about it. No answer is also an answer, right? So you guys can only give vague replies that I am ignoring the influence the Sun has on our climate. So what changes do we have to expect from a 0.073% change (1 W/m²) in solar output? Is solar activity and temperature linked linearly? 288 K = 1365 W/m², so 1 W/m² equals 0.21°C? Is it different? What is the function connection solar output to surface temperature? You guys claim you know and I don’t … so please, enlighten me 😉
What is wrong with 4 a-bombs per second? Do you disagree with the math? My reasoning comes from not blindly believing in anything that could explain away the greenhouse effect no matter how far-fetched and impossible it is. I am a bit skeptical about anything you come up with and/or support.
And seb keep digging deeper and deeper into his ignorance.
There is no bottom to that whole. !!
You have no reasoning, just brain-hosed mantra belief.
hint: TSI is NOT the only solar variable.
You have had the chance to enlighten yourself many times, but your deeply brain-hosed ANTI-KNOWLEDGE gets in the way.
“That’s a bit weak to call it “steamrolling”.”
What is REALLLY weak, or actually non-existent, is any empirical proof of warming from enhanced atmospheric CO2.
From http://www.geocraft.com/WVFossils/PageMill_Images/image277.gif
CO2 control of global temperature is not evident. The late Carboniferous to Early Permian time (315 mya — 270 mya) is the only time period in the last 600 million years when both atmospheric CO2 and temperatures were as low as they are today (Quaternary Period ).
Indeed looking at the gradual rise from the effects of the LIA, everything looks very normal, very NATURAL. https://rclutz.files.wordpress.com/2018/01/giss-anntemps2017.png No CO2 effect visible so far!
The argument for CO2 controlling global temperature is a sham. The evidence does not stack-up.
The lower atmosphere temperature is mainly controlled by the solar cycle’s effect on convection and the oceans, all else (barring effects of large volcanoes and meteors), is negligible.
Nature rules the atmosphere not humans.
Geocraft – another of my favorites, Tom.
Here’s a gif of his I’ve used before, along with that paleo temp/CO2 graphic you used. What science says about the “recent” (last 18,000 years) warming.
http://www.geocraft.com/WVFossils/PageMill_Images/anim_glac.gif
Yup, it has warmed. And a good thing, too!
Also note the period when CO2 was highest. It was the Cambrian, when all current animal life forms (phyla) suddenly appear for the first time in the fossil record. And they tell us high CO2 is bad for life, and that if we don’t believe it that we are ant-science??? !!!
They have no shame!
Thank-you yonason (from my cell phone),
Yes history tell the only real story about CO2 not affecting the global temperature. It’s not done it before, it’s not happening now! All the expensive ‘science’ currently being done is (IMO) just cover for larger political ambitions and always has been.
And before anyone says it, no I don’t believe in a conspiracy.
I believe in vainglorious politicians putting their ambitions before doing what is right. I believe politically useful and greedy people running the misinformation about climate, like the hubristic scientists pushing the idea to make money and fame for themselves. All done for political ends, nothing more. I believe these fallible people have led so many astray.
Yup.
Power, prestige, wealth, frail human nature… No need to invoke a conspiracy when human arrogance, greed and stupidity can explain it.
Never attribute to malice that which is adequately explained by stupidity
I don’t think you are evil …
In your case.. BOTH.
Dream on …
https://www.nature.com/articles/nature10915
“Global warming preceded by increasing carbon dioxide concentrations during the last deglaciation” – Shakun 2012, cited by 563
During the last deglaciation (14,700 to 14,500 years ago, also called the Meltwater Pulse), Northern Hemisphere temperatures rose by 4 to 5 degrees C (and Greenland rose by 12 degrees C) within a span of a few decades, and sea levels rose at rates of about 5 meters per century. CO2 levels didn’t change during this time. Changing CO2 concentrations did not precede the temperature change and sea level rise.
Ivanovic et al., 2017
http://onlinelibrary.wiley.com/doi/10.1002/2016GL071849/full
“During the Last Glacial Maximum 26–19 thousand years ago (ka), a vast ice sheet stretched over North America (Clark et al., 2009). In subsequent millennia, as climate warmed and this ice sheet decayed, large volumes of meltwater flooded to the oceans (Tarasov and Peltier, 2006; Wickert, 2016). This period, known as the “last deglaciation,” included episodes of abrupt climate change, such as the Bølling warming [~14.7–14.5 ka], when Northern Hemisphere temperatures increased by 4–5°C in just a few decades (Lea et al., 2003; Buizert et al., 2014), coinciding with a 12–22 m sea level rise in less than 340 years [3.5 to 6.5 meters to per century] (Meltwater Pulse 1a (MWP1a)) (Deschamps et al., 2012).”
That paper has already been shown to be rubbish. http://www.sciencebits.com/Shakun_in_Nature
The Shakun paper is bad because of his omissions and his data sampling is absurd quality, here are THREE expose’s of that horrid paper:
A reply to Shakun et al – Dr. Munchausen Explains Science By Proxy
https://wattsupwiththat.com/2012/04/06/a-reply-shakun-et-al-dr-munchausen-explains-science-by-proxy/
Shakun Redux: Master tricksed us! I told you he was tricksy!
https://wattsupwiththat.com/2012/04/07/shakun-redux-master-tricksed-us-i-told-you-he-was-tricksy/
Plus two more From DR. Easterbrook:
Did Shakun et al. really prove that CO2 preceded late glacial warming? [Part 1]
https://wattsupwiththat.com/2012/04/08/did-shakun-et-al-really-prove-that-co2-precede-late-glacial-warming-part-1/
More fatal flaws in the Shakun et al. Nature paper claiming that CO2 preceded late glacial warming [Part 2]
https://wattsupwiththat.com/2012/04/18/more-fatal-flaws-in-the-shakun-et-al-nature-paper-claiming-that-co2-preceded-late-glacial-warming-part-2/
Ooops forgot the third one:
Shakun The Last, I Hope
https://wattsupwiththat.com/2012/04/11/shakun-the-last-i-hope/
You didn’t actually read the Shakun paper, right? Here is a link without a paywall
Huh, you trust models now? Anyway that paper is mainly about the cooling caused by the melt of the North American ice saddle. That is also visible in Figure 2 of the Shakun paper. That paper is completely compatible with the Shakun paper.
<blockquoteThat paper has already been shown to be rubbish. http://www.sciencebits.com/Shakun_in_Nature
Sure, if you think that is a good source for climate science related stuff. If read his “rebuttal” and while it is true that it could be SH warming causing NH warming without any effect from CO2, why is the CO2 concentration then rising together with the SH warming, preceding NH/global warming?
Anyway, it’s a cosmic ray cloud religion follower and a source for “Die Kalte Sonne” … no thank you, can’t be trusted (see, I can do that too, just dismissing science authors on grounds of not liking what they write).
YOU were the one who posted the Shakun paper, which was long exposed as being junk.
I posted several links that shows in DETAIL why it is a bad paper, and easy to see for yourself since Eschenbauch used Shakun’s own paper to show it’s serious problems.
It is clear that you didn’t read any of the WUWT links at all.
Here is a section in link two, you never saw that ALONE destroys the paper:
“Today I was thinking about that single record that they used for the CO2 changes. I got to wondering what other ice core CO2 records might show about the change in CO2. So I went and downloaded every ice core CO2 record that I could find that covered the time period 26,000 BC to modern times. I found a number of ice core records that cover the period.
Then I collated all of them in Excel, saved them as a CSV file, opened the file in R, and plotted every ice core CO2 record that covered the record from 26,000 BC up to the present. I standardized them over the same period covered by the Shakun2012 CO2 data. There was excellent agreement between the Shakun2012 data and the ice core records I had downloaded … but there was also a surprise.”
Figure 2 shows the surprise …
(Chart in the link)
“Dang, I didn’t expect that rise in CO2 that started about 6,000 BC. I do love climate science, it always surprises me … but the big surprise was not what the ice core records showed. It was what the Shakun2012 authors didn’t show.
I’m sure you can see just what those bad-boy scientists have done. Look how they have cut the modern end of the ice core CO2 record short, right at the time when CO2 started to rise again …”
CO2 went UP a lot for a long time while Temperature went down in the SAME time frame.
Meanwhile in first link, it was shown that Shakun didn’t establish that CO2 leads temperature. He plotted all of the proxy data from the paper to state that it doesn’t support his claim because it is a mess:
“Next comes the part that the authors of these multi-proxy studies seem to have generally ignored. This is to look at each and every one of these proxy records and think about what they seem to mean. I’ll look at them sixteen at a time. Figure 3 shows the first sixteen of the Shakun2012 proxies.”
“Discussion
The variety in the shapes of these graphs is quite surprising. Yes, they’re all vaguely alike … but that’s about all.
The main curiosity about these, other than the wide variety of amounts of warming, is the different timing of the warming. In some proxies it starts in 25,000 BC, in others it starts in 15,000 BC. Sometimes the warming peaks as early as 14,000 BC, and sometimes around 5,000 BC or later. Sometimes the warming continues right up to the present.
The problem becomes evident when we plot all of these 80 standardized proxies together. Figure 9 shows all of the standardized temperature traces.”
Now, there’s plenty of things of interest in there. It’s clear that there is warming since the last ice age. The median value for the warming is 4.3°C, although the range is quite wide.
But if you want to make the claim that CO2 precedes the warming?
I fear that this set of proxies is perfectly useless for that. How on earth could you claim anything about the timing of the warming from this group of proxies? It’s all over the map.”
It is clear you didn’t read the first three links at all.
Warmists used to tap that red thumb paper that contradicts gobs of papers showing the opposite to what Shakun claims, but except for a few like you, they stopped after they were shown it was junk paper.
You need to spend more time reading counterpoints in detail.
I see that Sebastian ignores this from Kenneth,
“During the last deglaciation (14,700 to 14,500 years ago, also called the Meltwater Pulse), Northern Hemisphere temperatures rose by 4 to 5 degrees C (and Greenland rose by 12 degrees C) within a span of a few decades, and sea levels rose at rates of about 5 meters per century. CO2 levels didn’t change during this time. Changing CO2 concentrations did not precede the temperature change and sea level rise.”
Also warmists in general seem to ignore this too:
Are Modern Temperatures “Unprecedented”? Greenland Ice Core Research Finds They’re Not Even Close, U.S. Climate Agency
http://c3headlines.typepad.com/.a/6a010536b58035970c01287656565a970c-pi
http://www.c3headlines.com/2009/12/are-modern-temperatures-unprecedented-us-govt-greenland-ice-core-research-finds-theyre-not-even-clos.html
CO2 hardly change for 10,000 years while temperature change a lot.
Science related stuff.. which seb HAS to ignore.
There is NO empirical proof that enhanced atmospheric CO2 causes warming of oceans, atmosphere or anything.
All this other yapping is just a meaningless distraction.
the seb way.
http://www.sciencemag.org/content/318/5849/435.short
“Deep sea temperatures warmed by ~2C between 19 and 17 ka B.P., leading the rise in atmospheric CO2 and tropical surface ocean warming by ~1000 years.”
—
http://www.sciencemag.org/content/299/5613/1728.short
“The sequence of events during Termination III suggests that the CO2 increase lagged Antarctic deglacial warming by 800 ± 200 years and preceded the Northern Hemisphere deglaciation.”
—
http://www.sciencemag.org/content/283/5408/1712.short
“High-resolution records from Antarctic ice cores show that carbon dioxide concentrations increased by 80 to 100 parts per million by volume 600 ± 400 years after the warming of the last three deglaciations.”
—
http://science.sciencemag.org/content/291/5501/112.short
“The start of the CO2 increase thus lagged the start of the [temperature] increase by 800 ± 600 years.”
—
http://onlinelibrary.wiley.com/doi/10.1029/1999GL010960/pdf
“The lag was calculated for which the correlation coefficient of the CO2 record and the corresponding temperatures values reached a maximum. The simulation yields a [CO2] lag of (1200 ± 700) yr.”
—
http://nora.nerc.ac.uk/503652/1/Landais%20et%20al%202013%20-%20Step%20changes.pdf
“Antarctic temperature started increasing in phase around 136,000 years ago, but in a second phase of Termination II, from 130.5 to 129,000 years ago, the rise in atmospheric CO2 concentrations lagged that of Antarctic temperature unequivocally….At mid-slope, there is an unequivocal lead of δ15N [temperature] over CO2 of 900 ± 325 yr“.
—
http://www.clim-past.net/11/647/2015/cp-11-647-2015.pdf
“[N]o significant contribution of CO2 forcing to climatically caused heat flux and thus to the temperature increase during Pleistocene–Holocene warming. … The increase of carbon dioxide concentrations occurred 2–3 thousands of years later than the heat flux increase and synchronously with temperature response.”
—
http://www.clim-past.net/11/153/2015/cp-11-153-2015.pdf
“Recent works suggest that during the last deglaciation the rise in atmospheric CO2 lagged the onset of pan-Antarctic warming by approximately 0 to 400 years (Pedro et al., 2012; Parrenin et al., 2013″
—
http://www.clim-past.net/9/2507/2013/cp-9-2507-2013.html
“[A] 5,000 yr lag in the CO2 decline relative to EDC [East Antarctica] temperatures is confirmed during the glacial inception at the end of MIS5.5 [120,000 yrs before present]. Based on our isotopic data this lag can be explained by terrestrial carbon release and carbonate compensation.”
—
http://onlinelibrary.wiley.com/doi/10.1029/2006GL027817/abstract
“[V]ariations in melting precede variations in CO2. Thus, the relatively small amplitude of the CO2 radiative forcing and the absence of a lead over dV/dt both suggest that CO2 variations play a relatively weak role in driving changes in global ice volume compared to insolation variations.”
Reply to this one lost? Anyway, if you think your skeptic celebrities disproved the Shakun paper then … well, I don’t know, you’ll probably believe anything then …
Ha ha ha, now Sebastian make clear he has no effective counterpoint To DOCTOR Easterbrook or POLYMATH Eschenbach postings where they make an honest assessment over the Shakun paper and ignored Kenneth’s list of papers that doesn’t agree with Shakun at all.
You are indeed a closeminded warmist, who doesn’t pursue knowledge based on the evidence, but on consensus and science background.
It is efficacy of the argument is what counts NOT who delivers them.
You going to keep ignoring this Sebastian?
“Today I was thinking about that single record that they used for the CO2 changes. I got to wondering what other ice core CO2 records might show about the change in CO2. So I went and downloaded every ice core CO2 record that I could find that covered the time period 26,000 BC to modern times. I found a number of ice core records that cover the period.
Then I collated all of them in Excel, saved them as a CSV file, opened the file in R, and plotted every ice core CO2 record that covered the record from 26,000 BC up to the present. I standardized them over the same period covered by the Shakun2012 CO2 data. There was excellent agreement between the Shakun2012 data and the ice core records I had downloaded … but there was also a surprise.”
Figure 2 shows the surprise …”
(Chart in the link)
“Dang, I didn’t expect that rise in CO2 that started about 6,000 BC. I do love climate science, it always surprises me … but the big surprise was not what the ice core records showed. It was what the Shakun2012 authors didn’t show.
I’m sure you can see just what those bad-boy scientists have done. Look how they have cut the modern end of the ice core CO2 record short, right at the time when CO2 started to rise again …”
Why can’t you address it?
I repeat, as some offensive, name-calling, cAGW advocate requires it.
Indeed looking at the gradual rise from the effects of the LIA, everything looks very normal, very NATURAL. https://rclutz.files.wordpress.com/2018/01/giss-anntemps2017.png No CO2 effect visible so far!
Regardless of the temperature scale used, there is NO catastrophic change of temperature outside NORMAL NATURAL VARIATIONS. Scammers HAVE to use anomaly charts because the change is so very small — insignificant — at about 0.5° per century.
cAGW dislike this kind of graphic because is easily shows their assertions about CO2 warming have NO BASIS in scientific observations — even when using GISS data.
[…] Continue reading. […]
[…] Continue reading. […]
Dear all.
Let’s ignore SebastianH.
I’m sure he/she/it is only here for their own perverse sense of amusement.
I.e DNFTT!
what does DNFTT ? tou really should spell out the full expression with acronym in brackets a few times
Don from Oz
I believe the acronym is a reference to providing sustainable to bad tempered dwarfs live under bridges.
I’ll be most delighted when you stop to reply with nonsensical comments or write comments mentioning me. I’ll appreciate replies that actually have substance and aren’t completely biased towards the “skeptic” belief/cult.
Yep, You need that ATTENTION, don’t you seb.
Desperate for it.
tou = you
DNFTT = Do Not Feed The Troll
Regards
Climate Heretic
Kenneth appears to be the best keeper here, providing real nutrition, and not the junk food that the troll desires.