Where’s The Anthropogenic Signal?
Since 2000s, An Arctic Warming & Sea Ice Pause …
Cooling In Antarctica … Undermine AGW Claims
It was 3 years ago when scientists first began documenting the pause in Arctic sea ice decline that began in 2007.
While detailing the potential for “cherry-picking” such a short span of years to arrive at “misleading” conclusions, Swart et al. (2015) pointed out that there was a “near-zero” trend in sea ice extent during the brief 2007-2013 period.
“Arctic sea-ice extent was lost at a considerably higher rate from 2001–2007 than in the preceding decades (Fig. 1), which caught the attention of scientists and the public alike. In contrast, from 2007–2013 there was a near-zero trend in observed Arctic September sea-ice extent, in large part due to a strong uptick of the ice-pack in 2013, which has continued into 2014. By deliberately cherry-picking these periods we will demonstrate how using short-term trends can be misleading about longer-term changes, when such trends show either rapid or slow ice loss.”
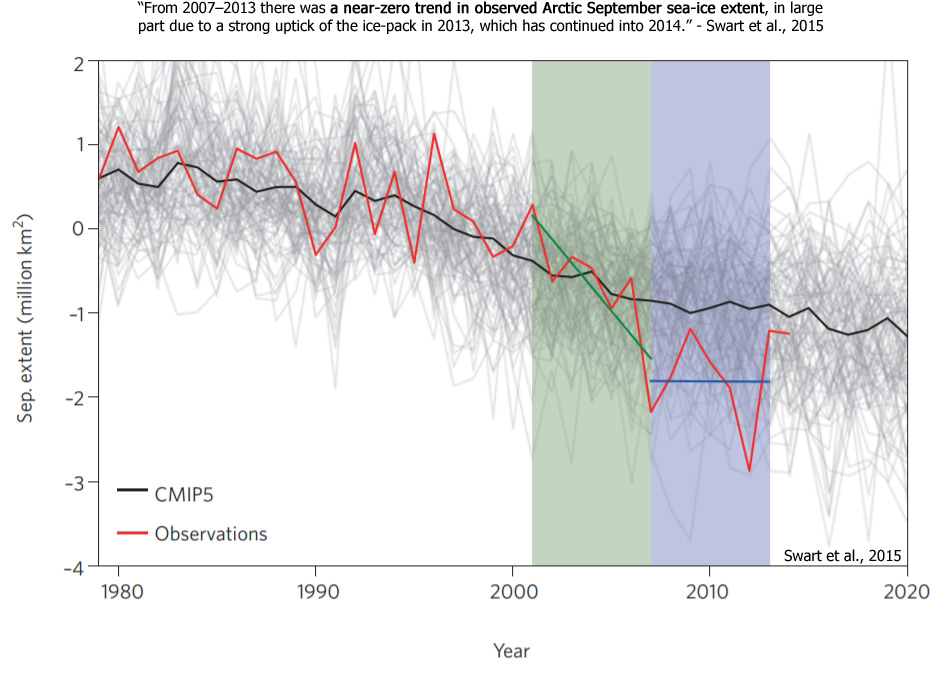
That “cherry-picked” 6-year pause in Arctic sea ice decline has now been extended another 4 years. As illustrated below, there has been no detectable trend in September Arctic sea ice for the 10 years between 2007-2017.
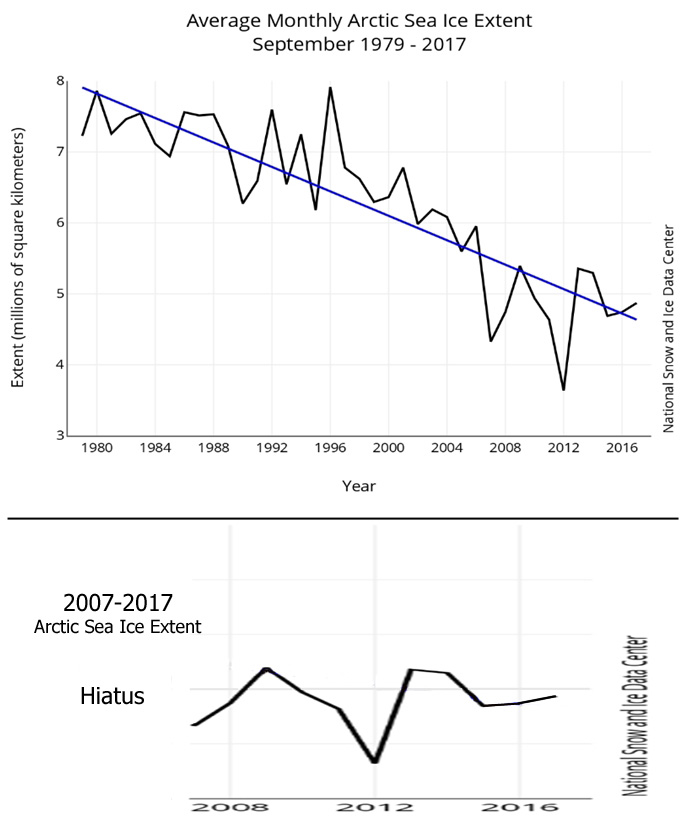
Image Source (top): NSIDC
While Swart and colleagues correctly assess that “using short-term trends can be misleading about longer-term changes”, they apparently only consider the 1979-2013 Arctic September sea ice trend as “longer-term”. And yet this 34-year period could easily be considered of “cherry-picked” length too because it is also a very short record relative to what is available.
Reconstructions of Arctic (and regional Arctic) sea ice extent reveal that modern values aren’t unusual relative to the longer-term context of the last 100+ years.
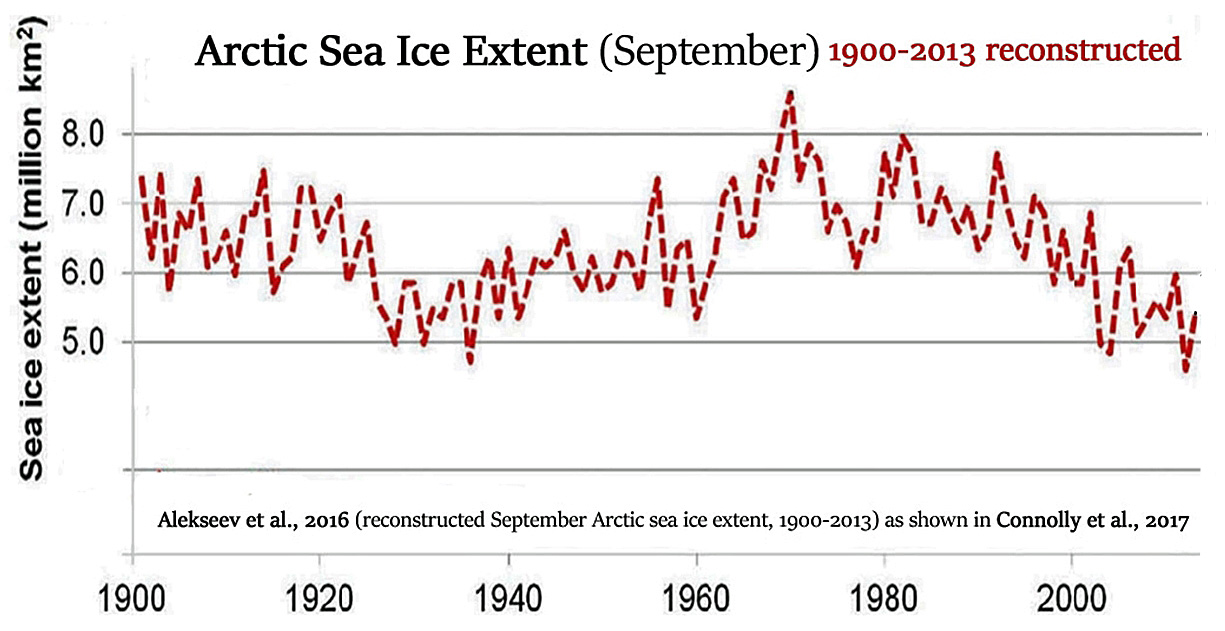
Image Source: Connolly et al., 2017 and Alekseev et al., 2016
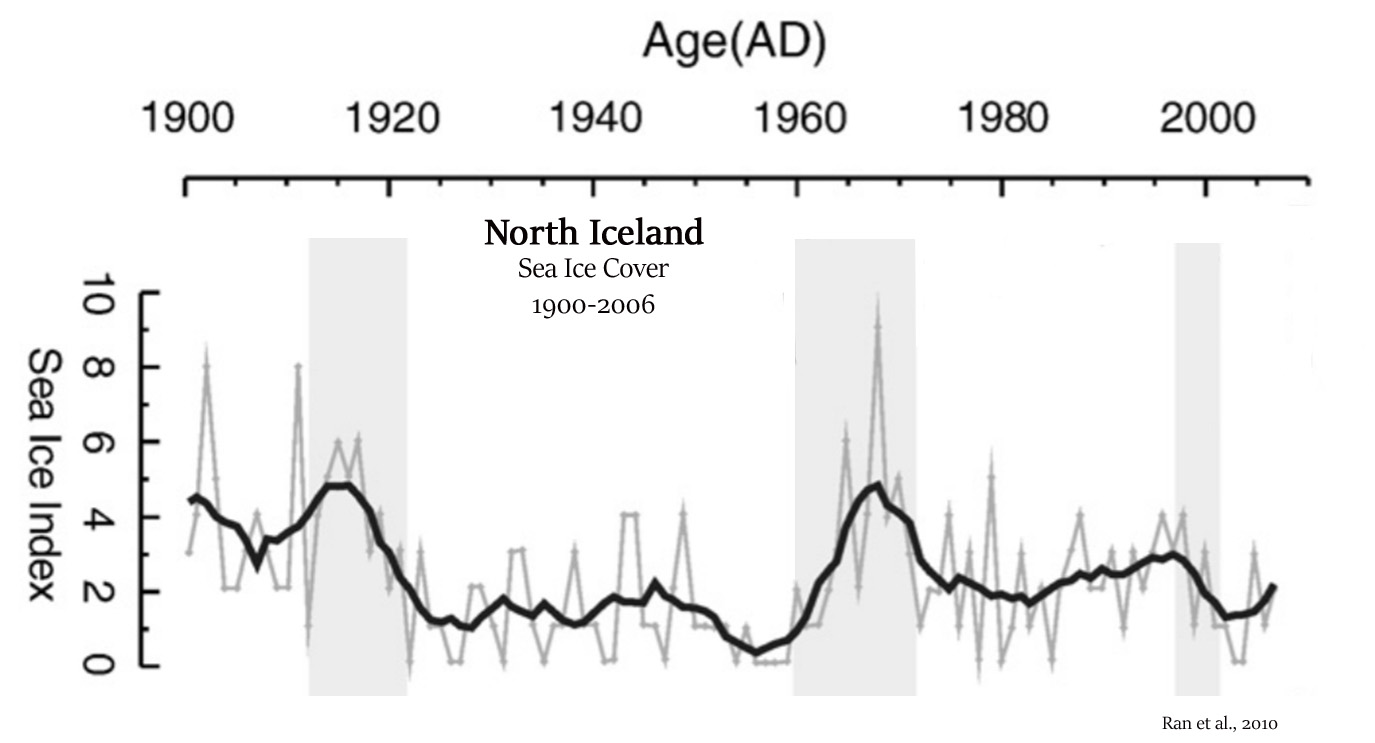
Image Source: Ran et al., 2010
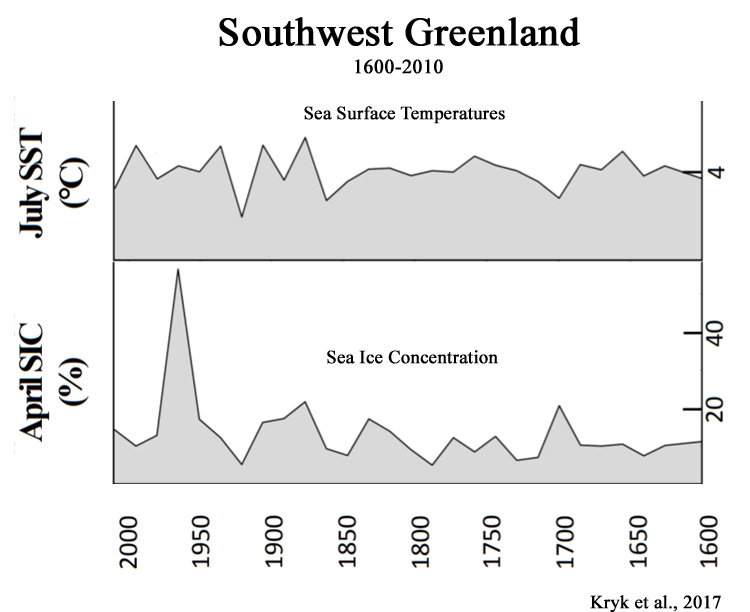
Image Source: Kryk et al., 2017
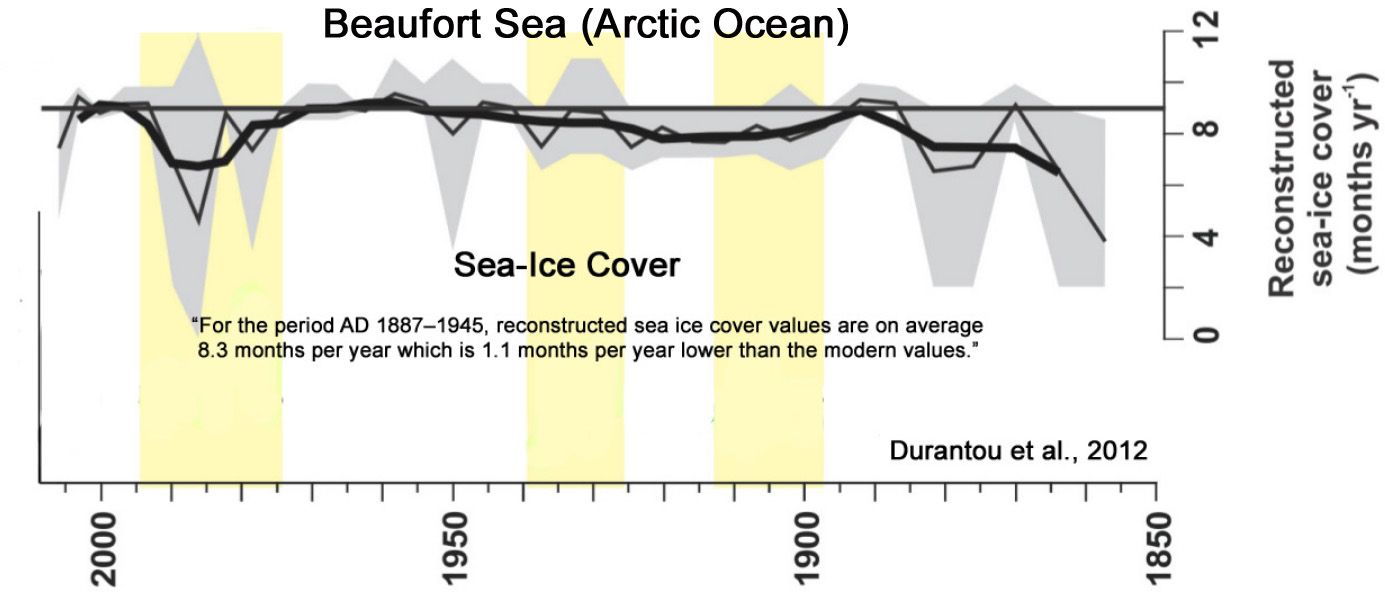
Image Source: Durantou et al., 2012
12 New Papers Affirm A 21st Century Arctic Warming
Pause As Well As A Rapid Cooling Across Antarctica
1. Since 2005, There Has Been A ‘Warming Hiatus’ In The Arctic
“[W]e find that there was a warming hiatus/slowdown since 2005 at Ny-Ålesund. Additionally, the variation of air temperature lags by 8–9 years, which implies that the warming hiatus probably exists in the Arctic but lags behind, globally. This phenomenon is not an isolated instance, An et al. [2017] reported that the warming rate above 4000 m of the Tibetan Plateau has been slowing since the mid-2000s. In the Antarctic Peninsula, the slowdown of the increasing temperature trend was also found after 1998/1999, however, the reason is attributed to local phenomena, such as the deepening of Amundsen Sea Low and not due to the global hiatus [Turner et al., 2016]. … From the correlation analysis, we found Ny-Ålesund could represent most Arctic areas, especially the Atlantic-Arctic sector. … Especially air temperature, the record of Ny-Ålesund can capture the variation of surface temperature over most of [the] Arctic. … The oscillations of atmospheric dynamic systems, the methods of energy transport from low to high latitudes, and feedback mechanisms of the Arctic on climate change may contribute to the warming hiatus. … [C]limate changes in polar areas remain difficult to predict, which indicates that the underlying mechanisms of polar amplification remain uncertain and debatable.”
2. ‘Marked Cooling’ In Siberia Since 2000
Suvorov and Kitov, 2018 (Eastern Sayan, Siberia)
“The authors examined the variability of activity of modern glaciation and variation of natural conditions of the periglacial zone on climate and on dendrochronological data. Results of larch and Siberian stone pine growth data were revealed at the higher border of forest communities. … It is believed that the temperature could be 3.5 °C warmer at the Holocene optimum than at the present time (Vaganov and Shiyatov 2005). … Since 2000, there has been growth of trees instability associated with a decrease in average monthly summer temperatures. … Since the beginning of 2000, decrease in summer temperatures was marked.”
3. ‘A Cooling Is Observed’ During 2001-2015 In Greenland
Westergaard-Nielsen et al., 2018
“Here we quantify trends in satellite-derived land surface temperatures and modelled air temperatures, validated against observations, across the entire ice-free Greenland. … Warming trends observed from 1986–2016 across the ice-free Greenland is mainly related to warming in the 1990’s. The most recent and detailed trends based on MODIS (2001–2015) shows contrasting trends across Greenland, and if any general trend it is mostly a cooling. The MODIS dataset provides a unique detailed picture of spatiotemporally distributed changes during the last 15 years. … Figure 3 shows that on an annual basis, less than 36% of the ice-free Greenland has experienced a significant trend and, if any, a cooling is observed during the last 15 years (<0.15 °C change per year).”
4. Slight Cooling During 2005-2015 In Greenland
“For the most recent 10 years (2005 to 2015), apart from the anomalously warm year of 2010, mean annual temperatures at the [Greenland] Summit exhibit a slightly decreasing trend in accordance with northern North Atlantic-wide cooling. The Summit temperatures are well correlated with southwest coastal records (Ilulissat, Kangerlussuaq, Nuuk, and Qaqortoq).”
5. A Cooling Observed between 1997-2016 In Arctic Canada
“From 1988 to 1996, the summer intensity of the AO was largely in the positive phase, with a mean value of 0.207 (± 0.135 SE), and this was a period of population stability or growth for each of the three herds that we examined here. In contrast, from 1997 to 2016 the summer AO has remained largely in the negative phase [cooling], with a mean value of − 0.154 (± 0.077 SE), and over this period the Bathurst, Beverly, and Qamanirjuaq herds declined in abundance.”

21st Century Cooling Across Antarctica
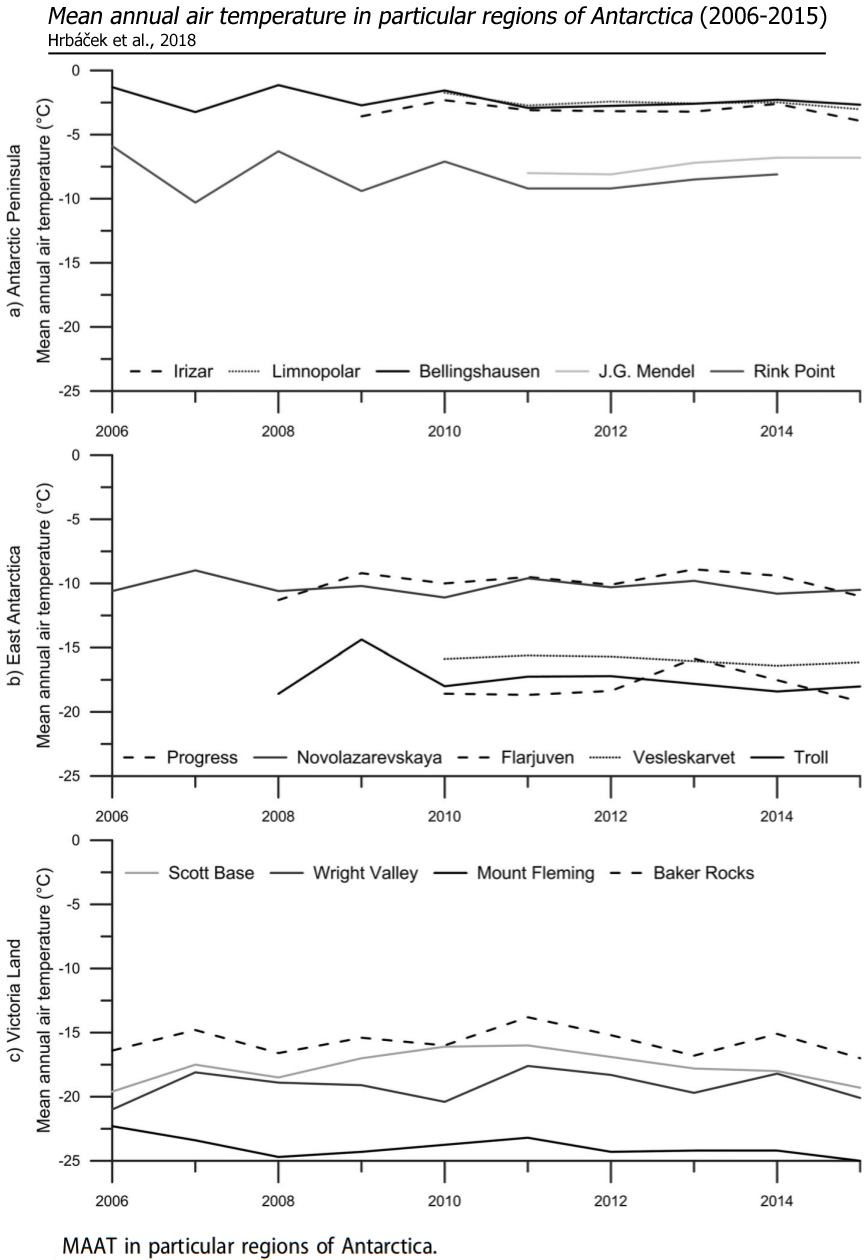
6. 2006-’15 Antarctic Peninsula Cooling – A Thinning Ice Sheet Linked To Cooling?
“Active layer monitoring in Antarctica: an overview of results from 2006 to 2015 … Air temperatures showed significant regional differences within the study areas. In the western Antarctic Peninsula region, Vestfold Hills and northern Victoria Land, a slight air temperature cooling was detected, while at other sites in Victoria Land and East Antarctica the air temperature was more irregular, showing no strong overall trend of warming or cooling during the study period (Figure 2). The Antarctic Peninsula region has been reported as the most rapidly warming part of Antarctica (e.g. Turner et al., 2005, 2014), but cooling has been reported since 2000 (Turner et al., 2016). Relatively stable air temperature conditions during the past 20 years were reported in Victoria Land (Guglielmin & Cannone, 2012).”
“Significantly, thicker thaw depths were observed in the colder regions of the eastern Antarctic Peninsula and the coastal zone of East Antarctica. The general pattern suggests that factors other than regional climate should be considered when examining the ground thermal regime (e.g. Hrbáček, 2016). Between 2009 and 2014, substantial active layer thinning was observed at all sites in the western Antarctic Peninsula. The thinning was attributed to climate cooling in the region (Oliva, Navarro, et al., 2017; Turner et al., 2016) and changes in snow cover accumulation, as well as snow persistence during the summer, reducing active layer thaw (de Pablo et al., 2017). In contrast, pronounced active layer thickening between 2010 and 2013 was recorded at Novolazarevskaya in coastal East Antarctica.”
7. The Northern Antarctic Peninsula Cooled By -1.98°C between 2008 and 2014
“As shown by firn core analysis, the near-surface temperature in the northern-most portion of the Antarctic Peninsula shows a decreasing trend (−0.33°C year−1) between 2008 and 2014 [-1.98°C].”
8. Antarctic Peninsula and East Antarctica Cooling Since 1998
Vignon et al., 2018
“The near‐surface Antarctic atmosphere experienced significant changes during the last decades (Steig et al., 2009; Turner et al., 2006). In particular, the near‐surface air over the Western part of Antarctica exhibits one of the major warming over the globe (Bromwich et al., 2013a), with heating rates larger than 0.5 K per decade at some places. Despite a significant warming in the end of the 20th century, the Antarctic Peninsula has been slightly cooling since 1998, reflecting the high natural variability of the climate in this region (Turner et al., 2016). East Antarctica has experienced a slight cooling trend (Nicolas & Bromwich, 2014; Smith & Polvani, 2017) particularly marked during autumn. … General circulation models (GCMs) are very powerful tools for investigating the mechanisms responsible for global or regional changes in the Earth climate. However, we can wonder to what extent they are able to correctly represent the near‐surface temperature field over Antarctica. Although the models involved in the fifth Coupled Models Intercomparison Experiment (CMIP) have a realistic climatology and interannual variability in Antarctica, they fail in reproducing the near‐surface temperature trends in the period 1979–2005 (Smith & Polvani, 2017) and particularly the contrast between west and east Antarctica.”
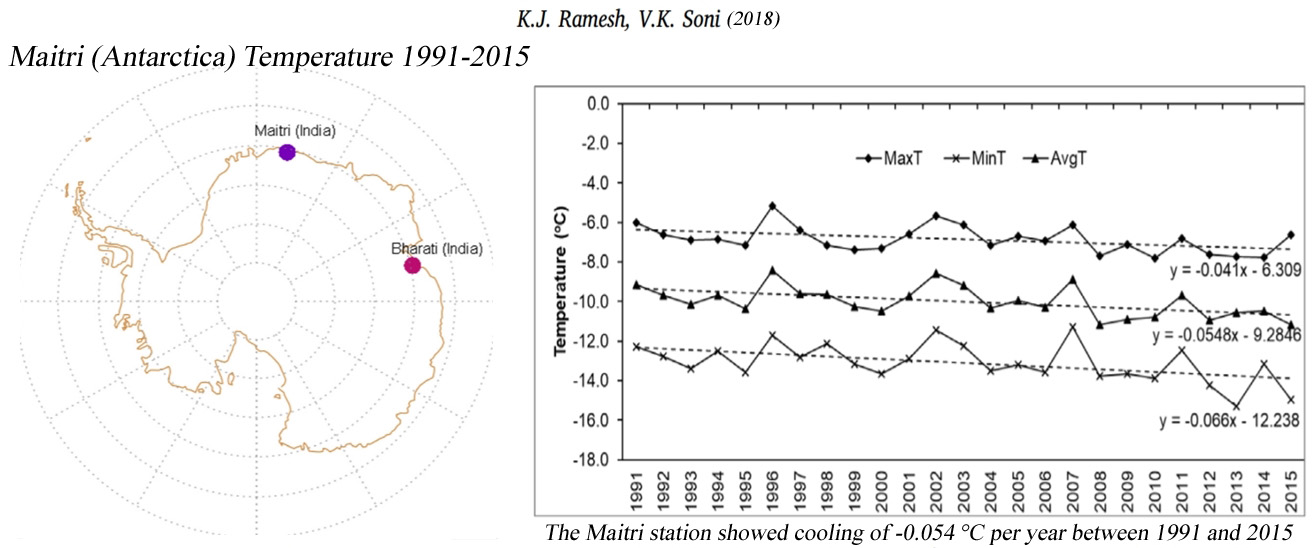
9. Most Of East Antarctica Has Been Cooling Since 1990s, ‘Significant Cooling’ In Antarctic Peninsula
“The present paper reviews the progress of India’s scientific research in polar meteorology. The analysis of 25 years meteorological data collected at Maitri station for the period 1991–2015 is presented in the paper. The observed trend in the temperature data of 19 Antarctic stations obtained from READER project for the period 1991–2015 has also been examined. The 25 years long term temperature record shows cooling over Maitri station. The Maitri station showed cooling of 0.054 °C per year between 1991 and 2015, with similar pronounced seasonal trends. The nearby Russian station Novolazarevskaya also showed a cooling trend of 0.032 °C per year. … The temperature trend in average temperature of 19 Antarctica stations is also examined to ascertain the extent of cooling or warming trend (Supplementary Table_S1). The majority of stations in East Antarctica close to the coast show cooling or no significant trend. … Turner et al. (2016) using stacked temperature record found a significant cooling trend for the Antarctic Peninsula for the period 1999–2014. Their study suggests that the warming on the Antarctic Peninsula during 1979–1997 and subsequent cooling during 1999–2014 are both within the limits of the decadal time scale natural climate variability of the region. Smith and Polvani (2017) examined the relationship between the SAM and Antarctic surface air temperature trends, in both models and reanalyses. They also found convincing evidence that natural climate variability is the major contributor to the warming of West Antarctica and Antarctic Peninsula. … The Antarctic Sea-ice extent has been showing increasing trend in the recent past few decades. The rate of change in Antarctic sea-ice extent exhibit strong regional differences with increase in some regions and decrease in other. The mean Antarctic sea-ice extent increased at a rate of 1.2–1.8% per decade between 1979 and 2012 (IPCC, 2013). Gagné et al. (2015) attributed increase in Antarctic sea-ice extent to internal variability.”
10. Models Fail To Simulate The Southern Ocean Cooling And Circumpolar Increase In Sea Ice
Purich et al., 2018
“Observed Southern Ocean changes over recent decades include a surface freshening (Durack and Wijffels 2010; Durack et al. 2012; de Lavergne et al. 2014), surface cooling (Fan et al. 2014; Marshall et al. 2014; Armour et al. 2016; Purich et al. 2016a) and circumpolar increase in Antarctic sea ice (Cavalieri and Parkinson 2008; Comiso and Nishio 2008; Parkinson and Cavalieri 2012). … [A]s high-latitude surface freshening is associated with surface cooling and a sea ice increase, this may be another factor contributing to the CMIP5 models excessive Southern Ocean surface warming contrasting the observed surface cooling (Marshall et al. 2014; Purich et al. 2016a), and sea ice decline contrasting the observed increases (Mahlstein et al. 2013; Polvani and Smith 2013; Swart and Fyfe 2013; Turner et al. 2013; Zunz et al. 2013; Gagne et al. 2015) over recent decades. … Our results suggest that recent multi-decadal trends in large-scale surface salinity over the Southern Ocean have played a role in the observed surface cooling seen in this region. … The majority of CMIP5 models do not simulate a surface cooling and increase in sea ice (Fig. 8b), as seen in observations.”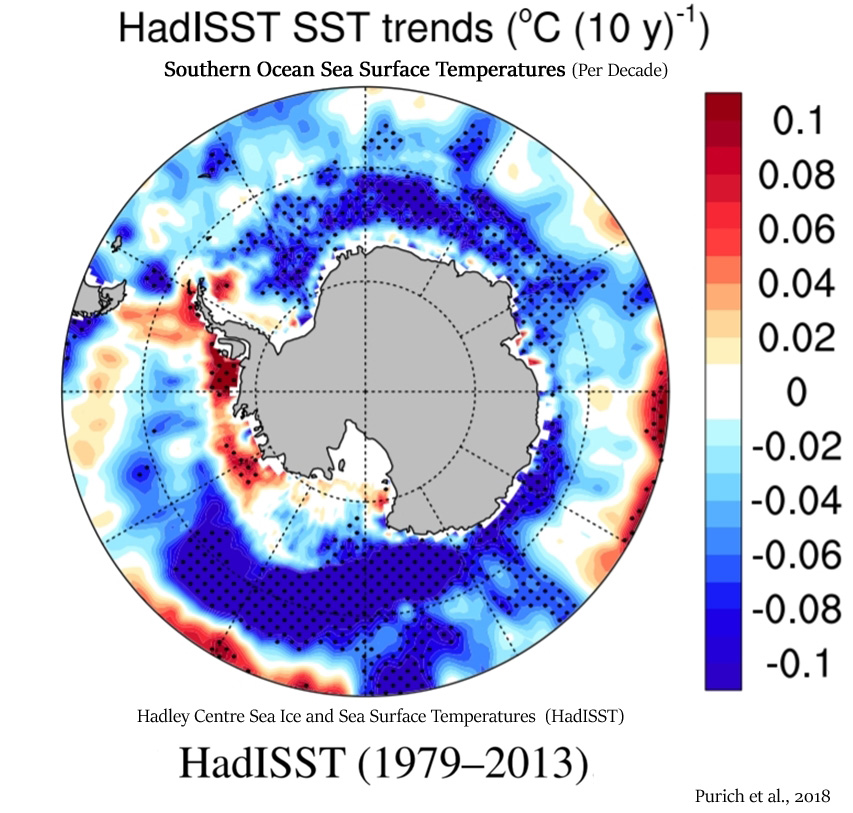
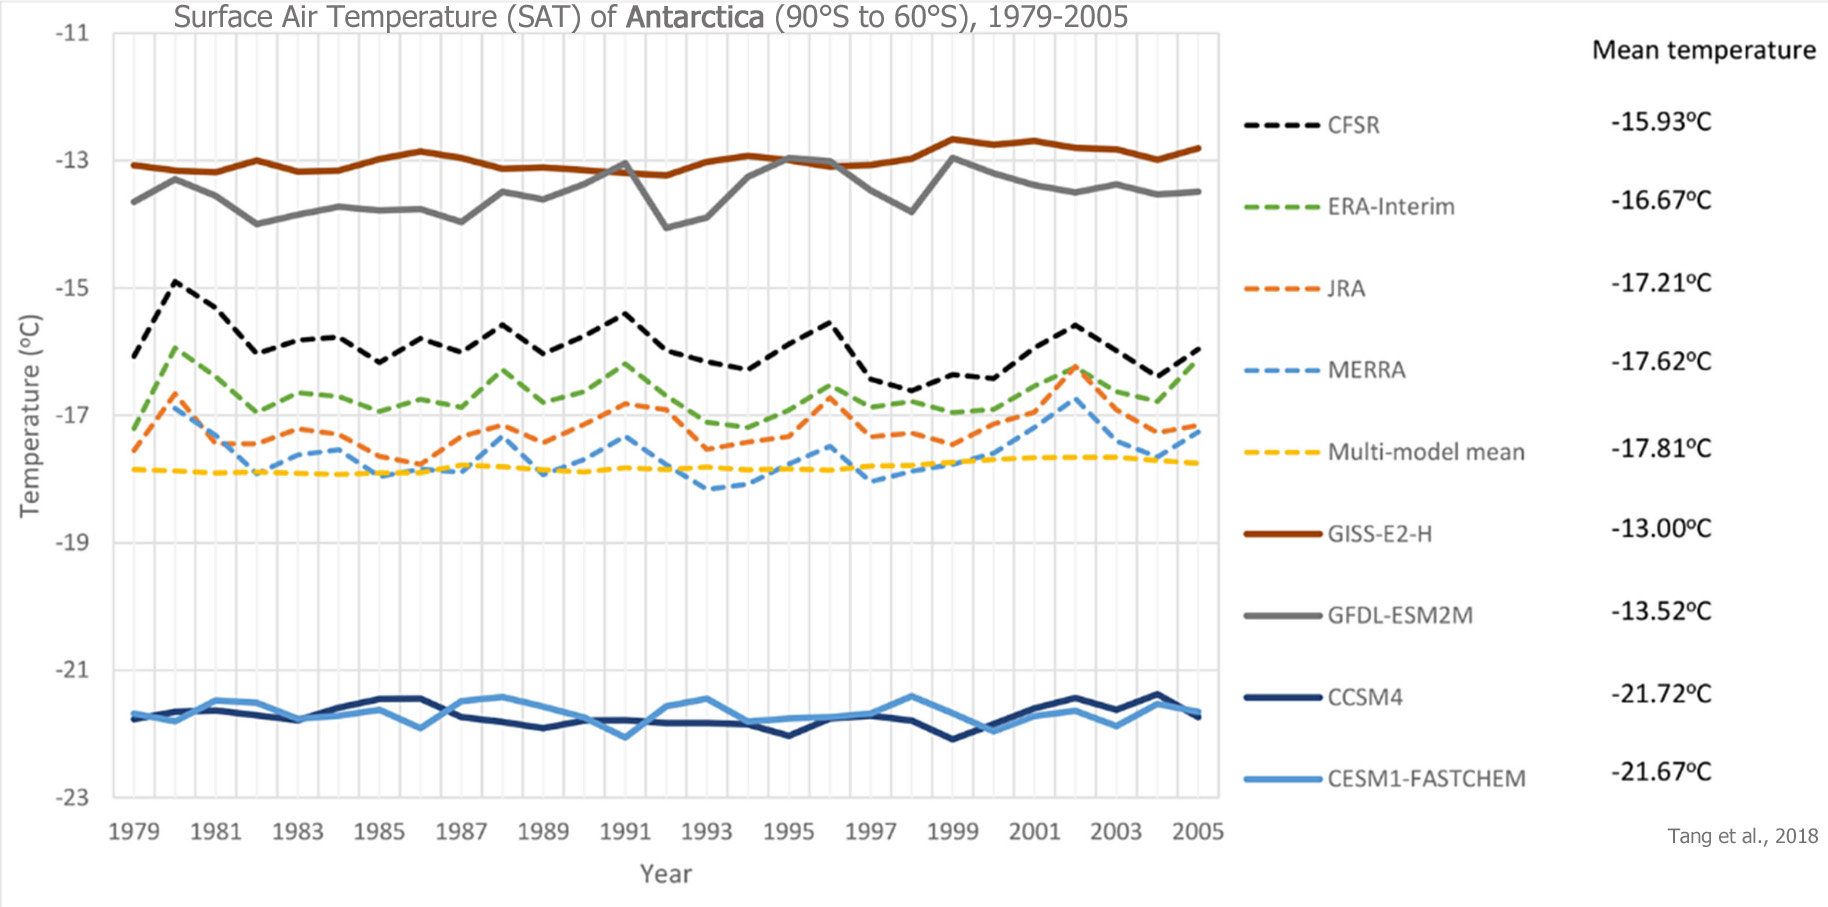
11. Temperature (Non) Trend Across Antarctica (90°S To 60°S)
“The study of Antarctic precipitation has attracted a lot of attention recently. The reliability of climate models in simulating Antarctic precipitation, however, is still debatable. This work assess the precipitation and surface air temperature (SAT) of Antarctica (90°S to 60°S) using 49 Coupled Model Intercomparison Project phase 5 (CMIP5) global climate models”
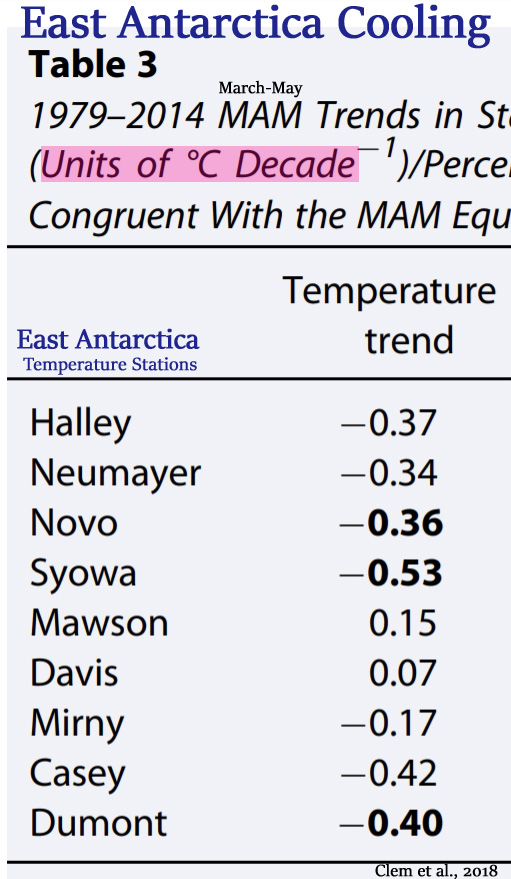
12. ‘Ubiquitous’ Cooling Across East Antarctica Since The 1970s
“Over the past 60 years, the climate of East Antarctica cooled while portions of West Antarctica were among the most rapidly warming regions on the planet. The East Antarctic cooling is attributed to a positive trend in the Southern Annular Mode (SAM) and a strengthening of the westerlies, while West Antarctic warming is tied to zonally asymmetric circulation changes forced by the tropics. This study finds recent (post-1979) surface cooling of East Antarctica during austral autumn to also be tied to tropical forcing, namely, an increase in La Niña events. … The South Atlantic anticyclone is associated with cold air advection, weakened northerlies, and increased sea ice concentrations across the western East Antarctic coast, which has increased the rate of cooling at Novolazarevskaya and Syowa stations after 1979. This enhanced cooling over western East Antarctica is tied more broadly to a zonally asymmetric temperature trend pattern across East Antarctica during autumn that is consistent with a tropically forced Rossby wave rather than a SAM pattern; the positive SAM pattern is associated with ubiquitous cooling across East Antarctica.


Isn’t this getting old by now? One or two extremes can not be the start or the end of any “trend”. You even posted a graph that displays the long term trend and makes it very clear that the years after those two extreme years are continuing the trend. At most you can look at this graph and determine that those two downward extremes demonstrate that the decrease in Arctic ice extent can temporarily be much faster than the overall longterm trend.
Calling this a hiatus is classic disinformer talk.
Great! So you do agree we should not consider graphs that have 1979 as their start year, as that was probably the coldest year in the Arctic in the last 100 years, as shown here:
https://notrickszone.com/wp-content/uploads/2016/11/Arctic-Surface-Temps-Since-1920-copy-768×394.jpg
If you agree we shouldn’t start sea ice trends in anomalously cold or high extent years, surely you will agree that 1979 is not acceptable as a starting point. You want to be consistent, right?
So what year do you prefer to start the trend, SebastianH?
Use one of these graphs of 100+ year records to make your selection (so that we can eliminate the potential for cherry-picking short-term trends starting/ending in extreme years).
—
https://notrickszone.com/wp-content/uploads/2018/04/Arctic-Sea-Ice-Extent-1900-2013-Alekseev-2015-Connolly-2017.jpg
—
https://notrickszone.com/wp-content/uploads/2018/03/Holocene-Arctic-Sea-Ice-North-Iceland-Ran-2010.jpg
—
https://notrickszone.com/wp-content/uploads/2017/06/Holocene-Cooling-Greenland-SW-Kryk-2017.jpg
*sigh* … you really have a talent for ignoring the actual criticism and turning it around towards your opponent in an effort to distract from your mistake.
The longer the period the better, obviously. Do you somehow disagree that the trend pictured in this graph (https://notrickszone.com/wp-content/uploads/2018/04/Arctic-Sea-Ice-Pause-2007-2017.jpg) exists? Do you want to go back a billion years and look at a trend from back then until today?
What year do you prefer?
You are kidding, right? With your talent to pick the one graph from a paper that might slightly agree with your weird view of the world … wth.
That Alekseev/Connolly graph. Have you even looked at the other graphs in that paper and what the paper actually did? The tried to “adjust” reconstructions by scaling them with unadjusted temperature records. To make the variability before 1979 a bit larger, I guess.
https://www.tandfonline.com/doi/full/10.1080/02626667.2017.1324974?scroll=top&needAccess=true
And you manage to pick out a reconstruction that is also based on temperature proxies. Further below you commented that wind plays a big role … why this inconsistency?
BTW: this is their “adjusted” reconstruction graph:
https://www.tandfonline.com/na101/home/literatum/publisher/tandf/journals/content/thsj20/2017/thsj20.v062.i08/02626667.2017.1324974/20170612/images/large/thsj_a_1324974_f0012_oc.jpeg
This is so amusing to me. I didn’t make the mistake of insisting that extreme anomalous years should not be used as starting or ending points. You wrote that. And, as you know, the year 1979 was one of the top 3 coldest and highest sea ice extent years in the Arctic. Here’s an IPCC (1990) graph using NOAA data that shows the Arctic’s sea ice extent since the early 1970s (using NIMBUS satellite data that they have since removed because that starting point was too low).
https://realclimatescience.com/wp-content/uploads/2017/04/Screen-Shot-2017-04-14-at-7.44.33-AM-down-1.gif
Notice the highest anomaly sea ice extent for Iceland’s Koch index:
https://notrickszone.com/wp-content/uploads/2017/03/Arctic-Sea-Ice-Iceland-Koch-Since-1200.jpg
See that really high post-1920-1950 outlier there that’s so high it’s commensurate with the LIA values? That’s 1979. So why do you insist upon using that year as your starting point, SebastianH, but then simultaneously complain about using extreme or anomalous years as starting points? Do you not agree this is inconsistent?
Do we have a data set for Arctic sea ice that’s a billion years old? No? So the point of you writing this is…what, exactly?
I agree, the longer period, the better (obviously).
https://notrickszone.com/wp-content/uploads/2018/04/Holocene-Arctic-Sea-Ice-Western-Arctic-Ocean-9500-yrs-ago-to-2001-AD-McKay-2008.jpg
How about the Roman Warm Period era, when Arctic temperatures were 2 to 6 degrees C warmer than now and the Arctic had less than 50% sea ice coverage 6 months of the year vs. just 1.5 months of <50% sea ice coverage during the post-1950s "Anthropocene"? See that dark rectangular box on the upper left? That's 1954-2001 -- the highest sea ice extent during the last 9,000 years. I don't think this helps your case that 100% of the modern Arctic climate changes are linked to CO2 concentration increases...but that's why I'm not a believer.
*sigh* again … the mistake was to start a trend for the Artic sea ice extent in 2007. Why would anyone do that? Why not start in 2012 and even claim dramatic increaee in sea ice extent?
No, I don’t know. Let’s use the graph from the paper you seem to like so much. Connolly 2017, does 1979 somehow stick out? What do you think?
Ah, the Iceland thing again. Do you know what the Koch index is? Does it correlate with Artic Sea ice extent? Does it correlate with the Connolly 2017 reconstruction?
I started this thread to highlight that 2007 is an extreme low value and 2016/2017 are well within the long term trend. If anything, these extremes show, that Arctic ice can melt even faster than the overall trend in exceptional years. Your conclusion is however that the ice extent is stable now.
Having notified you about this problem you turn around and go on with 1979 being exceptional. It’s not, as the graphs from the papers you quote from clearly show.
And even if it were exceptional, the timespan is long enough to be used as the current longterm trend. You could also use 1900 as the starting date and get a much slower trend of decrease, signifying the now much larger recent downward trend.
The point is that you seem to seek out starting points that are to your liking. So why not go further and further back until it suits your perception of reality?
I don’t need to link 100% to CO2 and you are a very strong believer. Only your belief is that what you are trying to tell people is actually true, even though it is a combination of cherry picked data points, citations and lots of confusion.
Perhaps you should ask Swart et al. (2015) why they began their pause in 2007.
https://notrickszone.com/wp-content/uploads/2018/04/Arctic-Sea-Ice-Pause-2007-2013-Swart-2015.jpg
Do you acknowledge that 1979 is an extreme high value? The IPCC did. NOAA did. That’s why they stopped using 1973 as their starting year and switched to 1979. The reason for the cherry-pick is clear:
https://realclimatescience.com/wp-content/uploads/2017/04/Screen-Shot-2017-04-14-at-7.44.33-AM-down-1.gif
And, as you know, the year 1979 was one of the top 3 coldest and highest sea ice extent years in the Arctic.
See the IPCC graph above. Alekseev et al. graph has 1979 as the 3rd coldest of the 114 years between 1900 and 2013.
There has been no trend in the last 10 years, which is 4 more than the non-trend identified by Swart et al., 2015.
Isn’t that exactly what you are doing by claiming that we should use extreme 1979 as a starting point — one of the highest points of the last 114 years?
Using this graph…
https://notrickszone.com/wp-content/uploads/2018/04/Arctic-Sea-Ice-Extent-1900-2013-Alekseev-2015-Connolly-2017.jpg
…see if you can draw a trend line from the year 1951 onwards. (1951 is the starting year for the anthropogenic signal used by the IPCC.) What’s that trend line look like?
And you?
https://pbs.twimg.com/media/DbknPbjWAAI2WIE.png
Iceland is not the Arctic Kenneth … for the 100th time.
The North Icelandic Shelf is in the Arctic circle.
So are numerous other locations.
Would you take a record of climate data for Toronto (Canada) and try to convince others that it must be the same as the record for Marseille (France)? Coldest years, etc …
Something to read about Iceland’s climate change:
https://rmets.onlinelibrary.wiley.com/doi/pdf/10.1256/wea.80.04
Correct, like most of Greenland, where there has been no net warming for the past 80 years despite a gigantic increase in yearly CO2 emissions. Why did CO2 fail to increase temperatures in Greenland, SebastianH?
https://notrickszone.com/wp-content/uploads/2018/04/CO2-Emissions-and-Greenland.jpg
For that matter, why is the western Arctic Ocean 2 to 6 degrees C colder now (1954-2001) than it has been for the last 9,000 years?
https://notrickszone.com/wp-content/uploads/2018/04/Holocene-Cooling-Arctic-Sea-Surface-Temperatures-McKay-2008.jpg
Why is Arctic sea ice extent greater now than it has been for the last 9,000 years?
https://notrickszone.com/wp-content/uploads/2018/04/Holocene-Arctic-Sea-Ice-Western-Arctic-Ocean-9500-yrs-ago-to-2001-AD-McKay-2008.jpg
What was the mechanism causing the cooling and sea ice expansion?
No. I would, however, use Iceland’s well-documented sea ice record to show that modern sea ice extent isn’t even close to being unusual.
https://notrickszone.com/wp-content/uploads/2017/03/Arctic-Sea-Ice-Iceland-Koch-Since-1200-768×411.jpg
@Kenneth Richard 25. April 2018 at 1:07 AM
See also here
https://realclimatescience.com/wp-content/uploads/2016/11/station-6.gif
From here
https://notalotofpeopleknowthat.wordpress.com/2016/11/21/icelandic-met-office-sells-out-to-gavin/
It didn’t.
Why use a graph that combines proxy with instrumental data (thick line) for this question? And why use a version that looks like it was photographed from a printed out paper?
You do know that there is a difference between Arctic sea ice extent and a graph with the months of the year that have greater than 50% coverage over a very specific location at the north coast of Alaska, do you?
You tell us! Do you believe it is the same as in modern times?
And why would you do that? Because it suits your agenda. Iceland experienced a (relative to the NH) colder climate in the mid 20th century. If it were the other way around you would certainly not allow anyone to use graphs from Iceland to show that the Arctic might have experienced a rather extreme 1979.
In the meantime, have you looked at the Connolly reconstruction paper you are so fond of using one specific graph from? What can you tell us about the sea ice extent in 1979? Does it stick out as an extreme? No it doesn’t.
And last but not least comes yonason along and throws in some conspiracy theory stuff. Great 😉 Totally helps the case.
Reply to this vanished … again
1.Yes, we know CO2 had no effect on Greenland (or anywhere else)
2. No argument against the evidence in the chart then.
3. Whole of Arctic has had FAR LESS sea ice than now for over 9000years of the last 10000 years. Data from several places shows this.
4. Patterns of sea ice are similar all around the Arctic for the last 10000 years, and they ALL show current sea ice is FAR above the average .
Its almost as if you are DENYING the ANOMALOUSLY COLD ice age actually existed !!!
STOP DENYING CLIMATE CHANGE, seb
“Iceland experienced a (relative to the NH) colder climate in the mid 20th century.”
The WHOLE ARCTIC and many other places in the NH experienced a cold period after the peak around 1930/40
https://s19.postimg.cc/vws4z68s3/arctic_temp.png
https://s19.postimg.cc/woukfcc0z/Canada_Mariime_temperatures.png
https://s19.postimg.cc/5if59yngz/Ireland_AMO_article.jpg
https://s19.postimg.cc/o1d61lfoz/Ncdc_measured.jpg
https://s19.postimg.cc/llr7psycz/Cooling_1.jpg
“Does it stick out as an extreme?”
Around the late 1970s was the second highest peak after around 1970.
And higher than anything else back to 1900
Your point is ????
https://s19.postimg.cc/hcmhnqak3/Arctic-_Sea-_Ice-_Alekseev-2016-as-shown-in-_Connolly-2017.jpg
You should be happy seb, you have always said the Arctic sea ice is negatively correlated with temperatures….
…. well the Alekseev graph is.
First time you have been remotely correct about ANYTHING, and you can’t accept it.
So sad. !
My point is, that this graph is not what the paper is about. It is just included to compare their reconstruction with other reconstructions. The Connolly 2017 graph(s) doesn’t look like this at all.
It seems like it is pointless to notify you guys of something obvious like this … you’ll just ignore anything that doesn’t fit you bubble *sigh* Only highlighting stuff that on the surface looks like it supports your weird views of reality.
No trend, seb
https://s19.postimg.cc/umq1x3h4j/Arctic_ice_area_trend.png
And the volume has no trend either
https://s19.postimg.cc/84aexi5k3/DMI_Arctic_sea_Ice_Volume.png
Arctic sea ice extent and volume are FAR above the Holocene average.
At least have the courage to ADMIT to this FACT, seb.
Should I also admit to the fact the sea ice extent is dramatically increasing since 2012? Despite the 2016/2017 sea ice extent being almost exactly on the longterm trendline?
https://notrickszone.com/wp-content/uploads/2018/04/Arctic-Sea-Ice-Pause-2007-2017.jpg
Can I assume that you have a really hard time accepting the fact that scientists identified a 6-year-pause in Arctic sea ice decline in a peer-reviewed paper…and I have just extended their pause-plot another 4 years? Was it right for them to identify a 6-year pause, but wrong for me to lengthen it? If so, why is a 6-year plot that begins in 2007 right, but a 10-year plot that begins in 2007 wrong? Do you agree with the assessment that we shouldn’t regard the 1979-present plot as long-term (and thus choosing it is “cherry-picking” when we have plenty of evidence accumulated for much longer-term plots)? If not, why do you think 1979 (an anomalously cold and high extent year) is an appropriate starting point?
Just stop it … this is why skeptics are viewed as they are. As disinformers.
There are near-zero trends for short periods all over that graph. There are also upward trends for short periods. The overall trend – and you can’t be that blind – is however downwards with 2007 and 2012 being extremes.
I find it kind of funny that you think that picking 1979 as start is cherry picking … from you of all people 😉
That’s a rather ironic characterization coming from someone who writes this about 30,000 species going extinct every year…
https://notrickszone.com/2017/10/16/recent-co2-climate-sensitivity-estimates-continue-trending-towards-zero/#comment-1232607
SebastianH: “Regarding extinction of species, why do you think 30,000 species lost per year is a big number? We are already at or over that rate.”
Or coming from someone who thinks that rising CO2 browns and desertifies the Earth…
Desertification? roflmao…. satellites show the opposite happening [greening].
SebastianH: “[C]an you please point to the satellite data that shows what you claim is true? I can only find data for increasing desertification.”
Or that marine species cannot adapt to a pH trend change of -0.0007 over the course of a 200-year period…
https://notrickszone.com/2018/01/04/485-scientific-papers-published-in-2017-support-a-skeptical-position-on-climate-alarm/#comment-1246210
SebastianH: “They [marine species] might be able to adapt, but not at the speed acidification is happening.”
The overall trend looks more like an oscillation, non-linear (just like the Arctic air temperature), and without any clear connection to anthropogenic CO2 emissions:
https://notrickszone.com/wp-content/uploads/2018/04/CO2-Emissions-and-Arctic-Air.jpg
I was responding to your claim that 2007 should not be used because it’s an extreme year. 1979 is an equally extreme year…
https://realclimatescience.com/wp-content/uploads/2017/04/Screen-Shot-2017-04-14-at-7.44.33-AM-down-1.gif
The linear trend monkey strikes again!
Sure you don’t want to use a polynomial, in a know CYCLIC system ???
That would be even funnier.
Good think about the Alekseev et al., 2016 graph is that it actually matches real temperatures.
And seb has always said that Arctic sea ice is driven by temperatures.
https://s19.postimg.cc/vws4z68s3/arctic_temp.png
https://s19.postimg.cc/5ffms4j1v/iceland_8.jpg
Even down as far as Ireland
https://s19.postimg.cc/5if59yngz/Ireland_AMO_article.jpg
CYCLIC, seb..
plus some recovery from the anomalous cold of the LIA
NOT linear,
NOT polynomial
??? comprehend ???
thing, not a k !!!
“Reconstructed September SIE shows the minimum in 1936 that is twice higher then minimum 2012”
– Genrikh Alekseev
Source: http://svalbard.aari.ru/docs/Merop/2016/prez_16_03_3.pdf
(See also figure 1.3)
Same old tricks…
As you may or may not realize, that statement is derived from mixing the reconstructed values with the “observed” values (1980-2013). When using the reconstructed values for both periods (based upon the negligible discrepancy in Arctic temperatures between the 1930s and 2000s), the difference disappears — which is what is shown in the Connolly et al (2017) graph. 2012 is clearly an anomalous outlier year in the “observed” record; it stands alone and does not represent a part of the overall area trend which has risen since 2012 and now is no higher than the early 2000s (or 1930s). In other words, Arctic sea ice extent — like the 21st centuryex pause in temperatures — has not been cooperating with models. This is illustrated here:
https://notrickszone.com/wp-content/uploads/2018/04/CO2-Emissions-and-Arctic-Air.jpg
Yes, please do look at Figure 1.3 from the link you provided (thanks). It shows the difference between the reconstructed sea ice values (blue) and the observed (red). The Connolly graph uses the reconstructed values, which are based on the negligible difference between Arctic temperatures in the 1930s vs. the 2000s. (Humans emitted 1 GtC/yr during the 1930s, but 9 GtC/yr during the 2000s…and yet there is effectively no difference in Arctic temperatures between the two periods.) The uptick in sea ice extent after 2012 is not shown but if it was it would clearly show that sea ice has not continued a downwards path since about 2007. It’s paused, even risen. 2012 is clearly an outlier year.
Please identify the “tricks” you might be referring to, Philip. Do you disagree with scientists pointing out that Greenland, Siberia, the Canadian Arctic…have been cooling since the early 2000s? Do you disagree that the Anatarctic Peninsula has been cooling dramatically since 1999? That East Antarctica has been cooling ubiquitously since the 1960s and 1970s? Do you disagree with the other graphs of centennial-scale sea ice extent showing nothing unusual has happened during the last few decades in Arctic regions like West Greenland, North Iceland, or the Beaufort Sea?
I thought it was the wind what done it, gov’ner.
https://rmets.onlinelibrary.wiley.com/doi/pdf/10.1002/asl2.423
Yes, as with ENSO events, wind does play a substantial role in surface air temperature changes. Good find. Yet again, not one mention of anthropogenic CO2 emissions influencing the Arctic sea ice changes. But SebastianH and Philip are 100% attribution believers, and nothing that’s written here is going to change that.
https://rmets.onlinelibrary.wiley.com/doi/pdf/10.1002/asl2.423
“In recent years, winter westerly winds over the Beaufort Sea and summer anticyclonic circulation over the Arctic toward the Fram Strait have contributed to accelerated decreases in sea ice over areas east of Europe and north of Alaska. In particular, recent strong anticyclonic circulation has caused an accelerating decrease in the Arctic sea ice in summer. … The dominance of summer anticyclonic circulation over the Arctic and the reduced SIE over eastern Siberia and the north of Alaska were similar to the results of Ogi et al. (2008), who demonstrated that the dramatic changes in Arctic SIE in 2007 were produced by [wind-driven] Ekman drift of sea ice out of the marginal seas to the central Arctic.”
I remembered the fuss they made over the low SIE at the time, and then hearing about unusual winds causing it. Fortunately a search on that brought up the above excellent article. It’s actually better than I expected, since the authors are trying to understand the phenomenon in a larger context – one might even say “global?” Well, hemispheric, anyway.
” Notice that there are 2 outlier years — 2007 and 2012 — that fall below the previous cluster of low sea ice years during the 1930s, ”
Really? I see four, maybe more. So you agree that modern ice is less than the 1930s. Also, all the ‘observed’ data points are at or below the reconstructed equivalent after around 2004, which is why you removed that plot (Trick 1). Why would you prefer a reconstructed regression to real observed data? I think I know the answer.
Trick 2 would be pretending Greenland is the whole Arctic. Trick 3 would be not giving a link to the paper, I don’t think you want people to read that, or even the abstract
“This reconstructed SIE shows a substantial decrease in the 1930–1940s with a minimum occurring in 1936, which, however, is only a *half of the decline in 2012*. The strong relationship between the summer SAT and September SIE was used to assess the onset of summer sea ice disappearance in the Arctic Ocean. According to the estimates made with a simple regression model, we can expect a seasonally ice‐free Arctic Ocean *as early as in the mid‐2030s*. ”
Do you agree with Alekseev’s prediction? Or is your use for his work confined to reposting manipulated graphs?
It would appear from using the same reconstructed values throughout (rather than doing what you prefer – mixing data sources) that the 2012 sea ice extent (in blue, here) was a little lower than the ice extent in the 1930s. So yes, one year had lower values.
Uh, Philip, I didn’t remove any plot. The graph appears exactly as shown in the Connolly et al. (2017) paper, which is clearly described on the bottom line of the graph itself:
“Alekseev et al., 2016 (reconstructed September Arctic sea ice extent, 1900-2013) as shown in Connolly et al., 2017” Did you miss that? Or do you not have access to the Connolly paper? Perhaps you should take it up with Connolly et al. (2017) that they used the blue data points (see link below) rather than mixing the blue with the red since the blue represents 114 years of continuous data and the red only includes the 34 years between 1980-2013.
https://notrickszone.com/wp-content/uploads/2018/04/Arctic-Sea-Ice-Extent-1900-2013-Alekseev-2016.jpg
I know that you and your kind like to mix and match data sources so as to “hide the decline” and utilize “Mike’s Nature Trick” and make hockey sticks that don’t actually exist and the like, but that’s not considered acceptable when we have access to the same data sources for a long-term reconstruction. Otherwise, we get this…
https://notrickszone.com/wp-content/uploads/2017/08/Hide-the-Decline-Using-Mikes-Nature-Trick.jpg
…or this…
https://notrickszone.com/wp-content/uploads/2017/08/Holocene-Cooling-Northern-Hemisphere-Briffa-2002-Divergence.jpg
If the reconstruction for the earlier years is considered accurate, why switch to different data sources rather than using the same data throughout? Of course, it’s because using the same data throughout doesn’t reveal what you want it to. So you accept the reconstructed data when it suits your purposes, but you reject it and use “tricks” when it doesn’t. And here you are complaining about “tricks” yourself.
You’ll need to point out where I “pretended” or even wrote that Greenland is “the whole Arctic”. Since I didn’t, it would appear you have been caught fabricating. Why are you doing that?
Do you have a problem with Ding et al. (2018) writing that there has been a warming hiatus since 2005 in Ny-Ålesund, an area that “could represent most Arctic areas, especially the Atlantic-Arctic sector. … Especially air temperature, the record of Ny-Ålesund can capture the variation of surface temperature over most of [the] Arctic“? Do you think Ding et al. (2018) are wrong about Ny-Ålesund representing “most of the Arctic”?
Not giving a link to what paper? Alekseev et al. (2016)? The link is clearly provided below the graph, Philip! Are you fabricating this claim too, or did you just fail to look beneath the graph, where the link to the Connolly paper (which you apparently didn’t know is where the graph came from) is also placed.
So all three “tricks” that you have identified here are either false accusations (1. I didn’t remove any plot, 2. I did include the link to the Alekseev et al. paper) or complete fabrications (I never wrote or “pretended” that Greenland is “the whole of Antarctica”).
You have just been caught issuing false accusations or fabrications, Philip Clarke, and yet you expect us to take your charges of “tricks” seriously. It would be advisable to examine your motives and the truthfulness of what you’re writing before posting, Philip.
Considering the trends in Arctic sea ice have been closely tracking the AMO, no, I don’t expect that we will have an ice-free Arctic by the mid-2030s.
Please identify the graph that has been “manipulated” here. Or is this another jab at the Connolly graph of reconstructed values from Alekseev for 1900-2013? For that matter, there are 3 other graphs of Arctic-region sea ice included in the article. Are those wrong too…since they don’t support your beliefs?
By the way, you’ve never answered my question(s) from last week’s post. Do you believe that 50% or 100% of the post-1979 Southern Ocean cooling and sea ice growth in Antarctica is human-caused? You’ve been asked this question again and again, but each time you refuse to answer it. Why?
Kenneth, your point about tricks and hockey sticks was well taken. That was exactly my concern about mixing different data, and you dealt with it handily. Very nice.
In general I agree with B&t about DNFTT, but exposing their disinformation and deceitful tactics can be useful, especially if skillfully done.
Yes, that’s why I welcome SebastianH’s and Philip Clarke’s contributions…as long as they don’t cross the line into personal attacks and ad homs and fabricated quotes and links to falsified graphs (i.e., Mann’s hockey stick). SebastianH routinely helps to demonstrate the vacuousness of those advocating alarm with regard to modern day climate changes.
Of note is Philip Clarke’s fabrication that I have written that Greenland represents “the whole of the Arctic”, or that I didn’t include a link to the Alekseev paper (I clearly did), or that I removed the plot from the Alekseev graph (I didn’t — the graph of the 1900-2013 reconstruction shown in red is found in Connolly et al., 2017). In other words, every single charge of “tricks” was demonstrably false. We’ll see if he has the integrity to acknowledge these falsehoods. I doubt it, but am willing to wait and see.
Ehm, you really think you are somehow strengthening the skeptic argument with your posts and comments by replying as you routinely do?
Kenneth you do a very good job at showing to what lengths skeptics go to construct a view of the world that doesn’t exist. It’s not even about “who has the best facts” anymore, it’s about “who you can trust”. For you, mainstream science can’t be trusted and your claim is simply to trust the outliers. That is weird, especially in the light of your regular misunderstandings of math/physics and misinterpretations of what papers are saying, the confusion about derivatives and the SMB/ice loss thing.
Well, please continue. I am sure your loyal followers will find it great to be deceived and disinformed and continue to live happily ever after in this bubble of yours 😉
I beg to differ with the viewpoint that the belief that humans exert fundamental (100% attribution) control over the melting of ice sheets and the raising or lowering of sea levels or the temperatures of the deep oceans by emitting more or less fossil fuels is a “mainstream” view. Even a staunch alarmist like Eric Steig wrote that 50% of scientists don’t agree that the evidence is strong that anthropogenic influences prevail in Antarctica…and more and more scientists are agreeing that 50% of Arctic climate changes are natural. See the Steig response to comment #26:
http://www.realclimate.org/index.php/archives/2015/11/so-what-is-really-happening-in-antarctica/
“I think the evidence that the current retreat of Antarctic glaciers is owing to anthropogenic global warming is weak. The literature is mixed on this, about 50% of experts agree with me on this.”
Your belief that 100% of polar climate changes are human-caused is not “mainstream”, SebastianH. But you go right on ahead and keep believing that anyway. That’s why I think you have so much to offer us by commenting here. Your lack of ability to support your 100% attribution views are a testament to the weakness of your position…and we get to expose that routinely.
Oh, and if you continue to refer to that paper, please re-read it and at least use the actual result of the work (graph) they have done in that paper. And then explain why temperature based proxies to calculate the sea ice extent (Alekseev) or adjust reconstructions (Conolly) are good enough.
These are their results:
https://www.tandfonline.com/na101/home/literatum/publisher/tandf/journals/content/thsj20/2017/thsj20.v062.i08/02626667.2017.1324974/20170612/images/large/thsj_a_1324974_f0010_oc.jpeg
(c) is the summer extent … anything special about the year 1979?
These are their results:
“According to this new dataset, the recent period of Arctic sea ice retreat since the 1970s followed a period of sea ice growth after the mid 1940s, which in turn followed a period of sea ice retreat after the 1910s. Our reconstructions agree with previous studies that have noted a general decrease in Arctic sea ice extent (for all four seasons) since the start of the satellite era (1979). However, the timing of the start of the satellite era is unfortunate in that it coincided with the end of several decades during which Arctic sea ice extent was generally increasing. This late-1970s reversal in sea ice trends was not captured by the hindcasts of the recent CMIP5 climate models used for the latest IPCC reports, which suggests that current climate models are still quite poor at modelling past sea ice trends.”
“current climate models are still quite poor at modelling past sea ice trends.””
Heck, if they can’t model the AMO, what the heck use are they.
Trouble is that when they hindcast, they try to match temperatures that have intentionally had the 1940’s peak squashed.
They can NEVER be correct.
I am not believing anything like that. I do however believe that you are wrong in almost everything because you tend to misinterpret everything in such a way that is conforms with your perceived reality.
Kenneth, I have no problem with continuing to “explain” to your why attribution works differently than you seem to imagine it does. Still have a problem with greater than 100% values? Still wondering how 100+% of global warming could be attributed to one variable, yet some region’s warming can be caused by less than that? This ignorance is what you are exposing.
Just look at their graphs and put what you quoted in a littlebit of context. Another prime example of you just picking what fits your world view and ignoring the rest …
So you only believe that 100% of the warming and sea ice losses in the Arctic are human-caused, right? So what percentage of the Southern Ocean cooling and sea ice growth since 1979 is human-caused, SebastianH? How does the 100% attribution you believe in work in the Southern polar climates? Especially since even your own scientists write the evidence for an anthropogenic influence on glacier melt is “weak” for that hemisphere?
http://www.realclimate.org/index.php/archives/2015/11/so-what-is-really-happening-in-antarctica/
“I think the evidence that the current retreat of Antarctic glaciers is owing to anthropogenic global warming is weak. The literature is mixed on this, about 50% of experts agree with me on this.” (comment #26 reply, Dr. Eric Steig)
Uh, yes, I am exposing that ignorance. Did you mean to write that?
https://notrickszone.com/wp-content/uploads/2018/04/Arctic-Sea-Ice-Extent-1900-2013-Alekseev-2016.jpg
Here’s the image for Figure 1.3. Notice that there are 2 outlier years — 2007 and 2012 — that fall below the previous cluster of low sea ice years during the 1930s, when the Arctic was just as warm as it is today. Can we assume, Philip, that it is your belief that human CO2 emissions caused the low sea ice extent during those 2 years (2007, 2012), then? Do you believe that human CO2 emissions caused closer to 50% of the Arctic sea ice decline those years, or do you believe in 100% attribution?
Scientists have attributed the high ice melt in the Arctic during 2012 not to anthropogenic CO2 emissions, as you believe, but to storm surges.
—
https://agupubs.onlinelibrary.wiley.com/doi/full/10.1002/grl.50349
“Not only did the major August 2012 storm facilitate the melt of sea ice by bringing to the Arctic heat and moisture from the south, but by shearing off a sizeable segment of the ice (approximately 0.4 × 10⁶ km2), it further led to an accelerated ice‐cover decay.”
—
The record melt of the Greenland ice sheet was facilitated by changes in the jet stream…
—
http://www.redorbit.com/news/science/1112875668/jet-stream-caused-greenland-ice-sheet-melt-2012-061713/
“According to University of Sheffield research, published in the International Journal of Climatology, unusual Jet Stream changes were behind record surface melt of the Greenland Ice Sheet last summer. ”
—
…and thin cloud cover.
—
https://news.wisc.edu/thin-clouds-drove-greenlands-record-breaking-2012-ice-melt/
Thin clouds drove Greenland’s record-breaking 2012 ice melt
—
And the 2007 sea ice low extent has been attributed to unusually strong (+500% anomaly!) solar heat absorption rather than anthropogenic CO2 emissions, as you believe.
—
http://onlinelibrary.wiley.com/doi/10.1029/2008GL034007/full
Abstract: The summer extent of the Arctic sea ice cover, widely recognized as an indicator of climate change, has been declining for the past few decades reaching a record minimum in September 2007. The causes of the dramatic loss have implications for the future trajectory of the Arctic sea ice cover. Ice mass balance observations demonstrate that there was an extraordinarily large amount of melting on the bottom of the ice in the Beaufort Sea in the summer of 2007. Calculations indicate that solar heating of the upper ocean was the primary source of heat for this observed enhanced Beaufort Sea bottom melting. An increase in the open water fraction resulted in a 500% positive anomaly in solar heat input to the upper ocean, triggering an ice–albedo feedback and contributing to the accelerating ice retreat.
Conclusions: There was an extraordinarily large amount of ice bottom melting in the Beaufort Sea region in the summer of 2007. Solar radiation absorbed in the upper ocean provided more than adequate heat for this melting. An increase in the open water fraction resulted in a 500% positive anomaly in solar heat input to the upper ocean, triggering an ice–albedo feedback and contributing to the accelerating ice retreat.
—
http://onlinelibrary.wiley.com/doi/10.1002/2015GL064541/abstract
High-resolution measurements of ocean temperature and salinity in the Arctic Ocean’s Canada Basin reveal the importance of the release of solar-derived stored ocean heat on sea-ice growth. Locally-absorbed summer solar heat is stored in a Near Surface Temperature Maximum (NSTM) layer underlying the mixed layer. The heat content of the NSTM layer was anomalously large following summer 2007, which saw considerable sea-ice losses and intense solar absorption into the exposed surface ocean. Measurements provide evidence for the entrainment of NSTM-layer heat in fall/winter 2007–08 by shear-driven mixing, and convective mixing by the release of dense, salty plumes during sea-ice growth. While at least a portion of the NSTM-layer was eroded, deeper warm ocean layers remained unaffected. It is shown that the release of solar heat stored following summer 2007 was sufficient to have reduced sea-ice thickness at the end of the 2008 growth season by about 25%.
—
But do tell us, Philip, why these scientists are wrong, and the reason why the 2007 and 2012 sea ice extents were so low mostly (50%-100%) has to do with anthropogenic CO2 emissions. That is what you believe, right?
I owe you an apology, I missed the link to the Alekssev paper. You deviated from the usual modus of giving the graph but no link. It is a challenge to step through all the Gish Gallop of selective quotation.
“The record melt of the *Greenland* ice sheet was facilitated by changes in the jet stream…”
Not the Arctic.
Thin clouds drove *Greenland*’s record-breaking 2012 ice melt
Not the Arctic.
I don’t see it matters much whether you or Connolley et al removed the observational data from the plot, fact it, it was removed. A good sceptic considers *all* the data, he does not remove observational data just because it contradicts an agenda.
Yes 2012, and 2007 were extremes for SIE, you could say the same about minima in the 1930s. Just as the 2016 El Nino was warmer than the 1998, we see increasing maxima in temperatures and minima in Arctic Sea Ice.
Short term natural variability over a long term anthropogenic trend. Really not that difficult a concept.
Uh, it was “removed” because the “observational data” start year is 1980 for the Alekseev paper, and the Connolly paper is about extending Arctic sea ice extent back to before the satellite era using Arctic temperatures. They show the blue data only from the Alekseev paper due to the obvious issue of not having satellite data that extends back to 1900. So again, I didn’t remove anything. You falsely accused me of doing so, and then called it a “trick”. Now that you have been caught making false accusations, it would be appreciated if you acknowledged this “mistake”.
Greenland is the largest land mass in the Arctic, of course, but notice that I didn’t write (or pretend) that Greenland “is the whole of the Arctic”. You falsely claimed I wrote that. Do you deny this was a fabrication? I don’t appreciate having you make up statements and attributing them to me. It’s not honest. Debate fairly and honestly, Philip. And did you miss this in your selection of quotes about the 2012 and 2007 sea ice extent causes?
KR: “Scientists have attributed the high ice melt in the Arctic during 2012 not to anthropogenic CO2 emissions, as you believe, but to storm surges.”
—
https://agupubs.onlinelibrary.wiley.com/doi/full/10.1002/grl.50349
“Not only did the major August 2012 storm facilitate the melt of sea ice by bringing to the Arctic heat and moisture from the south, but by shearing off a sizeable segment of the ice (approximately 0.4 × 10⁶ km2), it further led to an accelerated ice‐cover decay.”
—
Or the two links to papers about the +500% positive solar absorption heat anomaly as the causal mechanism for the 2007 low?
—
http://onlinelibrary.wiley.com/doi/10.1029/2008GL034007/full
http://onlinelibrary.wiley.com/doi/10.1002/2015GL064541/abstract
—
A long-term anthropogenic trend? It would appear to be more like an oscillation. Is there a long-term anthropogenic trend for the growth in Antarctic sea ice and Southern Ocean cooling since 1979, Philip? What percentage of the cooling and sea ice growth was anthropogenic? 50%? 100%? You say anthropogenic influences on polar sea ice is not a difficult concept to understand. So why won’t you answer this attribution question?
And by the way, when you write of long-term anthropogenic trends, could you identify the anthropogenic signal in this plot of Arctic sea ice for the Holocene? Let’s see what you come up with.
https://notrickszone.com/wp-content/uploads/2018/04/Holocene-Arctic-Sea-Ice-Western-Arctic-Ocean-9500-yrs-ago-to-2001-AD-McKay-2008.jpg
McKay et al., 2008
Hmmm. I remember your claim of ‘No warming in Central Canada’. Supported by a graph carefully extracted from Viau and Gajewski. A paper that concluded:
“Our results show that at no time during the Holocene have millennial-scale temperature variations exceeded 10.78C in boreal Canada (Table 1). These results therefore show that presently observed temperature increases in northern Canada far exceed natural variability found in this study (Solomon et al. 2007), providing paleoclimatic support for human cause of the present day global warming.”
So, one is disinclined to be lectured on ‘honesty’.
Good luck, and goodbye.
You’ve been caught fabricating or engaging in dishonesty again, Philip Clarke. Notice that your quote makes reference to “northern Canada” as having temperature rate changes that fall outside the range of natural variability.
“These results therefore show that presently observed temperature increases in northern Canada far exceed natural variability found in this study”
The graph that I used and wrote about (“no warming”) was for Central Canada. Here it is:
https://notrickszone.com/wp-content/uploads/2017/02/Holocene-Cooling-Canada-Central-Viau-and-Gajewski-09.jpg
The Central Canada graph, Fig. 4, can be found on page 320 here in the paper: https://journals.ametsoc.org/doi/pdf/10.1175/2008JCLI2342.1
Here’s what the authors write about Central Canada:
“July temperatures in central Canada remained similar to today during the past 2 ka, except for a brief period of warmer conditions centered at 1 ka (Fig. 4). January temperatures were relatively high prior to 1 ka, and steadily decreased during the past 1000 yr. Annual precipitation anomalies vary about zero, with relatively dry periods centered on 0.5 and 1.4 ka.”
There are 4 regions identified in the paper. The Northern Canada record is encompassed by the “MacKenzie region”. Unlike the other reconstructions, it does include an uptick towards the end of the record (see Fig. 5). Here’s the graph of the Northern Canada region that shows this gargantuan anthropogenic signal (notice that enormous uptick at the end, Philip):
https://notrickszone.com/wp-content/uploads/2018/04/Holocene-Cooling-Northern-Canada-MacKenzie-Region-Viau-Gajewski-2009.jpg
Given your track record, I will assume that you purposely refused to acknowledge the fact that I clearly identified Central Canada so that you could fabricate a narrative that I have misrepresented what the authors wrote about Central Canada. Why did you fabricate, Philip?
Just so you know, as I assume you’ve misinterpreted what the quote you used actually means, the authors are saying that the variability rate (i.e., the temperature change per century/millennium) for Northern Canada far exceeds natural background. For Northern (boreal) Canada, the recent rate of change has been fast. They are not saying that the modern temperature increase is higher in magnitude than at any time in the Holocene. They’re just talking about the variable rate, and saying that it’s fast…for Northern Canada, anyway. Understand?
“Our results show that at no time during the Holocene have millennial-scale temperature variations exceeded 0.7C in boreal Canada (Table 1). These results therefore show that presently observed temperature increases in northern Canada far exceed natural variability”
Philip, you have once again been caught writing things that are untrue. Do you have the intellectual honesty to acknowledge this, or will you pridefully abscond, refusing to admit your “error”?
Oh, another cherry pick of yours? What about the rest of Canada?
https://www.canada.ca/en/environment-climate-change/services/climate-change/trends-variations/summer-2017-bulletin.html
You do it all the time and nobody notices, because nobody bothers to actually read the papers you are referencing … creative misinterpretations..
Here’s the graph for Central Canada from the Viau and Gajewski (2009) paper that I correctly referred to as a region with “no warming.”
https://notrickszone.com/wp-content/uploads/2017/02/Holocene-Cooling-Canada-Central-Viau-and-Gajewski-09.jpg
Here’s the graph of Northern Canada from the paper that Philip Clarke apparently believes shows clear evidence of anthropogenic influences (see that little uptick at the end – we did that!) and thus I was misrepresenting what the paper said:
https://notrickszone.com/wp-content/uploads/2018/04/Holocene-Cooling-Northern-Canada-MacKenzie-Region-Viau-Gajewski-2009.jpg
Identify these “all the time” instances, then, SebastianH. The last time I asked you to back up this accusation you failed to come up with anything and we had to conclude you were just fabricating another accusation. You wrote that I misrepresented the 500 papers that support a skeptical position on climate alarm for 2016 and 2017, and you said you established that by reading the “first few” papers and identifying misrepresentations. So I asked you to identify where I misrepresented the “first few” papers after kindly providing you with links to the lists for 2016 and 2017 (where you said you found them after reading the “first few”). And what did you come up with? Nothing, of course. You were just making it up. Just as Philip Clarke has here been caught doing the same. But if you’re going to hurl such an accusation at me (that I write things that are dishonest), then back it up. Name the instance(s). Let’s see what you come up with.
Cherry picking doesn’t meant that you are posting something wrong. Only that you are using very limited data to make a point that is at odds with reality. At least for those who see the big picture (e.g. not skeptics).
Just a short list:
– you go on and on about SMB causing a net reduction of sea level in Antarctica (and sometimes Greenland), completely ignoring that SMB is not the total ice mass balance
– you routinely mentioned that human emissions aren’t increasing the CO2 concentration because those emissions didn’t increase for several years in a row, but concentration did.
– net effect of cloud cover changes
– “interesting” TSI reconstructions
– assuming that CO2 does nothing to water heat content because we don’t have an experiment that shows this for the Earth system (this one you like the most, I think)
– cooling regions vs. global warming
– making fun of attribution claiming greater than 100% can’t be possible
– posting graphs from papers to make claims, while completely ignoring other graphs or conclusions in those papers. Almost as if you could chose only what you like from science and whatever else the paper says that contradicts your views, well … let’s ignore them.
And so on …
*sigh* … provide a better search function for this blog.
I could predict how you’ll likely reply to this … something about me being dishonest and giving you the opportunity to always set the record straight. It’s kind of sad that you don’t realize that your cherry picking and misinterpretations are the problem. You sound like a reasonable person, but you can’t be reasoned with.
Not surprisingly, just about everything you wrote here is a purposeful misrepresentation of what I have actually written. It’s just not worth my time to respond.
As I have written before and you yourself have astutely commented, Kenneth, he’s just up to mischief. He’s a tiresome boor, with nothing but repeated falsehoods to offer. I’ve stopped reading his material, except for a few things related to some of what you or Andy and a few others address. Even that is getting old, and will soon stop.
You can always tell an ideologue, because he will NEVER expose his own humanity. If someone is that invested in the narrative, they are beyond reaching by facts and reason. Very sad.
You do have to wonder what sort of pathetic life he leads, being a zero-science troll on a board that unanimously considers him as nothing but a mindless nil-educated drone.
While shipping gets stuck in ice on Lake Superior, warmists are still ‘stuck on stupid’.
https://realclimatescience.com/2018/04/frozen-minnesotans-believe-the-arctic-is-hot/
How did it all get so bas-ackwards !!
A decrease in Arctic sea ice, a RECOVERY from the anomalous LIA extremes and similar late 1970s extent..
…would be absolutely beneficial for the whole region.
Yet this natural recovery has been co-opted by the anti-CO2 brigade as being a BAD thing.
ZERO evidence humans have any affect on Arctic sea ice, (except soot and ice-breakers)
Same with enhanced atmospheric CO2.
A MASSIVE BENEFIT to all life on Earth,
ZERO evidence of any downside of continued increase to 1000+ ppm
Yet somehow co-opted by the AGW scaremongers as their “demon”
The whole thing is quite BIZARRE in a surrealistic kind of way.
How did the planet become so short-sighted and mal-informed??.
How did this moronic, zero-science anti-CO2 agenda ever get off the ground.??
As everyone should be well aware of by now, There is absolutely no anthropogenic signal in the Satellite temperature data either.
The ONLY warming has come from El Ninos which cannot, in any possible way, be influenced by human anything.
Between those El Ninos, even in RSSv$, there is NO WARMING.\
No warming from 1980-1997
https://s19.postimg.cc/kr0uu9cz7/RSS_V4_before_El_Nino.png
No warming from 2001-2015
https://s19.postimg.cc/jcuv319ir/RSS_V4_2001_-_2015.png
There is IN FACT absolutely NO anthropogenic signal in any real data, except UHI/airport effects in badly positioned surface stations.
Plenty of anthropogenic agenda signal in anything from the NCDC stable, (There’s at least 4 of them based on that farcical not-data) but that is not real warming.
AndyG65
I am with you, and the quote from the paper that attributes the loss to the wind, which in turn pushes the ocean into the Arctic.
This is what occurs when increased heat is released from the mid latitude’s, EPTG which is also an increase in pressure gradient.
The years 2007, 2012 and to a slightly lesser extent (no pun) 2016 witnessed a bias of atmosphere displacement toward the Arctic because of blocking mechanisms in the SH. But the trick is, how does one measure this annual hemisphere displacement bias.
Perhaps the other chart jockeys commenting here should start looking, instead of squabling over other folks work, and trends without a known cause.
There is zero human signature in the Arctic ice trend.
Regards
Here’s new paper that further undermines “consensus science
A paper just published by the Journal of Climate concludes that high estimates of future global warming from most computer climate simulations are inconsistent with observed warming since 1850. The implication is that future warming will be 30 to 45% lower than suggested by the simulations.
The study estimates climate sensitivity — how much the world will warm when carbon dioxide levels increase* — from changes in observed temperatures and estimates of the warming effect of greenhouse gases and other drivers of climate change, from the mid/late 19th century until 2016.
The paper also addresses previous criticisms of the methodology used, finding that these are unfounded.
Nicholas Lewis explains,
“Our results imply that, for any future emissions scenario, future warming is likely to be substantially lower than the central computer model-simulated level projected by the IPCC, and highly unlikely to exceed that level.”
Nicholas Lewis adds,
“Our new sensitivity estimates are slightly lower than those obtained in a predecessor study published several years ago, despite the inclusion of the strong 2015–16 El Niño warming. Importantly, the upper uncertainty bounds of the new estimates are much lower.”
Nicholas Lewis and Judith Curry, 2018: The impact of recent forcing and ocean heat uptake data on estimates of climate sensitivity. Journal of Climate, Early Online Release [https://doi.org/10.1175/JCLI-D-17-0667.1]
Abstract
Energy budget estimates of equilibrium climate sensitivity (ECS) and transient climate response (TCR) are derived based on the best estimates and uncertainty ranges for forcing provided in the IPCC Fifth Assessment Scientific Report (AR5). Recent revisions to greenhouse gas forcing and post-1990 ozone and aerosol forcing estimates are incorporated and the forcing data extended from 2011 to 2016. Reflecting recent evidence against strong aerosol forcing, its AR5 uncertainty lower bound is increased slightly. Using a 1869–1882 base period and a 2007−2016 final period, which are well-matched for volcanic activity and influence from internal variability, medians are derived for ECS of 1.50 K (5−95%: 1.05−2.45 K) and for TCR of 1.20 K (5−95%: 0.9−1.7 K). These estimates both have much lower upper bounds than those from a predecessor study using AR5 data ending in 2011. Using infilled, globally-complete temperature data gives slightly higher estimates; a median of 1.66 K for ECS (5−95%: 1.15−2.7 K) and 1.33 K for TCR (5−95%:1.0−1.90 K). These ECS estimates reflect climate feedbacks over the historical period, assumed time-invariant. Allowing for possible time-varying climate feedbacks increases the median ECS estimate to 1.76 K (5−95%: 1.2−3.1 K), using infilled temperature data. Possible biases from non-unit forcing efficacy, temperature estimation issues and variability in sea-surface temperature change patterns are examined and found to be minor when using globally-complete temperature data. These results imply that high ECS and TCR values derived from a majority of CMIP5 climate models are inconsistent with observed warming during the historical period.
[…] Read more at notrickszone.com […]