Since 2015, at least 18 papers have been published suggesting the frequency and intensity of extreme weather events — droughts, floods, and storms — have either been reduced or no detectable trend is indicated for recent decades. This directly contradicts the claim that the frequency and intensity of extreme weather events will worsen due to rising CO2 concentrations.
Below is a list of 18 peer-reviewed scientific papers indicating that there has been no detectable increase — and in many cases there has been a decrease — in the frequency and intensity of extreme weather events (floods, droughts, storms) in recent decades.
Scientists have found that more frequent instances of unstable and intense weather occurred during cool periods such as the Little Ice Age (approximately 1300 to 1900 A.D). Warmer periods such as the Medieval Climate Anomaly (approximately 900 to 1200 A.D.) and the 20th/21st centuries were associated with a reduction of extreme weather events.
This warmer-climates-stabilize-weather conclusion finds experimental support in a 2015 paper published in the journal Science (full paper available here).
Entitled ‘”Constrained work output of the moist atmospheric heat engine in a warming climate”, Laliberté and co-authors use a heat engine model to detect how warming affects work intensity, or the capacity for the hydrological cycle to produce “very intense storms”. They found that warming constrained the hydrological cycle’s ability to generate “global atmospheric motion”, which effectively means that warming has a stabilizing and calming effect with regard to generating energy for storms and precipitation extremes (droughts and floods).
“Global warming is expected to intensify the hydrological cycle, but it might also make the atmosphere less energetic. Laliberté et al. modeled the atmosphere as a classical heat engine in order to evaluate how much energy it contains and how much work it can do (see the Perspective by Pauluis). They then used a global climate model to project how that might change as climate warms. Although the hydrological cycle may increase in intensity, it does so at the expense of its ability to do work, such as powering large-scale atmospheric circulation or fueling more very intense storms.”
“Incoming and outgoing solar radiation couple with heat exchange at Earth’s surface to drive weather patterns that redistribute heat and moisture around the globe, creating an atmospheric heat engine. … On a warming Earth, the increase in perceptible water has been identified as a reason for the tropical overturning to slow down, and studies over a wide range of climates suggest that global atmospheric motions are reduced in extremely warm climates.”
In sum, there is little to no support for the position that anthropogenic global warming results in more extreme weather events. The validity of the “dry gets dryer, wet gets wetter” paradigm has not been affirmed (Greve and Seneviratne, 2015, Byrne and O’Gordon, 2015).
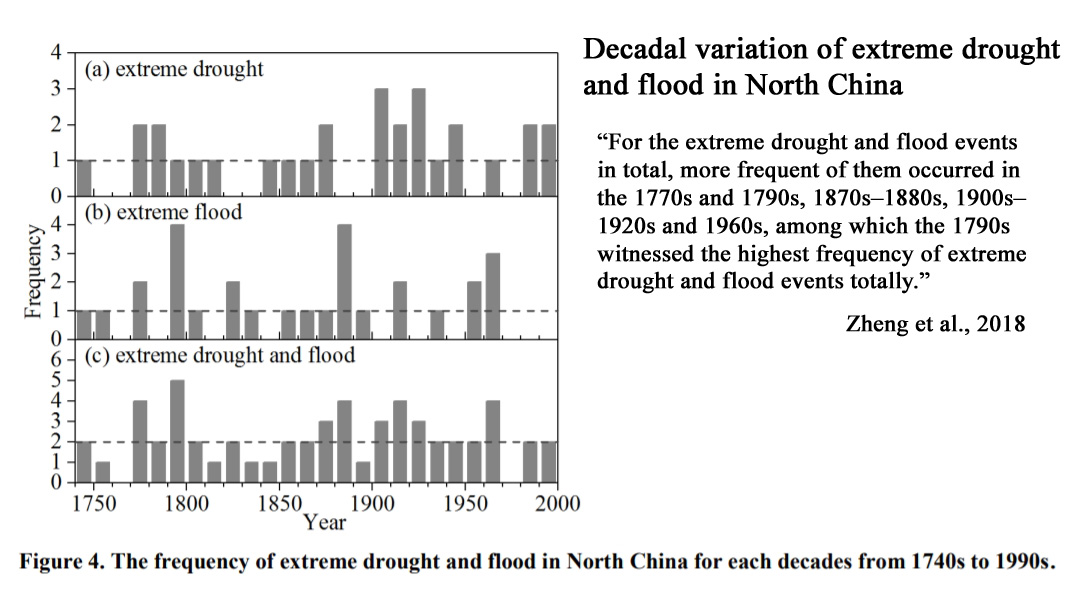
1. Highest Extreme Drought, Flood Events Occurred In 1790s
“For the extreme drought and flood events in total, more frequent of them occurred in the 1770s and 1790s, 1870s–1880s, 1900s–1920s and 1960s, among which the 1790s witnessed the highest frequency of extreme drought and flood events totally.”
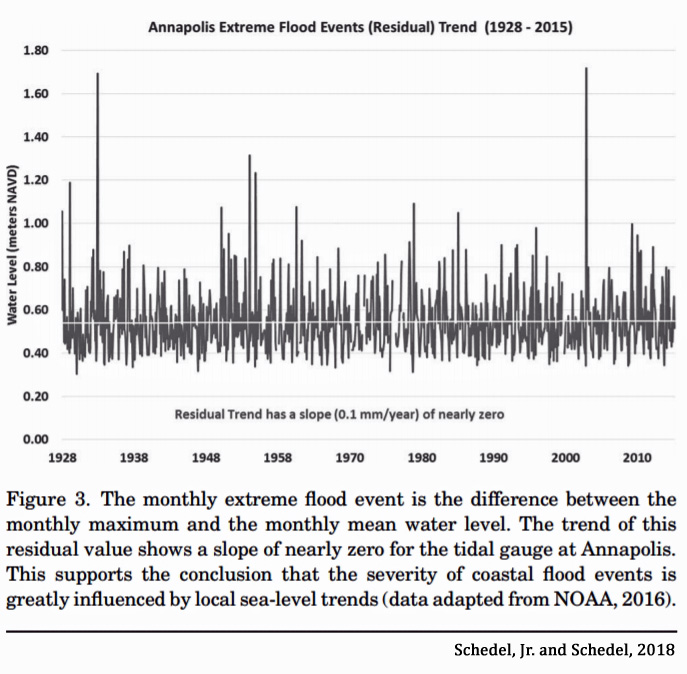
2. Flood Events ‘Are Not Getting Stronger Or Occurring More Frequently’
Schedel, Jr. and Schedel, 2018
“Flood events on the U.S. East Coast are not more severe or frequent than in the past. However, because of sea-level rise, these events are starting from a higher baseline height. Thus, the same severity of a flood event today reaches a greater absolute height than an identical flood would have reached 50 or 100 years ago. Based on current data, the good news is that the apparent worsening of flood events is due to a single, primary cause: sea level rise. Flood events are not getting stronger or occurring more frequently than in the past. They are instead starting from a higher point, allowing them to reach higher levels more often. The bad news is that sea-level rise will be a fact of life for many years into the future. Communities need to start now to make informed plans and decisions about how best to adapt.”
3. 7 Flood Events/Century During 1550-1948, 2 Flood Events/Century During 1949-2000
“This study presents a chronology of historical and measured flood events in the Papaloapan River basin of Mexico during 450 years. Twenty-eight historical floods were recorded during the period 1550–1948 [7 per century] on this river and one flood event (1969) in the instrumental era (1949–2000) [2 per century], of which 14 were extraordinary floods and only 15 were catastrophic ones. There were several flood-rich decades during 1860–1870, 1880–1890, 1920–1930 and 1940–1950. Wavelet analysis found a significant flooding periodicity of 58 years. The wavelet coherence analysis found that flooding had an in-phase relationship with the Atlantic Multidecadal Oscillation and also with the Pacific Decadal Oscillation. Logistic regression corroborated that there exists a positive relationship between floods events and these two natural climatic oscillations. The logistic regression model predicted correctly 92% of flood events.”
4. Less Storm And Hail Frequency May Occur With Warming
“The Tibetan Plateau (TP), one of the world’s most sensitive areas to climate change, became significantly warmer during recent decades. Since 1960 (1980), storm (hail) days have been decreasing by 6.2%/decade (18.3%/decade) in the region. … Based on 53‐year continuous weather records at 48 TP stations and reanalysis data, we show here for the first time that the consistent decline of storm days is strongly related to a drier midtroposphere since 1960. Further analysis demonstrated that fewer hail days are driven by an elevation of the melting level (thermodynamically) and a weaker wind shear (dynamically) in a warming climate. These results imply that less storm and hail may occur over TP when climate warms.”
5. Changes In Flood Frequency And Magnitude Due To Enhanced Greenhouse Forcing “Not Generally Evident”
“The main objective of this paper is to detect the evidence of statistically significant flood trends across Europe using a high spatial resolution dataset. … Anticipated changes in flood frequency and magnitude due to enhanced greenhouse forcing are not generally evident at this time over large portions of the United States for several different measures of flood flows. … Thus, similarly to the main findings of Archfield et al. (2016) for the US, the picture of flood change in Europe is strongly heterogeneous and no general statements about uniform trends across the entire continent can be made.”
6. IPCC: “Globally There Is No Clear And Widespread Evidence Of Changes In Flood Magnitude Or Frequency”
“In the current study, trends in major-flood occurrence from 1961 to 2010 and from 1931 to 2010 were assessed using a very large dataset (>1200 gauges) of diverse catchments from North America and Europe … Overall, the number of significant trends in major-flood occurrence across North America and Europe was approximately the number expected due to chance alone. Changes over time in the occurrence of major floods were dominated by multidecadal variability rather than by long-term trends. There were more than three times as many significant relationships between major-flood occurrence and the Atlantic Multidecadal Oscillation than significant long-term trends. … The Intergovernmental Panel on Climate Change (IPCC) concluded (Hartmann et al., 2013) that globally there is no clear and widespread evidence of changes in flood magnitude or frequency in observed flood records. … North American trends in … frequency of extremes in the 1980s and 1990s were similar to those of the late 1800s and early 1900s. There was no discernible trend in the frequency of extreme events in Canada. The results of this study, for North America and Europe, provide a firmer foundation and support the conclusion of the IPCC (Hartmann et al., 2013) that compelling evidence for increased flooding at a global scale is lacking.”
7. “No Significant Trends” In Flood Frequency Or Heights
“[A] 122-year record of major flooding depths at the Rarawai Sugar Mill on the Ba River in the northwest of the Fijian Island of Viti Levu is analysed. … It exhibits no statistically significant trends in either frequency or flood heights, once the latter have been adjusted for average relative sea-level rise. This is despite persistent warming of air temperatures as characterized in other studies. There is a strong dependence of frequency (but not magnitude) upon El Niño-Southern Oscillation (ENSO) phase, with many more floods in La Niña phases. The analysis of this long-term data series illustrates the difficulty of detecting a global climate change signal from hazard data, even given a consistent measurement methodology (cf HURDAT2 record of North Atlantic hurricanes) and warns of the strong dependence of any statistical significance upon choices of start and end dates of the analysis.”
8. Drought Frequency Appears To Have Decreased During 1901-2014
“In this study, a monthly water-balance model is used to simulate monthly runoff for 2109 hydrologic units (HUs) in the conterminous United States (CONUS) for water-years 1901 through 2014. … Results indicated that … the variability of precipitation appears to have been the principal climatic factor determining drought, and for most of the CONUS, drought frequency appears to have decreased during the 1901 through 2014 period.”
9. “A Significant Decreasing Trend In Severe Weather” During 1961-2010
“Based on continuous and coherent severe weather reports from over 500 manned stations, for the first time, this study shows a significant decreasing trend in severe weather occurrence across China during the past five decades. The total number of severe weather days that have either thunderstorm, hail and/or damaging wind decrease about 50% from 1961 to 2010. It is further shown that the reduction in severe weather occurrences correlates strongly with the weakening of East Asian summer monsoon which is the primary source of moisture and dynamic forcing conducive for warm-season severe weather over China.”
10. “The Most Frequent Climate Instability” Associated With Global Cooling
“Numerical experiments using a fully coupled atmosphere-ocean general circulation model with freshwater hosing in the northern North Atlantic showed that climate becomes most unstable in intermediate glacial conditions associated with large changes in sea ice and the Atlantic Meridional Overturning Circulation. Model sensitivity experiments suggest that the prerequisite for the most frequent climate instability with bipolar seesaw pattern during the late Pleistocene era is associated with reduced atmospheric CO2 concentration via global cooling and sea ice formation in the North Atlantic, in addition to extended Northern Hemisphere ice sheets.”
11. Frequency Of “All Mexico” Droughts Have Not Increased In Recent Decades
“The El Niño/Southern Oscillation (ENSO) is the most important ocean-atmospheric forcing of moisture variability detected with the MXDA. … [A]nalyses based on the millennium climate simulations with the Community Earth System Model suggest that the moisture balance during the winter, spring, and early summer over northern Mexico may indeed be particularly sensitive to ENSO forcing. Nationwide drought is predicted to become more common with anthropogenic climate change, but the MXDA reconstructions indicate that intense “All Mexico” droughts have been rare over the past 600 years and their frequency does not appear to have increased substantially in recent decades.”
12. “The Net Effect Of Climate Change Has Made Agricultural Drought Less Likely”
“The current California drought has cast a heavy burden on statewide agriculture and water resources, further exacerbated by concurrent extreme high temperatures. Furthermore, industrial-era global radiative forcing brings into question the role of long-term climate change on CA drought. How has human-induced climate change affected California drought risk? The model simulations show that increases in radiative forcing since the late 19th Century induces both increased annual precipitation and increased surface temperature over California, consistent with prior model studies and with observed long-term change. As a result, there is no material difference in the frequency of droughts defined using bivariate indicators of precipitation and near-surface (10-cm) soil moisture, because shallow soil moisture responds most sensitively to increased evaporation driven by warming, which compensates the increase in the precipitation. However, when using soil moisture within a deep root zone layer (1-m) as co-variate, droughts become less frequent because deep soil moisture responds most sensitively to increased precipitation. The results illustrate the different land surface responses to anthropogenic forcing that are relevant for near-surface moisture exchange and for root zone moisture availability. The latter is especially relevant for agricultural impacts as the deep layer dictates moisture availability for plants, trees, and many crops. The results thus indicate the net effect of climate change has made agricultural drought less likely, and that the current severe impacts of drought on California’s agriculture has not been substantially caused by long-term climate changes.”
13. Flood Frequency Higher With Lower Solar Activity/Cooling
“Flood frequency in the discharge record is significantly correlated to changes in solar activity during solar cycles 16–23 (r = −0.47, p < 0.0001, n = 73) [1920s-2000s]. Flood frequency is higher when solar activity is reduced.[when cooling occurs]. These correlations between flood frequency and solar activity might provide empirical support for the solar top-down mechanism expected to modify the mid-latitude storm tracks over Europe by model studies. A lag of flood frequency responses in the Ammer discharge record to changes in solar activity of about one to three years could be explained by a modelled ocean–atmosphere feedback delaying the atmospheric reaction to solar activity variations up to a few years.”
14. “The Frequency Of Extreme Floods Has Decreased Since The 1950s”
“A compilation of 46 case studies across Europe with reconstructed discharges demonstrates that (1) in most cases present flood magnitudes are not unusual within the context of the last millennium, although recent floods may exceed past floods in some temperate European rivers (e.g. the Vltava and Po rivers); (2) the frequency of extreme floods has decreased since the 1950s, although some rivers (e.g. the Gardon and Ouse rivers) show a reactivation of rare events over the last two decades.”
15. Droughts More “Severe, Extensive, And Prolonged” Before The 20th Century
“Megadroughts reconstructed over north-central Europe in the 11th and mid-15th centuries reinforce other evidencefrom North America and Asia that droughts were more severe, extensive, and prolonged over Northern Hemisphere land areas before the 20th century, with an inadequate understanding of their causes.”
16. Sea Surface Temperature (Warming) “Does Not Significantly Affect Drought Intensity Or Frequency”
“SST forcing does not significantly affect drought intensity or frequency of occurrence, even for very persistent ‘megadroughts‘ of 15 yr or more in length. In both the CESM1.0.3 and NADA, with the exception of the Southeast United States, droughts in all regions have intensities, persistence lengths, and occurrence frequencies statistically consistent with a red noise null hypothesis. This implies that SST forcing is not the dominant factor in generating drought and therefore that many decadal megadroughts are caused by a combination of internal atmospheric variability and coupling with the land surface, with SST anomalies playing only a secondary role.”
17. For The Past Century, Drought Percentage “Has Not Changed” Despite Warming
“[F]or the past century %drought has not changed, even though global PET [potential evapotranspiration] and temperature (T) have increased.
18. High Storm Activity During Cold Periods, Low Storm Activity During Warm Years
“A comparison with North Atlantic and Western Mediterranean paleoclimate proxies shows that the phases of high storm activity occurred during cold periods, suggesting a climatically-controlled mechanism for the occurrence of these storm periods. Besides, an in-phase storm activity pattern is found between the Western Mediterranean and Northern Europe. Spectral analyses performed on the Sr content revealed a new 270-year solar-driven pattern of storm cyclicity. For the last 3000 years, this 270-year cycle defines a succession of ten major storm periods (SP) with a mean duration of 96 ± 54 yr. Periods of higher storm activity are recorded from >680 to 560 cal yr BC (SP10, end of the Iron Age Cold Period), from 140 to 820 cal yr AD (SP7 to SP5) with a climax of storminess between 400 and 800 cal yr AD (Dark Ages Cold Period), and from 1230 to >1800 cal yr AD (SP3 to SP1, Little Ice Age). Periods of low storm activity occurred from 560 cal yr BC to 140 cal yr AD (SP9 and SP8, Roman Warm Period) and from 820 to 1230 cal yr AD (SP4, Medieval Warm Period).”


CAUTION – CLIMATE EXTREMistS AHEAD
https://notalotofpeopleknowthat.wordpress.com/2018/07/05/june-not-the-driest-on-record/
It would be funny if they weren’t so seriously disturbed…
https://notalotofpeopleknowthat.wordpress.com/2018/07/05/scotland-sets-new-temperature-record-in-middle-of-car-park/
…and the negative consequences to humanity of their malicious behavior weren’t so potentially disastrous.
https://notalotofpeopleknowthat.wordpress.com/2018/07/03/activist-group-hopes-to-sue-the-uk-government-over-climate-change/
Climate EXTREMistS do not have heads that think rationally.
How could they when their heads are in sand?
And they better get them out soon before those bloody sea levels swamp them.
typo, K
Warmer periods such as the Medieval Climate Anomaly (approximately 1900 to 1200 A.D.)
1900 ???????
Cheers
“Warmer periods such as the Medieval Climate Anomaly (approximately 900 to 1200 A.D.)”
MWP Only 300 years long.
Our current “slightly warm” period is barely 100 years long, (with a cooling scare from 1950-1970 dipping to late 1970s being the coolest period since the LIA)..
.. and already there are signs of the highly beneficial warming possibly heading back down. 🙁
Why are you lying?
http://woodfortrees.org/plot/gistemp/offset:-0.43/mean:12/plot/hadcrut4gl/offset:-0.26/mean:12/plot/rss/mean:12/offset:-0.13/plot/uah6/mean:12
Zero signs for this! Back it up if you make such a claim and let’s with what hilarious sources you come up with.
GISS is meaningless garbage.
DELIBERATELY removed the 1940s peak, and you KNOW that.
You are deceitful little SJW, aren’t you, seb .
DENIAL of the cooling scare just makes you look like a self-blind monkey, seb
https://s19.postimg.cc/s1h6rbdo3/sne.jpg
Definitely are signs, seb
Take the tunnel-vision blinkers off.
Maybe long enough to answer those two questions.?
Q1. In what way has the climate changed in the last 40 years, and how are those changes scientifically attributable to human activity ?
Q2. Do you have ANY EVIDENCE that humans have changed the global climate in ANYWAY WHATSOEVER?
Too wilfully blind to allow yourself to see.
Supertroll of course has no evidence despite several requests from yourself and others to provide it.
But you’re not disputing that the MWP was warmer than the current warm period, are you?
And if not, what caused it? And why is the current (a bit less) warm period any different? And why can you assume that the current pause (clearly visible in your graph) from 2000 does not presage a downturn?
Are you sure about that? Even Kenneth posted a paper recently that had it as just as warm as today meaning in a year or two we will definetly have surpassed that threshold.
Do you believe that the same outcomes have always the same causes? Or do you accept that there can be different reasons for a climate change? So what makes current times different? The rather large anthropogenic component. That was obviously not the case in MWP times.
1) there is no pause visible, even if you “zoom” in: http://woodfortrees.org/plot/gistemp/offset:-0.43/mean:12/from:1990/plot/hadcrut4gl/offset:-0.26/mean:12/from:1990/plot/rss/mean:12/offset:-0.13/from:1990/plot/uah6/mean:12/from:1990
2) I am not a fan of curve fitting in temperature graphs to predict future temperatures, e.g. doing a FFT and reconstructing temperature graphs from the found periodices and claiming that you can predict the future with them.
Papers like that get posted here often enough and taken for valid predictions. Maybe that’s why skeptic predictions are always so spectacularly wrong 😉
“meaning in a year or two we will definetly have surpassed that threshold.”
So, the coming cooling trend will make it warmer..
ummm… ok seb
Whatever you say, seb
sebs phantasies. !!
CUCKOO !!!
“there is no pause visible,” In the adjustments.
Two BIG LONG pauses in anything resembling real temperature data.
But you KNOW that, don’t you seb..
Deliberately DISHONEST yet again.
No warming from 1980-1997
https://s19.postimg.cc/kr0uu9cz7/RSS_V4_before_El_Nino.png
No warming from 2001-2015
https://s19.postimg.cc/kr0uu9cz7/RSS_V4_before_El_Nino.png
ONLY those solar powered El Ninos.
Absolutely ZERO evidence of any human CO2 fingerprint AT ALL, anywhere.
Make-believe warming from CO2, and dependence on deliberately corrupted data, is what makes AGW-cultist predictions so stupidly WRONG.
And it really is totally irrelevant what you are fan of, or not.
And how many times have warmists gotten their predictions wrong? It’s getting to be quite ridiculous. The likes of peofessor Wadhams spring to mind. Oh and don’t forget the infamous Mann-made hockey stick 😁😁
Why are you consistently trolling this site despite having being called out on your nonsense so many times? The onus is on you and your ilk to prove that we are headed for a climate catastrophe. You have not being able to prove this. You and others like yourself are enemies of the truth.
I have found a secondary effect of enhanced atmospheric CO2 apart from enhanced plant growth.
This causative effect of CO2 has been established now with great certainty
As CO2 ppm increases, stupidity and ignorance increases among AGW “believers”
What this says is that the science is “settled”.
It’s just that it’s settled precisely opposite to what the IPCC say.
Good try, but no …
Well YES, actually seb.
As you well know from your exhaustive searching, there is no evidence for even the most basic meme of the AGW agenda.
ie.. There is no evidential science to back up warming by enhanced atmospheric CO2.
Without that evidence, the real science is very much settled AGAINST the AGW scam, and all the suppository nonsense from the IPCC.
[…] The weather has not been becoming more extreme, and if it is, it is due to the warming oceans. CO2 and LWIR between 13 and 18 microns don’t warm water. Source […]