A 2017 peer-reviewed paper authored by physicist Dr. Hermann Harde drew considerable response upon its publication in the journal Global and Planetary Change. Harde’s conclusion that less than 15% of the increase in CO2 concentration since the 19th century could be attributed to anthropogenic emissions was deemed unacceptable by gatekeepers of the anthropogenic global warming (AGW) viewpoint. A critical reply to the paper was consequently published, but it included assumptive errors and misrepresentations of the original points. Harde’s exhaustive reply to the criticism has been refused publication, which has effectively silenced scientific debate on this salient topic.
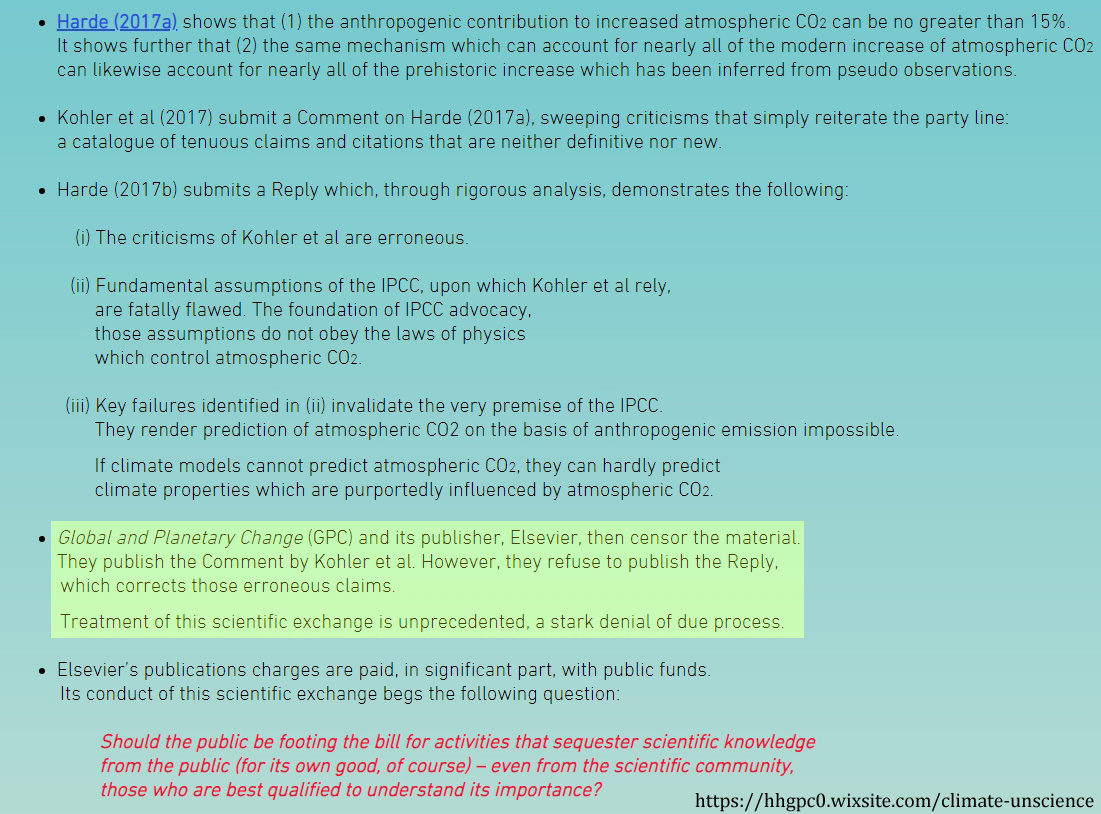
Image Source: https://hhgpc0.wixsite.com/climate-unscience
We have yet another example of AGW advocates like Gavin Schmidt running away from real scientific debates with skeptics.
After receiving appeal-to-authority pressure from Gavin Schmidt and other activists at RealClimate.org, the overseers of the Elsevier journal Global and Planetary Change have refused to allow the public to read the exhaustive response to criticisms levied against a peer-reviewed paper they originally agreed to publish.
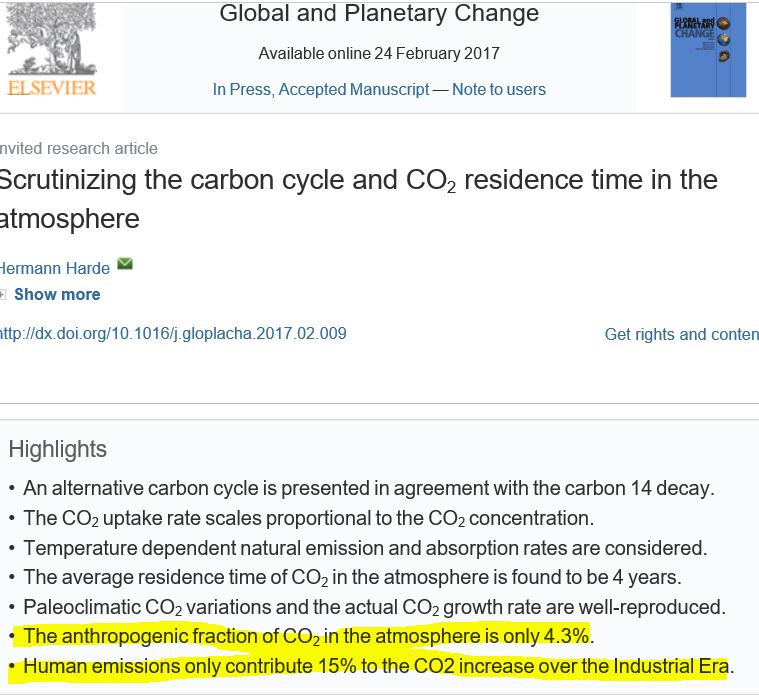
Image Source: Harde, 2017
Critiquing Via Misrepresentation and Models
Within months after the Harde paper was published, Köhler et al. (2017), was quickly cobbled together and published in Global and Planetary Change in an attempt to “refute” the conclusions of the Harde (2017) paper.
The problem was, Köhler et al. (2017) did not accurately critique the actual points made in the original paper, but instead they devised alternative or erroneous versions of Harde’s positions and then critiqued those instead. In other words, they used the straw man argument tactic in their “rebuttal” paper.
In an unpublished response to the Köhler “critque” paper, Harde contends that Köhler et al. also employ “ad hoc”argumentation, “circular reasoning”, the “failure of logic” inherent in the practice of “validation by consensus”, and an overall reliance on models and assumptions rather than observation.
Excerpts from the unpublished response to Köhler et al. (2017):
“Köhler et al. list the production of anthropogenic carbon from 1750 to 2010 as 518 PgC, corresponding to 1,901 Pg of CO2. Of this, about 45% is assumed to have accumulated in the atmosphere. This value, the so-called “Airborne Fraction” (AF), is ad hoc – an artifact of presuming that increased CO2 follows exclusively from anthropogenic emission. During the same period, cumulative natural emission and absorption were 100 times greater: 727.3 Pg/yr x 260 yr = 189,000 Pg. Cumulative anthropogenic CO2 was therefore less than 0.5% of total emission into the atmosphere. If the airborne fraction of anthropogenic CO2 is arbitrarily assumed, absorption of anthropogenic CO2 follows directly. The result, however, derives from circular reasoning. It is no more reliable than the assumption upon which it is based.”
“Despite huge uncertainties, climate models are invoked to claim that absorption of anthropogenic CO2 will quickly become saturated, forcing anthropogenic CO2 to accumulate in the atmosphere: ‘Uptake of anthropogenic carbon will become slower if we continue to increase anthropogenic CO2 emissions’. Like others, this claim rests upon models that are largely ad hoc. It is therefore speculative.”
“[O]bserved absorption, in the record of 14C, exhibits no evidence of saturation. Climate models are even invoked to claim in which layers of the ocean carbon will accumulate and, thereby, lead to acidification. Such claims are little more than hypothetical. Observations necessary to substantiate or falsify them are nonexistent. The models upon which the claims rely are themselves grossly under-constrained. Observations are simply too scarce to configure model parameterizations uniquely.”
“Köhler et al. present an inventory of carbon which is purported to quantify changes in the various surface and sub-surface reservoirs, thereby isolating absorption of anthropogenic CO2. To claim that extraneous systems, like the carbon content of soil, vegetation (canopy and below, as well as decomposing), the sub-surface ocean, and marine sediments, are known with even close to the precision necessary to quantify those properties globally is preposterous. … Without global observations necessary to quantify those properties, the purported inventory of changes that could be associated with absorption of anthropogenic CO2 is fanciful.”
“Köhler et al. also argue that the analogy to radiocarbon is incorrect – because, they claim, changes in the bulk inventory of CO2 would be confused with changes in tracers at minute concentration. What is confused is Köhler et al.’s interpretation. Carbon 14 is a tracer of overall carbon, which is dominated by carbon 12. 14C is therefore a tracer of atmospheric CO2. Exponential decay of 14C following elimination of the nuclear source (Fig. 1) is then a direct measure of overall absorption of CO2 – because, with the elimination of that perturbing source, the conservation law for 14C reduces to (3).”
“Köhler et al. argue that the signature of absorption in 14C is corrupted by dilution via fossil fuel emission, which is mostly free of 14C (the so-called Suess effect). The claim is specious. Dilution by fossil-fuel emission that is 14C-free has negligible influence on the decay time of 14C (Appendix B).10 Far more influential is re-emission of 14C from the Earth’s surface: 14C that was recently absorbed from the atmosphere, for example, by vegetation that subsequently decomposes and re-emits that 14C along with
other CO2.”
“It should be noted that the heading of Köhler et al.’s Section 3 is misleading. We did not claim to model carbon in the complete Earth-atmosphere system. That would require a wider analysis, accounting for processes within extraneous systems and exchanges between them. Our analysis focuses upon CO2 in the atmosphere, which is controlled by the governing conservation law. Köhler et al. characterize this physical law as a flawed 1-box description – because, they claim, a single balance equation does not account for details in other reservoirs, systems that are extraneous to the atmosphere. Köhler et al.’s interpretation is confused. With the inclusion of surface fluxes eT and a, which account for influences on the atmosphere, the balance equation (1) entirely determines the evolution of CO2. Details of extraneous systems, which are largely unobservable, are then irrelevant.”
“Köhler et al. claim that the ice core record of CO2 perfectly matches the modern record of actual atmospheric measurements. With respect, this claim is preposterous.”
“Köhler et al. claim that references to material which inspired our investigation but which has either been criticized provincially, on dubious merits, or has not appeared in a journal are invalid. Among the treatments invoked by Köhler et al. to discount contradictory evidence are treatments which were shown in Section 1 to be unphysical. Köhler et al.’s complaint over source is ironic, contradicting their own position. To challenge our demonstration of fundamental physics, they cite material, even casual opinion, that was published on the internet. Accordingly, Köhler et al. expect one standard for others, but another for themselves.”
“Köhler et al.’s Comment is devoid of concrete analysis. Its tenor is to inundate the reader with citations, a reiteration of the IPCC catalogue. It amounts to validation by consensus, a failure of logic that has been quashed repeatedly in the history of science (see, e.g., Hawking, 1988).”
Köhler et al. Contradicted By Observed Evidence
“The observed behavior of carbon 14 demonstrates that this is not the case (Fig. 1). Its rapid decay following elimination of the perturbing nuclear source makes it clear that present absorption of CO2 is 1-2 orders of magnitude faster than that claimed by Köhler et al.”
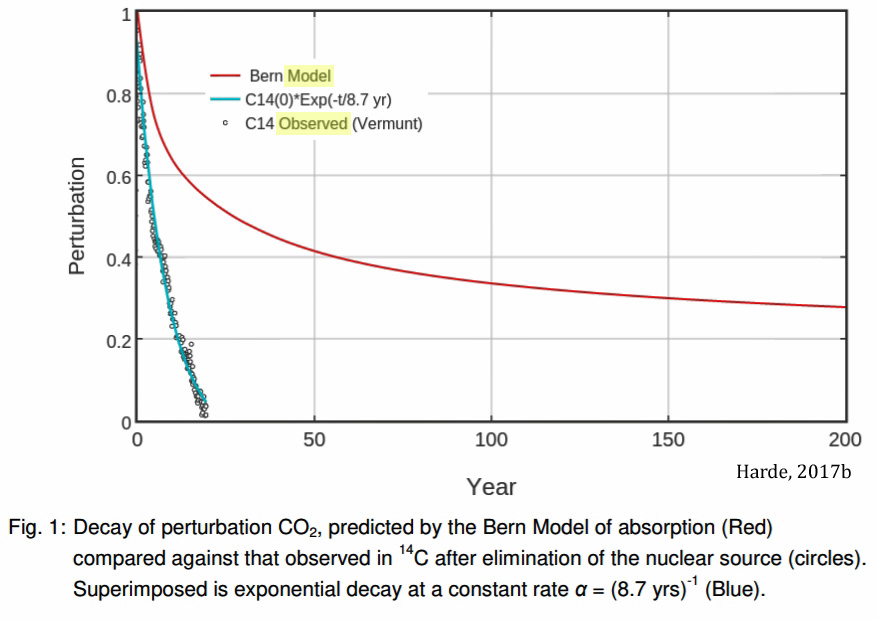
Image Source: Harde, 2017b
“The treatment of absorption is specious. Notice: Absorption of CO2 is nonzero even if CO2 concentration vanishes. CO2 is therefore removed from the atmosphere even if there is no CO2 in the atmosphere. What world such treatment describes is unclear. What is clear is that it is not the physical world. This error is fatal. Changes of CO2 relying on it cannot satisfy the conservation law which is satisfied by CO2 in the atmosphere (Fig. 1).”
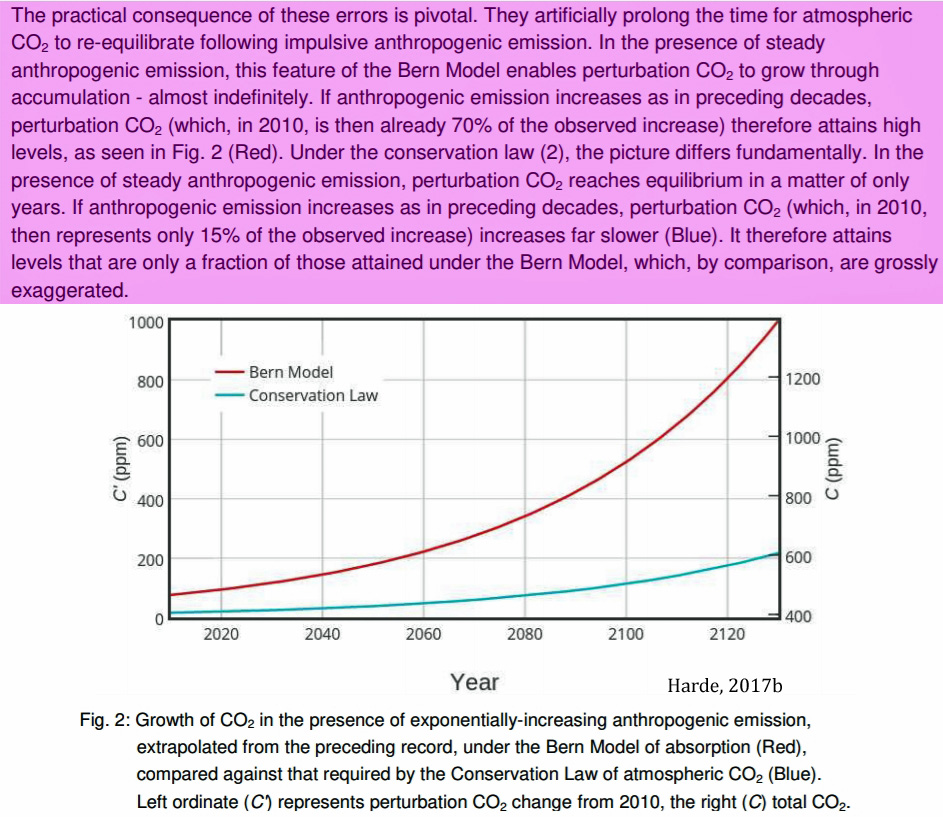
Image Source: Harde, 2017b
Links To The Censorship Sequence
Below is a summary of the silencing of scientific debate by the bloggers at RealClimate.org and by the overseers of the Global and Planetary Change journal.
1. The original (full) paper published in Global and Planetary Change:
“Scrutinizing the carbon cycle and CO2 residence time in the atmosphere”
2. The RealClimate.org (blog) response is immediate. Dr. Gavin Schmidt insists that the paper must not have been properly peer-reviewed:
“Something Harde to believe…” (Dr. Gavin Schmidt, RealClimate.org)
3. The Köhler et al. (2017) (full) critical response to the paper:
Comment on “Scrutinizing the carbon cycle and CO2 residence time in the atmosphere” by H. Harde
4. Elsevier acknowledges their transgression in publishing a paper that didn’t conform to AGW dogma:
“Flawed climate science paper ‘exposed potential weaknesses’ in the peer review process”
5. Dr. Hermann Harde’s Reply (full) to criticism of his paper goes unpublished, censoring debate:
Reply to Comment on “Scrutinizing the carbon cycle and CO2 residence time in the atmosphere”
Uncensored access to the full Reply paper is available here:


We live in humane times. Not a single suggestion of burning Dr. Harde together with his works.
Pity the Bern Model is so wrong,
The planet would have LUV’D all that extra atmospheric CO2
Unfortunately, its seems some 600ppm around the end of the century is best we can manage.
It’s fascinating to me that you, Kenneth, are not a bit skeptical about the extraordinary claims of Harde & Co (including Ed Berry) about our physical world. It’s just wrong, it has been shown to be wrong, yet you believe in the validity of this “reply” … why?
Either you don’t understand why it’s problematic or you don’t care and just want to help a fellow skeptic (he even uses the very language you guys use, only with sometimes better vocabulary).
This is just wow 😉
Considering the exhaustive details in the Reply (that was censored) to the Kohler paper identifying the errors and misrepresentations in their response, I do not agree that the Kohler et al. paper sufficiently showed Harde to be wrong.
Harde’s response deserved to be published, not censored. But shutting down debate is what your side does. So it’s been opened up here. That’s the reason behind this article: to re-stimulate debate after the Gavin Schmidt-types shut it down.
The irony … my comment above got “censored” as well.
That’s pretty obvious, but the Harde “reply” is just hilarious.
Shutting down stupidity you mean. You “published” his reply, did you not? Do you think it has any merrit? Obviously yes, and that makes you a supporter of junk science. You’ve supported hilarious papers before …
“but the Harde “reply” is just hilarious.”
IN other words, seb does NOT understand that Harde reply.
His brain-hosed mind cannot process REALITY.
“Shutting down stupidity you mean”
We have tried, but you keep coming back. !!
Nothing you say has ANY merit.
You are a supporter of JUNK science which you are totally unable to support scientifically.
SebH is “just wrong,” but Pierre gives him a voice here.
…well, OK, he’s not JUST wrong. He’s also evasive, deceitful and obnoxious.
…and did I mention he’s virtually always wrong?
Sorry seb, But Kohler etal are the ones that have been shown to be WRONG
Their AGW ideology DOES NOT match reality
Just like all other AGW ideology DOES NOT match reality.
Be just little bit skeptic of what your side puts out. It would be interesting how you’d take something like this apart (or make fun of it) if you thought this was a AGW paper. Oh btw, it contains a model, maybe that helps you to be a more skeptical?
So, NOTHING as always, hey seb
Just more mindless ranting and attention-seeking.
Does NOT match REALITY..
Nothing you ever say MATCHES REALITY
You poor little fantasy troll.
Again, seb
IF you happen to be correct, (miracles happen 1 in a million) then it is WONDERFUL that humans have so much control over the amount of carbon dioxide in the atmosphere.
Human release of sequestered CO2 will only continue to increase, there is NOTHING all your ranting and carrying on can do about that.
So maybe the world is destined to reach 1000ppm by the end of the century. 🙂
AND THE BIOSPHERE WILL LUV IT !!! 🙂
And as you are well aware from your exhaustive searching, there is NO EVIDENCE that enhanced atmospheric CO2 doesn’t anything except enhance plant life.
Did I mention that I LUV Josh’s work ! 🙂
https://4k4oijnpiu3l4c3h-zippykid.netdna-ssl.com/wp-content/uploads/2018/08/Two-platforms_scr.jpg
[…] Full story at No Tricks Zone […]
The computer models all assume that co2 increase is driving the temperature increase. But, since that has long since been recognized as not sufficient, they append yet another assumption – that the actual culprit is water vapor feedback causing 2 to 3 times the temperature increase as brought on by co2 increase.
But,what about the MWP? There was no co2 increase during and before that period. The alarmists toss that aside by declaring that the MWP was neither global nor warmer. Where is the data?
Data from 6,000 boreholes around the globe confirms that the MWP trend was global. The receding Mendenhall glacier recently exposed a shattered 1,000 year-old forest, still in its original position. No trees have grown at that latitude anywhere near that site since then.
CO2science.org has most of numerous peer-reviewed local site studies, and it’s also organized by region. Focus on the subset of studies which directly address temperature. Pick a half dozen regions around the world and select one temperature-based study from each. You will find that the sites studied invariably were warmer during the MWP then in current times.
The laughable alarmist demand insisting that for a warming to be global it must be synchronous (meaning everywhere at the same time) would disqualify even our current warming (such as it is).
While this does not prove that co2 has not had some impact on our current warming (such as it is), it eliminates the credibility of those “scientists” who have DENIED the MWP was global and as warm, likely warmer, than now.
The good old skeptic argument “what about past warmings?” … nope, just because it warms, it doesn’t mean it warms for the same reasons.
There are papers … something like this? https://www.geo.umass.edu/climate/papers2/Mann2009.pdf … but it’s written by Mann, so you will likely automatically refuse its content or mumble something about models, right?
Nope, you’ll find that sites like this one currate a subset of papers that show exactly this.
Nope, what’s laughable though is “skeptics” trying to construct counter arguments like this.
Please refrain from imagining that you “blog scientists” have found something the experts have overlooked or are actively covering up in a great conspiracy.
So, STILL absolutely ZERO EVIDENCE of CO2 warming.
Just your continual mindless hysteria and BS.
Just MAKE IT UP seb.
Don’t worry about any actual measurable science.
Q1. In what way has the climate changed in the last 40 years, that can be scientifically attributable to human CO2 ?
Q2. Do you have ANY EMPIRICAL EVIDENCE at all that humans have changed the global climate in ANYWAY WHATSOEVER?
cue.. seb headless-chook routine and evasion.
MWP is well supported by MULTIPLE scientific papers.
http://www.co2science.org/subject/m/subject_m.php
https://s19.postimg.cc/qdtyp46fn/MWP_global.jpg
Even in Germany
https://s19.postimg.cc/90joacqkz/germany_MWP.png
Stop being a CLIMATE CHANGE DENIER, seb.
Thank you for this.
Of course it is not fair to refuse a reaction of the author of an article, but I also had a lot of critique on his work when it was published. Also on the two points yellowed in the introduction:
– The fraction of anthro CO2 is currently about 10%, based on the observed 13C/12C ratio.
– Human contribution to the total mass increase is about 90%, not 15%.
Dr. Harde made three fundamental errors in his original work:
– Using the residence time, or even the decay rate of the 14C bomb tests excess, doesn’t say anything about the time needed to reduce an extra bulk CO2 injection – whatever the source – above the temperature controlled steady state of the oceans with the atmosphere.
– Using the total concentration of CO2 in the atmosphere as base implies a steady state of zero CO2 in the atmosphere, which is not realistic.
– Using only natural emissions without taking into account the natural sinks violates the mass balance.
A more complete, illustrated critique of mine on Dr. Harde’s work is here:
http://www.ferdinand-engelbeen.be/klimaat/Harde.pdf
The 4.3% value comes from the IPCC (2013) report. So if the percentage has more than doubled since 2013, that would appear unlikely.
The natural versus anthropogenic CO2 emission ratio as of 2013 from IPCC AR5, Figure 6.1:
http://www.climatechange2013.org/images/figures/WGI_AR5_Fig6-1.jpg
-Natural emissions total: 198.2 GtC (primarily 78.4 GtC from ocean outgassing, and 118.7 GtC from total respiration and fire)
-Anthropogenic emissions total: 8.9 GtC (7.8 GtC is fossil fuels, 1.1 is land use changes)
-Ratio in terms of 100% total 207.1 = 95.7 to 4.3
I assume this is based on your unsupported formula…
…that does not match the paleoclimate records, nor does it explain the plummeting of ocean temperatures from the Medieval Warm Period to the Little Ice Age.
Scientists: We Lack A ‘Quantitative, Mechanistic Understanding Of How The Ocean Carbon Sink Works’
Not the same value/variable Kenneth. How often does this need repeating? The IPCC value is the ratio of the yearly emissions. The atmospheric fraction is not the ratio of the yearly emissions. If those are really the same, I apologize and expect an explanation how this can be the case.
The beautiful skeptic argument of claiming something is unsupported while only presenting unsupportable stuff yourself. Great because …
… because it always ends in something like this. “We don’t know enough” *sigh* yes, we do know enough to make basic statements about what’s happening. There are no mystery forces that would turn everything around if we just finally would discover them.
More pathetic *sighing*.. PATHETIC.
There is a REAL MYSTERY when it comes to evidence supporting the baseless conjecture of CO2 warming
Never measured ANYWHERE,
Just BELIEVE in fairy-tales, seb
Its all you have.
Humans have contributed around 15% of the rise in atmospheric CO, seb
REAL maths shows it. I’d ask you to READ and try to comprehend the basics of Hardes’ reply, but you have made it very clear you don’t have the capability.
Just like you don’t have the capability to support even the most basic fallacy of the AGW scam, ie CO2 warming.
Q1. In what way has the climate changed in the last 40 years, that can be scientifically attributable to human CO2 ?
Q2. Do you have ANY EMPIRICAL EVIDENCE at all that humans have changed the global climate in ANYWAY WHATSOEVER?
You are becoming quit repetitive …
LOL? You think that is real math? Why? Because you like the results?
SO HILARIOUS watching your RUN AWAY like a headless chook from those questions.
You have PROVEN you don’t have the capability to support ANYTHING you rant about seb
You have PROVEN you do not understand maths beyond junior high level.
Kenneth Richard,
The 4.3% human is the ratio of the input quantities, not the current level of anthro CO2 in the atmosphere, which is around 10%, based on δ13C measurements.
How can that be with only 4.3% human input?
Quite simple: human CO2 goes for about 100% directly into the atmosphere. Except for the sporadic CO2 molecule that is catched by the next adjacent tree, most comes in the bulk of the atmosphere and is more or less evenly distributed over the atmosphere.
Then we have natural inputs and outputs. At no moment in time there is 200 GtC natural CO2 extra in the atmosphere. What you forget is that all natural inputs are (more than) fully counterbalanced by natural outputs. Not only that, most of the in/out fluxes are countercurrent: at the moment that T increases, CO2 largely sinks into vegetation and slightly is released by the ocean surface. Net global effect: -5 ppmv in spring/summer and +5 ppmv in fall/winter. Human CO2 is about +4.5 ppmv only increase over a year. Thus instead of 4.3% human input, it is near 50% input compared to the high levels in fall winter and 200% compared to the overall natural balance, which is about half the mass of the human input.
“that does not match the paleoclimate records, nor does it explain the plummeting of ocean temperatures from the Medieval Warm Period to the Little Ice Age.”
Should have added: the direction is T first, CO2 second with a lag of about 800 years during warming to an interglacial and several thousands of years for a cooling into a new glacial period.
Even the cooling from MWP to LIA is visible in the high resolution Law Dome DSS record:
http://www.ferdinand-engelbeen.be/klimaat/klim_img/law_dome_1000yr.jpg
With a drop of ~6 ppmv and a lag of ~50 years after a ~0.8 K drop in temperature. The reverse increase in temperature since the LIA is thus good for maybe 10 ppmv of the 110 ppmv increase of CO2…
How much influence the extra 110 ppmv CO2 has on temperature is an entirely different discussion…
Correct, that is the percentage reported in the Harde paper, and it comes from the IPCC (2013).
Yes, I realize this is your assumption. We have very little actual real-world knowledge of natural sources and sinks. And because of this, we cannot say that the following is inaccurate:
Our atmosphere does not treat anthropogenic CO2 any differently than CO2 from natural sources. Anthropogenic CO2 is simply another input to atmospheric CO2 that will increase the outflow of atmosphere CO2 to land or ocean by the same or similar amount. But because the natural sources of CO2 are so much larger than the anthropogenic inputs, the likelihood is higher that any inequality in input/output will be due to natural CO2 inputs.
Natural input is 98 ppmv per year. The 4.5 ppmv anthro is mixed with the 98 ppmv natural, and the atmosphere doesn’t pick and choose which is which.
And the 1 K/16ppmv formula you espouse is entirely inconsistent with the 10,000-year paleoclimate record, as the temperature drops by over -2 K as the CO2 rises by +20 ppm. Every time I have pointed this out to you, you deny it. Why?
https://notrickszone.com/wp-content/uploads/2016/11/Holocene-CO2-and-Pacific-Ocean-Heat-Content-Rosenthal-2013.jpg
No, it isn’t. The ocean temperature dropped by about 1 K between the MWP and 1400-1900 period (LIA). The CO2 concentration didn’t fall by 16 ppm. Instead, it rose during that time. For that matter, the HadCRUT dataset has depicted no net temperature change between 1850 and 1930, when CO2 levels rose by more than 20 ppm.
During the last glacial, global temperatures rose by multiple degrees (and Greenland warmed by 10-15 K) within a matter of decades as CO2 concentrations remained steady at 180 ppm. The 8.2 K event, which was global, had temperatures fall and then rise by multiple degrees within a matter of 150 years as CO2 concentrations changed by…2 ppm.
So again, one of the most basic tenets of your position on CO2 change attribution is entirely inconsistent with the paleoclimate record. Considering we have extensive geological evidence that the Earth was several degrees warmer (and sea levels multiple meters higher) than now during the Early-Mid Holocene, the likelihood is high that our estimates of CO2 concentration are very inaccurate.
Indeed. So?
And how would that play out? Would human CO2 emissions just not exist then? I did such a calculation before, but here we go again. Assume natural emissions (unnoticed by us) increased by 100%, a very large variation. But we still only observe an increase by 2 ppm per year while emitting 4 ppm into the atmosphere. So what would the increase be if those 4 ppm we put out didn’t happen? Also the 2 ppm observed?
And here lies the problem with your understanding of the mechanisms. That is simply not the case. Our addition doesn’t increase in the absorption ability by as much as what we emit. If that were the case, there could never be a change in CO2 concentration, since – you wrote it yourself – nature doesn’t treat human CO2 differently, so why would it not also absorb natural emissions at the same rate?
Learn how the mechanisms work!
EXACTLY! And ~100 ppmv get removed every year. So why do you think those missing ppmv that are the increase year by year are 95% of natural origin? The molecules are, but for all accounting purposes that’s not the case. It doesn’t work that way!
Because you are wrong. You don’t know how this works and/or don’t want to know it.
Yep, you don’t know how it works.
Nope, the likelihood is high that you just have no clue and are grasping straws trying to match reality with your version of reality.
Sorry, but learn how the mechanisms really work.
Kennet,
“Anthropogenic CO2 is simply another input to atmospheric CO2 that will increase the outflow of atmosphere CO2 to land or ocean by the same or similar amount.”
Was it only that simple…
First, the largest natural in/out fluxes, the seasonal one’s (about 110 GtC in and out), are temperature driven and are hardly influenced by the amount (= pressure) of CO2 in the atmosphere. See the seasonal amplitudes over two periods in time:
http://www.ferdinand-engelbeen.be/klimaat/klim_img/seasonal_CO2_MLO_trend.jpg
Despite a 30% increase of CO2 over the two periods, there is little change in amplitude, only a doubling of residual CO2 in the atmosphere (each at about half human emissions).
Thus any human CO2 injected in the atmosphere is not removed by the seasonal cycles, it is removed by influencing the balance between inputs and outputs. Whatever the height of the inputs and outputs.
The height of the inputs and outputs is what makes the throughput and thus the residence time:
Residence time = mass / throughput
Residence time = 800 GtC / 150 GtC/year = 5.3 years
The removal of any extra CO2 above equilibrium is of a different order:
Adjustment rate = cause / effect
Observed over the past 60 years:
Adjustment rate = 110 ppmv / 2.15 ppmv/year = 51 years
The 2.15 ppmv/year is the observed net sink rate at 110 ppmv extra in the atmosphere.
That ratio is about the same over the past 60 years, with a quadrupling of the extra CO2 in the atmosphere and the net sink rate over that period.
In summary: the removal of any extra CO2 pressure (volcanic, human,…) above equilibrium is independent of the natural cycles which are temperature driven.
“Natural input is 98 ppmv per year”.
Not at any moment in time: the maximum is +5 ppmv, the minimum -5 ppmv, average 0 ppmv. A lot of CO2 is passing by but has zero influence on the total amount (= pressure) in the atmosphere (at equilibrium).
“Every time I have pointed this out to you, you deny it.”
Maybe that human civilisations already started with agriculture? Don’t know. Fact is that the paleo record shows a nice correlation, but not perfect, between CO2 levels lagging T levels. For the cooling periods: CO2 levels during the Eemian remained high until a new minimum temperature was reached before CO2 levels started to drop:
http://www.ferdinand-engelbeen.be/klimaat/klim_img/eemian.gif
“between 1850 and 1930, when CO2 levels rose by more than 20 ppm.”
Sorry, industrialisation started already around 1750 and from 1850 on with increasing amounts of coal. From 1870 on the amounts were already influencing the 14C carbon dating (as there is no 14C left in coal) and needed corrections…
“Natural input is 98 ppmv per year”.
Sorry, I just don’t find the evidence convincing that natural CO2 emission disappears to zero. Though agnostic and unwilling to commit to any definitive conclusion on this issue, I find the explanation of atmospheric physicists Dr. Ed Berry and Dr. Murry Salby more convincing than your explanation, especially since your 16 ppmv/K formula does not even remotely characterize the paleoclimate. The opposite, actually.
https://edberry.com/blog/climate-physics/agw-hypothesis/human-co2-not-change-climate/
“The IPCC agrees today’s annual human carbon dioxide emissions are 4.5 ppm per year and nature’s carbon dioxide emissions are 98 ppm per year. Yet, the IPCC claims human emissions have caused all the increase in carbon dioxide since 1750, which is 30 percent of today’s total. How can human carbon dioxide, which is less than 5 percent of natural carbon dioxide, cause 30 percent of today’s atmospheric carbon dioxide? It can’t.”
—
http://www.langtoninfo.com/web_content/9780521767187_frontmatter.pdf
“Together, emission from ocean and land sources (∼150 GtC/yr) is two orders of magnitude greater than CO2 emission from combustion of fossil fuel. These natural sources are offset by natural sinks, of comparable strength. However, because they are so much stronger, even a minor imbalance between natural sources and sinks can overshadow the anthropogenic component of CO2 emission.” pg. 546
That’s easy enough math. Since the absorption rate is not equal to the emission rate the total concentration increases. That should be clear to even you, right?
So if you have a new input which raises the total emission rate by 4 ppm, but the absorption rate only increases by 2 ppm you’ll get an accumulation of those left over 2 ppm. Every year. Until you end up with an increase of 100 after 50 years.
Now this is a simplified version. In reality the absorption rate also depends on the total amount of CO2 in the atmosphere and the human input as well as the natural input are not constant. But every highschool student should be able to understand how it works.
One more time. In equilibrium we had:
98 ppm emissions by nature and 98 ppm absorption
Now we have 98 ppm natural emissions and 4.5 ppm human emissions and 100.5 ppm absorption. Since nature doesn’t make a difference between natural and human CO2, 4.4 ppm (4.5 * 100.5 / 102.5) of the human CO2 and 96.1 ppm (98 * 100.5 / 102.5) of natural CO2 gets absorbed.
Do you understand this math, Kenneth?
Now why is it so hard to realize that those additional 4.5 ppm are causing 1.9 ppm less natural CO2 to be absorbed in addition to 0.1 ppm from human sources? The human emissions are causing this reduction in natural CO2 absorption, thus the human emissions are responsible for the whole 2 ppm increase even though it’s not 2 ppm of CO2 molescules of human origin that remain in the atmosphere year over year.
Why is this so hard to understand?
That’s an assumption that there is a perfect balance between natural sources and sinks and only the anthro emission is out of balance. The atmosphere does not distinguish between the 4.5 ppm anthro and the 98 ppm natural. Again:
—
http://www.langtoninfo.com/web_content/9780521767187_frontmatter.pdf
“Together, emission from ocean and land sources (∼150 GtC/yr) is two orders of magnitude greater than CO2 emission from combustion of fossil fuel. These natural sources are offset by natural sinks, of comparable strength. However, because they are so much stronger, even a minor imbalance between natural sources and sinks can overshadow the anthropogenic component of CO2 emission.” pg. 546
—
Much of the reason why most assume it’s only anthropogenic is that our historical measurements of CO2 concentrations are rooted in confirmation bias. CO2 concentrations during the Holocene have been measured as 400 ppm to 700 ppm, with values over 425 ppm during the 19th century even (90,000 measurements!). but these values have been arbitrarily discarded in favor of values that are lower (260-280 ppm) so that it appears that modern CO2 concentrations are unprecedented or unusual, thus providing support for the position that today’s 410 ppm is anthropogenic.
Of course, if CO2 concentrations really did reach 400 ppm to 700 ppm during the Holocene without human activity, then that effectively destroys the argument. So that’s why these measurements are dismissed. It’s confirmation bias: “We’ve got a core that shows values of 700 ppm during the Holocene? Those can’t be right. We have another core with values around 265 ppm? Those are right.”
—
Foscolos, 2010
https://ejournals.epublishing.ekt.gr/index.php/geosociety/article/view/11157/11208
“By the end of the 18th century eminent scientists explained the climatic changes on the basis of temperature and the ensuing glacial retreat. This disturbing observation led many prominent scientists to send air balloons equipped with special devices to trap air from the lower atmosphere in order to measure CO2 concentrations. Ninety thousand (90,000) measurements were carried out at 138 locations in 4 continents between 1810 and 1961. The data indicated that atmospheric CO2 concentrations, during the 19th century varied between 290 and 430 ppm (with an average of 322 ppm for the pre-industrial period). For the 20th century, the average concentration is 338 ppm when combined with comparable CO2 measurements carried out by Mauna Loa Observatory, Hawaii, USA (1958- 2000). Measurement precision is ±3%.”
—
Kauffman, 2007
https://pdfs.semanticscholar.org/d9d9/eb6e213a1fa8fec2c877685baa81817b15a5.pdf
“In few fields considered to be science-based has there been such a high degree of polarization and refusal to consider alternate explanations of natural phenomena as in climate change at present. The scenario seems to be that between 1985 and 1988, a decision was made to present pre-1958 CO2 concentrations with no humps or dips and to proclaim a pre-industrial level of 280 ppm. Compared with the so-called pre-industrial levels of 280 ppm, a level of 410 ppm was found in 1812, rising to 450 ppm in 1825. There were levels of 370 ppm in 1857, and 4 sets of measurements gave 350–415 ppm around 1940 (Figure 10). From 1870–1920 values remained within 295–310 ppm. From 1955–1965 the values were 325 ppm. Beck chose the most carefully done assays for this graph. One was from Poona, India. An effort not described by Beck was one of 350 determinations near Point Barrow, Alaska, from 1947–1949, with a mean result of 420 ppm (Hock et al., 1952). … The CO2 levels found at Mauna Loa range from 315 ppm in 1957 to 385 ppm in 2007, a period of 50 years. They are similar on Antarctica, showing good mixing of the atmosphere. Since there was a bigger rise from 312 to 415 ppm from 1927–1944 (27 years), shown by chemical assays as described above (Figure 10), there should be no reason for alarm at present. The start of the infrared data in 1958 showed a CO2 concentration that was 12 ppm lower by NDIR assay than the best chemical data of the period. The chemical data are very consistent with each other. This discrepancy has never been resolved.”
—
Jaworowski, 1997
https://pdfs.semanticscholar.org/1c77/5f268fc03fa707dc95904cdc8e8394af9029.pdf
“The ice core data from various polar sites are not consistent with each another, and there is a discrepancy between these data and geological climatic evidence. One such example is the discrepancy between the classic Antarctic Byrd and Vostok ice cores, where an important decrease in the CO2 content in the air bubbles occurred at the same depth of about 500 meters, but at which the ice age differed by about 16,000 years. In an approximately 14,000-year-old part of the Byrd core, a drop in the CO2 concentration of 50 ppmv was observed, but in similarly old ice from the Vostok core, an increase of 60 ppmv was found. In about ~6,000-year-old ice from Camp Century, Greenland, the CO2 concentration in air bubbles was 420 ppmv, but it was 270 ppmv in similarly old ice from Byrd, Antarctica. … In the air from firn and ice at Summit, Greenland, deposited during the past ~200 years, the CO2 concentration ranged from 243.3 ppmv to 641.4 ppmv. Such a wide range reflects artifacts caused by sampling, or natural processes in the ice sheet, rather than the variations of CO2 concentration in the atmosphere. Similar or greater range was observed in other studies of greenhouse gases in polar ice.”
“Until 1985, the published CO2 readings from air bubbles in pre-industrial ice ranged from 160 to about 700 ppmv, and occasionally even up to 2,450 ppmv. After 1985, high readings disappeared from the publications. To fit such a wide range of results to the anthropogenic climatic warming theory, which was based on low pre-industrial CO2 levels, three methods were used: (1) rejection of high readings from sets of preindustrial samples, based on the credo: “The lowest CO2 values best represent the CO2 concentrations in the originally trapped ice”; (2) rejection of low readings from sets of 20th century samples; and (3) interpretation of the high readings from pre-industrial samples as representing the contemporary atmosphere rather than the pre-industrial one.”
“Neftel, et al. reported in 1982 rather high median CO2 concentrations in the preindustrial ice core from Byrd, Antarctica, of about 330 and 415 ppmv, with maximum value reaching 500 ppmv. However, in 1988, in the second publication on the same core, Neftel et al. did not show these high readings; the highest concentration reported was 290 ppmv, in agreement with the global warming theory.”
“Pearman, et al. [1986] “on examination of the data,” rejected 43 percent of the CO2 readings from Law Dome, Antarctica core … because they were higher or lower than the assumed “correct” values. Thus, they concluded a value of 281 ppmv CO2 for the pre-industrial atmosphere.”
“That’s easy enough math. ”
No. its FANTASY maths, based on wilful and deliberate IGNORANCE.
I note that in your puerile example, 4.4 of the 4.5ppm human CO2 gets absorbed by nature, leaving only 0.1 ppm in the atmosphere, so NATURAL CO2 added 1.9, or 95% of the increase.
Easy maths, seb. 😉
And you seem IGNORANT of the fact that natural emissions will ALWAYS climb as the carbon cycle increases.
And be VERY glad that the carbon cycle has increased.
Kenneth,
The 16 ppmv/K is what is the average response as observed over the past 800,000 years. The past 10,000 years may be different (as the Eemian was), due to any natural or human cause, but that doesn’t prove that the 110 ppmv increase over the past 168 years is natural.
With 280 ppmv in equilibrium in 1850, the current equilibrium is around 290 ppmv, not 410 ppmv…
Moreover, the 16 ppmv/K is change of solubility of CO2 in seawater, confirmed by over 3 million seawater samples.
SebastianH has responded to the why the increase is human made.
In addition: the current level of human CO2 in the atmosphere, based on the 13C/12C level is around 10%. That would be impossible with 4.3% human input if the natural sinks were removing any extra CO2 (human or not) the same way as the natural cycles are flowing in and out.
It all boils down to the difference between residence time and adjustment time for any excess CO2 above equilibrium.
It is the same as looking at a factory: the turnover of goods (thus capital) in a factory gives you the “residence time” of your capital in that factory. The gain (or loss) the factory makes at the end of the fiscal year is the “adjustment time” for any new capital invested in that factory. Somewhat related, but largely independent of each other.
“even a minor imbalance between natural sources and sinks can overshadow the anthropogenic component of CO2 emission”
It “could”, but it doesn’t: variability of all natural inputs and outputs together is +/- 1.5 ppmv around a +90 ppmv trend and mostly by temperature variability with a lag. Here enhanced for the 1985-2000 period with the 1991 Pinatubo and 1998 El Niño:
http://www.ferdinand-engelbeen.be/klimaat/klim_img/wft_trends_rss_1985-2000.jpg
In the derivatives for the full 60 years period:
http://www.ferdinand-engelbeen.be/klimaat/klim_img/dco2_em2.jpg
The variability remains about the same with a few extremes over the full period, while human emissions and increase in the atmosphere (and sinks) get larger.
About Ed Berry’s blog: I had the same discussion there with Bart/Bartemus, but my last reaction was not published… See:
https://edberry.com/blog/climate-physics/agw-hypothesis/why-our-co2-emissions-do-not-increase-atmosphere-co2/
A new discussion about his presentation of the work of Jamal Munshi in Porto is here:
https://edberry.com/blog/climate-physics/agw-hypothesis/preprint-a-fatal-flaw-in-global-warming-science/
Ferdinand, you’ve claimed that the Medieval Warm Period to Little Ice Age period fit with the 16ppmv/K formula. It doesn’t. CO2 rose between 1300 and 1900 AD as temperatures plummeted by 1 to 1.5 K. Neither does the last 10,000 years fit with the formula, as CO2 rose as temperatures fell — the opposite of what the formula you believe in says should happen. Neither does the last glacial – the last 80,000 years – work when global surface temperatures would rise by 5 to 15 K within decades every 1,500 years as CO2 concentrations remained the same (180 ppm). So you have a formula that does not work for close to 100% of the last 80,000 years (at least), and you’re telling me that even though it doesn’t work, it’s still right. Most people committed to getting it right don’t keep on insisting a formula works when it is clearly shown that it doesn’t over and over again.
And yet you simultaneously claim this formula can be applied to the MWP–>LIA period and “fit” nicely. It doesn’t, of course, but what do you care? Even if the formula is shown to not fit with the paleoclimate record 100% of the time, you’d dismiss that and claim it’s right anyway. It’s a glaring flaw in your presentation, and it’s one of the reasons I have so little regard for your pronouncements of having the “truth” about CO2 concentration attribution.
“even a minor imbalance between natural sources and sinks can overshadow the anthropogenic component of CO2 emission”
I know you believe this to be true, but I don’t view your insights on this matter to have more weight than Dr. Salby’s. Sorry. We just don’t know enough about carbon sinks to reach any definitive conclusions.
Scientists: We Lack A ‘Quantitative, Mechanistic Understanding Of How The Ocean Carbon Sink Works’
That’s your opinion, of course, that we have an equilibrium value. The reason the 16 ppmv/K formula doesn’t work and the reason you believe there is such a “thing” as an “equilibrium” CO2 value is because the currently popular historical measurements of CO2 concentrations are rooted in confirmation bias, and therefore they are likely wrong. CO2 concentrations during the Holocene have been measured as 400 ppm to 700 ppm. Values reached over 425 ppm during the 19th century even (90,000 measurements!). But these higher-than-now values have been arbitrarily discarded in favor of values that are lower (260-280 ppm) so that it appears that modern CO2 concentrations are unprecedented or unusual, thus providing support for the position that today’s 410 ppm is nearly 100% anthropogenic.
Of course, if CO2 concentrations really did reach 400 ppm to 700 ppm during the Holocene without human activity, then that effectively destroys the argument. So that’s why these measurements are dismissed. It’s confirmation bias: “We’ve got a core that shows values of 700 ppm during the Holocene? Those can’t be right. We have another core with values around 265 ppm? Those are right.”
—
Foscolos, 2010
https://ejournals.epublishing.ekt.gr/index.php/geosociety/article/view/11157/11208
“By the end of the 18th century eminent scientists explained the climatic changes on the basis of temperature and the ensuing glacial retreat. This disturbing observation led many prominent scientists to send air balloons equipped with special devices to trap air from the lower atmosphere in order to measure CO2 concentrations. Ninety thousand (90,000) measurements were carried out at 138 locations in 4 continents between 1810 and 1961. The data indicated that atmospheric CO2 concentrations, during the 19th century varied between 290 and 430 ppm (with an average of 322 ppm for the pre-industrial period). For the 20th century, the average concentration is 338 ppm when combined with comparable CO2 measurements carried out by Mauna Loa Observatory, Hawaii, USA (1958- 2000). Measurement precision is ±3%.”
—
Kauffman, 2007
https://pdfs.semanticscholar.org/d9d9/eb6e213a1fa8fec2c877685baa81817b15a5.pdf
“In few fields considered to be science-based has there been such a high degree of polarization and refusal to consider alternate explanations of natural phenomena as in climate change at present. The scenario seems to be that between 1985 and 1988, a decision was made to present pre-1958 CO2 concentrations with no humps or dips and to proclaim a pre-industrial level of 280 ppm. Compared with the so-called pre-industrial levels of 280 ppm, a level of 410 ppm was found in 1812, rising to 450 ppm in 1825. There were levels of 370 ppm in 1857, and 4 sets of measurements gave 350–415 ppm around 1940 (Figure 10). From 1870–1920 values remained within 295–310 ppm. From 1955–1965 the values were 325 ppm. Beck chose the most carefully done assays for this graph. One was from Poona, India. An effort not described by Beck was one of 350 determinations near Point Barrow, Alaska, from 1947–1949, with a mean result of 420 ppm (Hock et al., 1952). … The CO2 levels found at Mauna Loa range from 315 ppm in 1957 to 385 ppm in 2007, a period of 50 years. They are similar on Antarctica, showing good mixing of the atmosphere. Since there was a bigger rise from 312 to 415 ppm from 1927–1944 (27 years), shown by chemical assays as described above (Figure 10), there should be no reason for alarm at present. The start of the infrared data in 1958 showed a CO2 concentration that was 12 ppm lower by NDIR assay than the best chemical data of the period. The chemical data are very consistent with each other. This discrepancy has never been resolved.”
—
Jaworowski, 1997
https://pdfs.semanticscholar.org/1c77/5f268fc03fa707dc95904cdc8e8394af9029.pdf
“The ice core data from various polar sites are not consistent with each another, and there is a discrepancy between these data and geological climatic evidence. One such example is the discrepancy between the classic Antarctic Byrd and Vostok ice cores, where an important decrease in the CO2 content in the air bubbles occurred at the same depth of about 500 meters, but at which the ice age differed by about 16,000 years. In an approximately 14,000-year-old part of the Byrd core, a drop in the CO2 concentration of 50 ppmv was observed, but in similarly old ice from the Vostok core, an increase of 60 ppmv was found. In about ~6,000-year-old ice from Camp Century, Greenland, the CO2 concentration in air bubbles was 420 ppmv, but it was 270 ppmv in similarly old ice from Byrd, Antarctica. … In the air from firn and ice at Summit, Greenland, deposited during the past ~200 years, the CO2 concentration ranged from 243.3 ppmv to 641.4 ppmv. Such a wide range reflects artifacts caused by sampling, or natural processes in the ice sheet, rather than the variations of CO2 concentration in the atmosphere. Similar or greater range was observed in other studies of greenhouse gases in polar ice.”
“Until 1985, the published CO2 readings from air bubbles in pre-industrial ice ranged from 160 to about 700 ppmv, and occasionally even up to 2,450 ppmv. After 1985, high readings disappeared from the publications. To fit such a wide range of results to the anthropogenic climatic warming theory, which was based on low pre-industrial CO2 levels, three methods were used: (1) rejection of high readings from sets of preindustrial samples, based on the credo: “The lowest CO2 values best represent the CO2 concentrations in the originally trapped ice”; (2) rejection of low readings from sets of 20th century samples; and (3) interpretation of the high readings from pre-industrial samples as representing the contemporary atmosphere rather than the pre-industrial one.”
“Neftel, et al. reported in 1982 rather high median CO2 concentrations in the preindustrial ice core from Byrd, Antarctica, of about 330 and 415 ppmv, with maximum value reaching 500 ppmv. However, in 1988, in the second publication on the same core, Neftel et al. did not show these high readings; the highest concentration reported was 290 ppmv, in agreement with the global warming theory.”
“Pearman, et al. [1986] “on examination of the data,” rejected 43 percent of the CO2 readings from Law Dome, Antarctica core … because they were higher or lower than the assumed “correct” values. Thus, they concluded a value of 281 ppmv CO2 for the pre-industrial atmosphere.”
“In equilibrium we had….blah blah”
ROFLMAO
WTF makes you think anything to do with the carbon cycle is ever “in equilibrium”
Your basic IGNORANCE astound even me, seb.
Be very glad that humans seem to have kicked the carbon cycle into a higher gear, from the barely subsistence levels of the past.
All the more to go around. 🙂
And plant life is LUVING it.
Spikey, if you ever write that I am the troll here, I will refer to this comment. Seriously, WTF? I hope you did this on purpose to annoy me and do not really believe that is the case.
Kenneth,
Exactly, and that’s why all the increase is happening because human emissions exist. If it could distinguish, then it could be the case that all anthropogenic CO2 gets absorbed immediately (sink increase) while the natural emissions increased too, but the sink couldn’t adjust to it. But – as you wrote – that can’t be the case.
You don’t need to repeat that with no indication that you understand what it means. If you increase your average food intake by 300 calories, any day where you miss a meal or eat at a fast food restaurant will overshadow this additional intake. It doesn’t make your additional intake go away or be insignificant.
No, that is you having no clue and seeing conspiracies everywhere.
No, CO2 rose slightly after the MWP, was more or less stable in the centuries that followed and rose sharply with the beginning of the industrialization. Also the NH temperature dropped by 1 degree from maybe 1100 to 1600 AD and then began to recover back. Why are you making this up? Or is there some fringe paper that says this was the case that you trust above everything else?
Come on, now you are being nonsensical. Even your side agrees that CO2 largely follows temperature when only natural forces are at play: https://cornwallalliance.org/2017/06/global-temperature-and-co2-which-drives-which/
The formula for CO2 uptake of the oceans is derived from observations and confirmed many times. That’s why acidification (or neutralization if you prefer that term for a decreasing pH level) is a thing in the scientific community, despite you believing it is not something to worry about.
Maybe post a graph where you think it doesn’t fit?
the other reasons being that you don’t want it to be the truth, you don’t understand it, you like what Harde, Ed Berry & Co are writing because they sound just like you (all the “pseudoskeptic” language is there).
You take the easy way out, got it. Appeal to authority instead of thinking for yourself if this could be true. You know, being skeptical for real for once … you claim you are, now prove it.
There was no equilibrium? Seriously, you need to let go of this “we don’t know for sure” routine to explain away any scientific finding that doesn’t suit you. Why do you actively ignore how physics work? Of course there are equilibrium states. It is not a runaway mechanic that’s determining CO2 concentration in the atmosphere.
Your argument is lousy.
Kenneth,
As Sebastian has answered most of your objections, here my stake at the findings of the late Ernst Beck:
http://www.ferdinand-engelbeen.be/klimaat/beck_data.html
While I do admire the enormous amount of work done by Beck, the problem is the complete lack of quality control: he averaged every measurement of the past, the good, the bad and the ugly.
One ugly series is those measured at Barrow, Alaska, one of the current excelent places to measure CO2 in the atmosphere. Problem is that the apparatus used was for measuring CO2 in exhaled air of the researchers and had an accuracy of +/- 150 ppmv. Still good for measuring 20,000 to 40,000 ppmv in exhaled air, but of no value for outside CO2 in the atmosphere.
I am not sure if he removed that series or still used it in his compilation.
What he still used was the pCO2 readings of a German research vessel in the 1930’s. They obtained pCO2 from different depths, including 0 meter. Beck used that as atmospheric pCO2, while it was from the ocean surface waters: they measured the pH of the same sample! Seems rather difficult to perform a pH measurement in air.
Even after a lot of discussion the measurements stayed included…
About Dr. Jaworowski: let him rest in peace, together with his in 1992 written ideas about CO2 in ice. These were totally refuted by the work of Etheridge e.a. in 1996 already on three ice cores of Law Dome.
Dr. Jaworowski made such impossible errors that one can’t believe anything he said about CO2 in ice cores.
Take e.g. the fact that – according to him – ice core CO2 levels are too low, as cracks in the ice allow CO2 to (preferentially?) escape out of the ice into the atmosphere.
Until 1850, one measured 180-300 ppmv in ancient ice, while the outside air at the moment of measurements were at 360-380 ppm and probably higher during storige and in the closed room of measurements. That would give higher values in the ice enclosed air bubbles if there was any exchange, not lower.
See further about the late Dr. Jaworowski:
http://www.ferdinand-engelbeen.be/klimaat/jaworowski.html
You are confirmation-biased, Ferdinand. “Bad” or “ugly” measurements are those where the results aren’t consistent with what you presuppose to be true. So you and those committed to your beliefs discard measurements that aren’t compatible, and embrace those that are. .
This image is self-explanatory:
https://notrickszone.com/wp-content/uploads/2017/03/CO2-19th-Century-425-ppm-Jaworowski-1997.jpg
You continue to evade my comments about the total and complete failure of the 16 ppmv/K formula you espouse to correlate with temperature fluctuations during the last 80,000 years. This is another reason why I refuse to take your word for it when you claim we must discard Beck’s exhaustive analysis, Jaworowski’s work, etc., on the basis that, well, they’re wrong, as they used bad measurements, which is no less than confirmation bias. There is something fundamentally wrong with your conceptualization of the paleoclimate drivers of CO2 concentration changes. Global temperatures changed by multiple degrees in a matter of decades as CO2 remained unchanged at 180 ppm (this occurred 25 times during the last glacial). That is incompatible with the 16 ppmv/K formula you believe in. So is the global-scale 8.2 K event. Yet every time I point this incompatibility out to you, you ignore it. It’s not like it’s going away.
Huh? SebastianH hasn’t “answered” anything. He just repeats the same old ignore-the-natural-emissions-since-they-are-neatly-balanced-out mantra that you do.
So, I’m curious: are you also someone who believes that humans are causing the oceans to acidify with their CO2 emissions, thus threatening the oceanic biosphere with impending doom? SebastianH believes that the oceans are acidifying so fast that the marine biota cannot adapt. Do you believe that too?
https://edberry.com/blog/climate-physics/agw-hypothesis/preprint-a-fatal-flaw-in-global-warming-science/#comment-46963
Dear Ferdinand,
You wrote:
It is easy to falsify these assumptions.
(1) Nature itself fluctuates by more than humans emit. Therefore, nature itself would initiate any “new” process without the presence of human emissions.
(2) There is no special process that treats human-produced CO2 differently than natural-produced CO2. Any such hypothesis violates the Equivalence Principle.
(3) Outflow from the atmosphere is proportional to level (which you call pressure). This is true for both human and natural emissions, independently and in total.
(4) All sinks act in parallel, not in series. Therefore, one sink or a “new” sink cannot impede flow to another sink. Like holes in the bottom of a bucket of water, the presence of a small hole does not restrict the flow out of a larger hole. More outflow allows a lower level to balance outflow to inflow and reduces residence time.
(5) There is only one residence time, which is the equilibrium level divided by inflow, or level divided by outflow. There is no special “relaxation” time or “e-fold decay rate”. These times are imaginary inventions created to justify incorrect assumptions and incorrect conclusions.
@Ferdinand Engelbeen
LITMUS TEST
“SebastianH has responded to the why the increase is human made.” – Ferdinand: 29. August 2018 at 10:27 PM |
“Kenneth,
As Sebastian has answered most of your objections,” – Ferdinand: 3. September 2018 at 3:36 PM
Sorry, Ferd, you just totally lost me. SebH is an activist troll who spews warmist doublespeak. He’s offensive, evasive, and deceitful. You couldn’t have found a more faulty basket for your eggs.
I’m going to continue looking at what Salby says, but I was going to do that anyway. As to whatever credibility credit I was willing to extend to you, you blew it.
Seb responds with a mindless rant.
Poor trollette can’t even follow his own feeble maths. !
So FUNNY !!
seb says “Your argument is lousy.”
After producing a rant that contained absolutely ZERO rational scientific argument whatsoever.
So typical of seb
Did you ever find that real scientific evidence of CO2 warming, seb.
Or are you going to continue to IMAGINE that it exists??
“That’s an assumption that there is a perfect balance between natural sources and sinks and only the anthro emission is out of balance.”
This is the absolute idiocy of the seb-ferd argument.
The increase came mostly (about 85%) from the large surge of NATURAL CO2 release after the LIA.
The whole carbon cycle, has, very thankfully, been invigorated, brought back partly towards functional levels after being borderline for a long time.
And that surge has been TOTALLY BENEFICAL TO ALL LIFE ON EARTH
Well, spike, something and/or someone(s) is/are out of whack. Golly, I wonder what and/or who it could be…
Methane should NOT correlate with CO2, …but it does. (from marked start through 48:10 should do it.)
CO2 and Methane emissions look alike, but CO2 is supposed to be caused by burning fossil fuels, and methane is not. Yet they both correlate with each other and the “surface conditions” (temp and humidity) with almost statistical certainty.
If that’s correct, then I don’t need a smoking gun. AGW is DOA.
The way you defend these bad measurements, I’d assert you are very much confirmation-biased. You seek out the outliers – one could call it cherry picking – and claim that this is reality. You are being weird here.
That is basic physics. It’s confirmed by observations and measurements. If you don’t want to understand physics, fine. But don’t act like you found a contradiction when you have clearly no clue about how these mechanisms work.
Multiple degrees micro-Fahrenheit? Or do you mean local changes?
Anyway … https://www.ncbi.nlm.nih.gov/pmc/articles/PMC129389/ (“Rapid atmospheric CO2 changes associated with the 8,200-years-B.P. cooling event”) … maybe you should read it and try to understand the mechanism before going full-spike55 …
It is neatly balanced out. Otherwise would see way larger variations year by year.
Haha … no it doesn’t. Learn how this stuff works. This is ridiculous.
Exactly! And that’s why nature is not nearly absorbing 100% of the additional human CO2 while somehow not being able to absorb it’s own emissions anymore. That violates basic math and hurts my brain when you (and spike55) write these things …
Yes. And what does that tell us? Outflow is less than inflow and the difference is less than our output. What is the simple conclusion of that math riddle?
Sure, but the outflow is no where near equibrilibrium state for the current “level”. That’s why the concentration increases.
Good, you understand what Ed Berry & Co are writing. Now be a skeptic and pick it apart.
Could there be a difference between the residence time of a single CO2 molecule in the atmosphere and the time it takes for a certain inflow burst to vanish (e.g. the concentration or “level” going back to equilibrium state)?
Yonason,
You are lost indeed. Trying to insult me or trying to counter what I write with tabloid sources and what a certain Mr. Salby says just doesn’t work. Try to be skeptics for once instead of acting like the troll mob you two (spike55 and you) are.
spike55,
I can follow my math, you however are a different story. Seriously, you are not fit to discuss math in any capacity. Not even simple stuff. No amount of trolling from your side will convince anyone here 😉
You continue to evade my comments about the total and complete failure of the 16 ppmv/K formula you espouse to correlate with temperature fluctuations during the last 80,000 years.
Uh, no it’s not been confirmed with paleoclimate data that show that global temperatures rose by multiple degrees K within decades about every 1,500 years while CO2 concentrations remained steady at a dangerously low 180 ppm throughout. This does not support the conceptualization of 16 ppmv/1.0 K, which means Ferdinand’s beliefs are not supported by the “accepted” CO2 record dating back to the Eemian.
Lohmann and Ditlevsen, 2018
https://www.clim-past.net/14/609/2018/cp-14-609-2018.pdf
“During the last glacial period, lasting from approximately 120 to 12 kya BP (thousands of years before present), a large number of abrupt large-scale climate changes have been recorded in Greenland ice cores and other Northern Hemisphere climate proxies. These so-called Dansgaard–Oeschger (DO) events (Dansgaard et al., 1993) are characterized by an abrupt warming of 10–15 K from cold conditions (stadials) to warmer conditions (interstadials) within a few decades. This is typically followed by gradual cooling, lasting centuries to thousands of years, until a more abrupt jump back to cold conditions is observed.”
—
Jensen et al., 2018
https://journals.ametsoc.org/doi/pdf/10.1175/JCLI-D-17-0802.1
“The forcing mechanisms behind the abrupt climate changes occurring repeatedly during the last ice age, the Dansgaard–Oeschger (DO) events, are still debated. The DO events were first identified in ice cores on Greenland, where the events are characterized by an abrupt warming of 10°C ± 5°C in a few decades (Johnsen et al. 1992; Dansgaard et al. 1993; North Greenland Ice Core Project members 2004). During the glacial period the climate of Greenland alternated between cold stadial and warm interstadial conditions with a period of roughly 1500 years (Grootes and Stuiver 1997). Further climate reconstructions suggested a global extent with, for example, warmer and wetter climate in Europe coinciding with interstadial conditions on Greenland. Climate reconstructions show large variations in the North Atlantic during the same time period with, for example, sea surface temperature changes of 10°C (Sánchez Goñi et al. 2008) and movements of ocean fronts (Eynaud et al. 2009; Voelker and de Abreu 2013; Rasmussen et al. 2016) occurring with the Greenland stadial–interstadial cycles.”
—
Jensen et al., 2017
https://www.clim-past-discuss.net/cp-2017-103/cp-2017-103.pdf
“The Dansgaard-Oeschger (DO) events of the last glacial are some of the most prominent climate variations known from the past. Ice cores from Greenland show multiple temperature excursions during the last glacial period as the climate over Greenland alternated between cold stadial (Greenland Stadial, GS), and warmer interstadial (Greenland Interstadial, GI) conditions with a period of roughly 1500 years (Grootes and Stuiver, 1997). Each DO-event is characterised by an initial temperature rise of 10±5 °C toward GI [Greenland Interstadial] conditions in a few decades, a more gradual cooling over the following several hundreds of years, and a relatively rapid temperature drop back to GS at the end of most of the events (Johnsen et al., 1992; Dansgaard et al., 1993; North-Greenland-Ice-Core-project members, 2004; Kindler et al., 2014). DO-events are manifested not only in Greenland, but around the world.”
—
Lynch-Stieglitz, 2017
http://www.annualreviews.org/doi/abs/10.1146/annurev-marine-010816-060415
“Abrupt changes in climate have occurred in many locations around the globe over the last glacial cycle, with pronounced temperature swings on timescales of decades or less in the North Atlantic. The global pattern of these changes suggests that they reflect variability in the Atlantic meridional overturning circulation (AMOC).”
—
Rasmussen et al., 2016
http://www.nature.com/articles/srep20535
https://www.sciencedaily.com/releases/2016/02/160219134816.htm
“Extreme climate changes in the past Ice core records show that Greenland went through 25 extreme and abrupt climate changes during the last ice age some 20,000 to 70,000 years ago. In less than 50 years the air temperatures over Greenland could increase by 10 to 15 °C. However the warm periods were short; within a few centuries the frigid temperatures of the ice age returned. That kind of climate change would have been catastrophic for us today. Ice core records from Antarctica also show climate changes in the same period, but they are more gradual, with less severe temperature swings.”
—
Hewitt et al., 2016
http://adsabs.harvard.edu/abs/2016EGUGA..18.8388H
“Many northern hemisphere climate records, particularly those from around the North Atlantic, show a series of rapid climate changes that recurred on centennial to millennial timescales throughout most of the last glacial period. These Dansgaard-Oeschger (D-O) sequences are observed most prominently in Greenland ice cores, although they have a global signature, including an out of phase Antarctic signal. They consist of warming jumps of order 10°C, occurring in typically 40 years, followed generally by a slow cooling (Greenland Interstadial, GI) lasting between a few centuries and a few millennia, and then a final rapid temperature drop into a cold Greenland Stadial (GS) that lasts for a similar period.”
—
Agosta and Compagnucci, 2016
http://link.springer.com/chapter/10.1007/978-3-319-40000-6_5
“The climate in the North Atlantic Ocean during the Marine Isotope Stage 3 (MIS 3) —roughly between 80,000 years before present (B.P.) and 20,000 years B.P., within the last glacial period—is characterized by great instability, with opposing climate transitions including at least six colder Heinrich (H) events and fourteen warmer Dansgaard–Oeschger (D-O) events. … During the D-O events, the high-latitude warming occurred abruptly (probably in decades to centuries), reaching temperatures close to interglacial conditions. Even though H and D-O events seemed to have been initiated in the North Atlantic Ocean, they had a global footprint. Global climate anomalies were consistent with a slowdown of AMOC and reduced ocean heat transport into the northern high latitudes.”
Bad measurements = measurements that are too high (400 to 500 ppm) from the same core as the lower measurements come from. In other words, the “acceptable” measurements are selected arbitrarily.
https://pdfs.semanticscholar.org/1c77/5f268fc03fa707dc95904cdc8e8394af9029.pdf
“Neftel, et al. reported in 1982 rather high median CO2 concentrations in the preindustrial ice core from Byrd, Antarctica, of about 330 and 415 ppmv, with maximum value reaching 500 ppmv. However, in 1988, in the second publication on the same core, Neftel et al. did not show these high readings; the highest concentration reported was 290 ppmv, in agreement with the global warming theory. … Pearman, et al. [1986] “on examination of the data,” rejected 43 percent of the CO2 readings from Law Dome, Antarctica core … because they were higher or lower than the assumed “correct” values. Thus, they concluded a value of 281 ppmv CO2 for the pre-industrial atmosphere.”
*sigh*
If you don’t want to look like an ignoramus, just google “co2 solubility in water”. It is basic physics. Don’t try to deny it by “finding” non-existing contradictions.
Ferdinand claims the 16 ppmv/K formula works for the paleoclimate record and “accepted” CO2 values for the last 80,000 years. It does not. Temperatures rose by multiple degrees within a few decades as CO2 did not change. This occurred about 25 times during the last glacial. You are welcome to join him and continue to evade/deny this glaring contradiction. It’s not like doing so is going to make it go away.
Don’t be ridiculous. Don’t post conspiracy papers.
Of course it does.
You are the only one here contradicting himself. Why would something that isn’t there have to go away? It’s all in your imagination and belief in what you conspiracy sources write. This is especially strange since your side generally believes that CO2 follows temperatures which is not wrong at all.
You are clearly getting this simple thing very wrong and you are nevertheless convinced that you are right. If you were a self-reflektive skeptic you should now wonder where else you are dead wrong because of misunderstanding basic math/physics and interpreting everything with that conspiracy BS in mind.
Looking forward to the next debate where you guys show a clear lack of understanding math …
I am done accommodating your potshot misrepresentations. It’s not debating, just as name-calling and ad hominem attacks and “Don’t be ridiculous” responses are not debating. I will be deleting portions or whole comments that duplicitously use this word (conspiracy) in the future. You have been warned.
I never wrote anything about a conspiracy. I don’t use that word. You are the only one here who does. I referred to the arbitrary confirmation bias in “accepting” low pre-industrial CO2 values and rejecting the high measurements. I correctly pointed out that CO2 values from the same core showed concentrations reached 500 ppm as well as 280 ppm. These high values were reported in one (1982) paper, then excluded in another (1988), whereas the low CO2 values were allowed to remain. Why? Because the high concentrations were not consistent with “accepted” CO2 values — even though they were measured concomitantly. This is verifiable by looking at the two papers (1982 vs. 1988) themselves. Same core. Different reporting of the results.
Ferdinand claims the 16 ppmv/K formula works for the paleoclimate record and “accepted” CO2 values for the last 80,000 years. It does not.
Then support this claim. During the last glacial, the accepted CO2 values remained steady at 180 ppm throughout the 80,000 ka – 20,000 ka period. During this time, global-scale warming reached multiple degrees K within decades (+10-15 K in Greenland) about 25 times, about once every 1,000 to 2,000 years. The CO2 records do not show that there was a temperature-driven modification of the concentration during these years, as, again, the ppmv value was 180 throughout. This does not fit the formula that says for every 1 K temperature change, CO2 concentration changes by 16 ppmv. Therefore, the “accepted” CO2 concentration values must be wrong if we are to assume that the 16 ppmv/K formula is correct. Or vice versa. Both cannot be correct, as they contradict one another.
True or false:
The accepted CO2 records for the last 80,000 years indicate that CO2 concentrations did not fluctuate during the multiple-degrees K temperature changes that occurred between 80,000 and 20,000 years ago.
If false, please cite a source that shows CO2 concentrations fluctuated in response to the temperature changes during this period.
I really am done with this. This is the last time your comment will be allowed to stand after you have used the word “conspiracy” in an attempt to dismiss inconvenient-to-the-cause evidence.
I supported the claim by trying to make you google “co2 solubility in water” in order to learn how this mechanisms works. If you doubt the physics and think it doesn’t work this way, then correct them and be ready to receive a Nobel prize for this new discovery.
There is no contradiction. You posted above something about the 8.2K event. I posted a paper clearly showing how the CO2 variates in those instances. You side regularly argues how CO2 follows temperature with charts like this one: https://www.geocraft.com/WVFossils/last_400k_yrs.html
What changed? Why are you suddenly imagining that it doesn’t follow temperature?
False. See above.
Here is a close up graph of CO2 vs. temperature:
http://www.euanmearns.com/wp-content/uploads/2014/11/vostok_150001.png (Link to article this comes from
But since you asked and claim something to be true … where is your evidence? Your source?
Right … there is no evidence. It’s made up by your or your “sources”. Why? I don’t know … if you’d just learned how some of the mechanisms you are trying to argue against work. That would make you a way better skeptic and rise above the other pseudoskeptics in your niche.
Then support this claim. During the last glacial, the accepted CO2 values remained steady at 180 ppm throughout the 80,000 ka – 20,000 ka period, when global temperatures rose and fell by several Kelvin (10-15 K in Greenland within a few decades!).
That’s not supporting the claim! That’s nothing more than evasion, and you know it. Ferdinand evades addressing it too. For the ___th time, the accepted CO2 record is not compatible with the “CO2 solubility in water” formula of 16 ppmv/K. It wholly contradicts it. This graph alone overtly shows the contradiction for the Holocene…
https://notrickszone.com/wp-content/uploads/2016/11/Holocene-CO2-and-Pacific-Ocean-Heat-Content-Rosenthal-2013.jpg
(0-700 m ocean temperatures fell by -2.5 K as CO2 rose by 20 ppm)
…as well as considering the fact that the “accepted” CO2 record has concentrations staying the same (180 ppm) as global temperatures rose and fell by multiple Kelvin ~25 times between 20 and 80 thousand years ago…and the contradiction is stark. The contradiction is also featured in the 8.2 K event, when CO2 concentrations changed by only 1-2 ppm while global temperatures rose and fell by multiple degrees in a matter of 150 years.
Will you admit that the paleoclimate CO2 record is incompatible with this 16 ppmv/K formula, or will you continue to pretend that this is not what I keep on writing (and you and Ferdinand keep on evading/denying)?
Repeating: The contradiction is also featured in the 8.2 K event, when CO2 concentrations changed by only 1-2 ppm while global temperatures rose and fell by multiple degrees in a matter of 150 years.
Using the “accepted” paleoclimate CO2 concentrations from the last 80,000 years, it does follow temperature very generally and loosely, especially the lag during the glacial-interglacial transition (between 20,000 to 10,000 years ago). But after and before that, the connection doesn’t work. Something is wrong with the “accepted” CO2 values. This is pointed out by Dr. Salby in his 2012 textbook.
http://www.langtoninfo.com/web_content/9780521767187_frontmatter.pdf
“The resemblance between observed changes of CO2 and those anticipated from increased surface temperature also points to a major inconsistency between proxy records of previous climate. Proxy CO2 from the ice core record (Fig 1.13) indicates a sharp increase after the nineteenth century. At earlier times, proxy CO2 becomes amorphous: Nearly homogeneous on time scales shorter than millennial, the ice core record implies virtually no change of atmospheric CO2. According to the above sensitivity, it therefore implies a global-mean climate that is “static,” largely devoid of changes in GMT and CO2. Proxy temperature (Fig. 1.45), on the other hand, exhibits centennial changes of GMT during the last millennium, as large as 0.5–1.0◦ K. In counterpart reconstructions, those changes are even greater (Section 1.6.2). It is noteworthy that, unlike proxy CO2 from the ice core record, proxy temperature in Fig. 1.45 rests on a variety of independent properties. In light of the observed sensitivity, those centennial changes of GMT must be attended by significant changes of CO2 during the last millennium. They reflect a global-mean climate that is “dynamic,” wherein GMT and CO2 change on a wide range of time scales. The two proxies of previous climate are incompatible. They cannot both be correct.” pg. 254
The accepted CO2 records for the last 80,000 years indicate that CO2 concentrations did not fluctuate during the multiple-degrees K temperature changes that occurred between 80,000 and 20,000 years ago.
Uh, no, not false. See the very abbreviated list from the comment below indicating that global temperatures rose by multiple degrees within decades ~25 times during 80,000 to 20,000 years ago as CO2 concentrations remained steady at 180 ppm (the “accepted” values for the last glacial).
https://notrickszone.com/2018/08/27/agw-gatekeepers-censor-the-co2-climate-debate-by-refusing-to-publish-authors-response-to-criticism/comment-page-1/#comment-1272546
Kenneth,
Sorry, it gets too messy anyway to respond in detail to all what is said.
Only a few points and then it ends here fore me:
1. About Beck’s compilation:
I have discussed the historical data with him with specific the 1942 “peak” of 80 ppmv over 7 years up and back down.
That alone is practically impossible: that means that a similar quantity as about 1/3 of all vegetation was burned down and regrown in each 7 years. Or that there was such a sudden release from the oceans (which is possible with a sudden acidification) and absorption back, which is simply impossible in such a short time span.
The main problem is not the methods used (with a few exceptions), but where and when was measured: midst of towns, forests, fields and sporadic on seaships and coastal. If you take the latter, the values are around the ice core levels of the same gas age.
The 1942 “peak” is mainly based on two long series: Poonah (India) and Giessen (Germany). The first series is from measuring under, inbetween and over growing crops: completely unsuitable to know anything about “background” CO2 of that time. The second series is more interesting, as there is a modern station at a few km distance of the historical station. Here a few days of CO2 measurements in summer under inversion:
http://www.ferdinand-engelbeen.be/klimaat/klim_img/giessen_background.jpg
The historical measurements were taken 3 times a day, of which two at the flanks of the daily peaks…
Again no connection with “background” (=95% of the atmosphere) at all.
Further, there is no, zero, nada indication of any 80 ppmv peak in any other CO2 measurement (ice cores) or proxy (even not in your beloved stomata data) around that time.
The same problem for older data: it is impossible that in the same year values are found of 350 to 550 ppmv. Either these were measured at the wrong places or the methods failed or the skills failed…
Fact is that Calendar did choose the best available methods and figures based on stringent a-priory criteria, and his CO2 levels were decennia later independently confirmed by ice core CO2 levels.
About Dr. Jaworowski:
If you don’t know the difference between the age of the ice and the average age of the enclosed gas and don’t know that CO2 may diffundate from higher levels to lower, not reverse, then what can I trust anything what he said?
If you measure CO2 levels in ice of the same depth and find a lot of spread, the real CO2 level of that period is not the average or median of the samples: the high levels were proven contaminated with drilling fluid. If you retain these contaminated data, you are just fooling yourself and science…
About the 16 ppmv/K ratio: that is the real, observed ratio over the past 800,000 years. With a lag. Which doesn’t mean that that ratio is exact the same at every moment over every period. After a period of warming, CO2 levels remain high for thousands of years, while temperature already drops, thus the ratio changes.
As expected, this comment does not address the incompatibility of the accepted CO2 record with the accepted temperature changes of the last 80,000 years. You’ve refused to address the lack of CO2 change during the last glacial, when temperatures changed by several degrees while CO2 did not. This occurred at least 25 times. The 8.2 K event is another contradiction.
If it’s “real”, why doesn’t it work?
Continuing to evade these glaring contradictions will not make them go away. It is a fatal flaw in your “explanation”. That’s why I tend to look at Dr. Berry’s analysis as more reliable than yours, as he clearly undermined your case in your July debate in the comment section here:
https://edberry.com/blog/climate-physics/agw-hypothesis/preprint-a-fatal-flaw-in-global-warming-science/
If you can’t be bothered to learn things that are outside of your beliefsystem, then you can’t be helped and will forever be trapped in that pseudoskeptic realm of yours.
What?! Why do you ignore “accepted” science that I linked to? No, the CO2 record didn’t stay flat at 180 ppm for 60000 years. WTH?!
What the actual f***?!? Do you ever read stuff that other people post?
https://www.ncbi.nlm.nih.gov/pmc/articles/PMC129389/
CO2 declined by 25 ppm … not 1-2 ppm.
When you finally admit that you have no idea about the physics involved in this … then I will admit to anything you want my stubborn friend. Seriously, this is ridiculous on so many levels.
No, something is wrong with you and Dr. Salby’s “textbook”. Be a skeptic, don’t fall for stuff like that.
Get this out of your head please. The CO2 concentration was not steady at 180 ppm for 60000 years. Why are you claiming that this is the case when others throw data at you that clearly says it isn’t the case?!
I’ll stop here, since scrolling upwards to find the correct reply link is getting more difficult with each reply. You are dead wrong on this. Be a better skeptic and finally learn how those mechanisms work and maybe feel rewarded when you can identify the disinformers in your ranks with ease afterwards.
I know you will not act when someone like me tells you this, but seriously … go to a nearby college/university and ask anyone in the physics department, maybe even a student, and be surprised.
Excuse me. I should have written that “accepted science” says CO2 stayed steady (+/-10 ppm) at 190 ppm (not 180 ppm) throughout the 60,000 to 20,000 years ago of the last glacial…
https://climate.nasa.gov/system/resources/detail_files/24_co2-graph-021116-768px.jpg
…as temperatures simultaneously rose by multiple degrees within decades, contradicting the 16 ppmv/K narrative.
Not according to more recent science:
https://agupubs.onlinelibrary.wiley.com/doi/full/10.1002/2013GL058177
“We observe a small, about 1–2 ppm, increase of atmospheric CO2 during the 8.2 ka event.”
Worse for you, the 8.2 K “cooling” event also had temperatures rise by the same amount they cooled (multiple degrees) within a span of about 70 years. So your claim that CO2 declined by 25 ppm as temperatures fell and then rose by multiple degrees within a total span of 150 years is also contradictory.
Ad hominem attacks aren’t helping you here, SebastianH. Putting the word textbook in quotes, implying it’s not a real textbook, accomplishes what?
According to NASA (see graph above), it was steady at 190 ppm (+/-10 ppm) between 20,000 and 60,000 years ago.
Kenneth,
From your first link:
“Although the average global temperature change at the 8.2 ka event is not well known, paleoclimatic data and model results indicate that the magnitude of cooling in the Northern Hemisphere is greater than that of warming in the Southern Hemisphere”
The 8.2 kyr event did show a cooling in the NH, but there still was warming in the SH. So the average global temperature may have been a little lower, but that is not certain. They further go on:
“Previous studies for the last glacial and deglacial periods indicate that long Greenlandic stadials (cold periods) and associated major Antarctic warmings accompanied reductions in AMOC and CO2 increases of up to 20~40 ppm on multimillennial time scales”
Thus you were fooling yourself by looking only at NH temperature events, while the SH warmed in counterbalance over the same periods.
CO2 responds to global ocean surface temperatures, not to hemisperic temperatures. In contrast, CH4 mainly responds to NH hemispheric land temperatures, as that are mainly land based emissions, with the NH as langest land area.
The 8.2 K event involved both cooling by multiple degrees and then warming by multiple degrees — and the changes occurred in both hemispheres. Meanwhile CO2 values changed by just 1-2 ppm throughout this 150-year abrupt climate shifting period, contradicting the 16 ppmv/K narrative.
As does this contradict the 16 ppmv/K narrative:
https://notrickszone.com/wp-content/uploads/2016/11/Holocene-CO2-and-Pacific-Ocean-Heat-Content-Rosenthal-2013.jpg
-2.5 K cooling —> 25 ppm CO2 rising
Kenneth: “Not according to more recent science”
Permission to use this in future conversations? And please never post anything old again then, since you seems to agree now, that new trumps old.
Seriously, you want us to argue against a textbook? Anyone can write a textbook, that doesn’t make its content correct. And since you are a skeptic or at least claim to be one, you should be very very skeptical about such sources. Why aren’t you?
You realize the NASA graph you posted is from the Vostok core?
Again, here is a website with more detailed graphs:
http://euanmearns.com/the-vostok-ice-core-temperature-co2-and-ch4/
Including this one:
http://www.euanmearns.com/wp-content/uploads/2014/11/vostok_150001.png
No, the CO2 level is not steady (+- 10 ppm) around 190 ppm for 10000th of years. Not even a bad eyeballing of that NASA graph you posted would get you these numbers. So where do they come from? Why do you believe that this is “the accepted CO2 record”?
No, they didn’t. But go ahead and ignore science like you always do …
You have no idea how this mechanism works, do you? It’s really sad when people try to argue against something they don’t understand …
Kenneth: “Not according to more recent science”
How amusing. A prototypical response. No, I didn’t write that “new trumps old” or indicate that older papers cannot or should not be used. Instead, I pointed out that a more recent paper contradicts the paper that you believe is true. I didn’t claim that the more recent one which found the CO2 fluctuated by 1-2 ppm is “right” whereas your paper is wrong. Instead, they’re different, which only goes to underscore just how unreliable and arbitrary the paleo-readings for CO2 are—wholly supporting the point I have been making.
Like Ferdinand, you probably believe the currently accepted paleo CO2 figures are “excellent” measurements. The skeptic says: So if they’re so accurately measured, why is it that within a matter of a few years one result is reached (-25 ppm) that contradicts another (+1-2 ppm) more recent measurement? In contrast, the believer says the one that doesn’t agree with his presuppositions must be wrong, and the one that does agree must be right. I don’t know what’s “right”. But I think it’s highly likely that both are wrong, and that our records of CO2 for the ancient past are likely quite inaccurate, as “No study has yet demonstrated that the content of greenhouse trace gases in old ice, or even in the interstitial air from recent snow, represents the atmospheric composition.”
True. And yet notice what you did here. I selected a quote from Dr. Salby’s textbook that says that the currently accepted CO2 values for the ancient past contradict the temperature results, and thus both cannot be right. Instead of addressing this point directly, you just characterize Salby as a non-scientist who wrote a fake textbook. This is why I wrote that ad hominems aren’t helping you here.
@Kenneth Richard 6. September 2018 at 3:30 PM
The problem is that: “new trumps old” = “erase the past”
Now where have we heard THAT before? lol
If you don’t know where you’ve been, how can you know where you are going?
Historical ignorance is a smokescreen used by charlatans to conceal the fact that not only do they not know where they’ve been or where they are going, but they invariably don’t even know where they are. But, more important, they don’t want you to know, either.
Kenneth,
“No study has yet demonstrated that the content of greenhouse trace gases in old ice, or even in the interstitial air from recent snow, represents the atmospheric composition.”
That was written by Dr, Jaworowski in 1997. Again completely at odds with the knowledge of even that time.
Etheridge e.a. published their work at three Law Dome ice cores in 1996, refuting most of Jaworowski’s objections.
First, there is a 20 year overlap (1960-1980) between CO2 in ice and direct measurements at the South Pole. As CO2 levels are practically the same at the Pole and at the edge of the Antarctic mainland, the match is almost perfect (within the 1.2 ppmv repeatability of ice core measurements):
http://www.ferdinand-engelbeen.be/klimaat/klim_img/law_dome_sp_co2.jpg
Second, Etheridge e.a. measured CO2 levels in the firn pores top down from the surface to where there were no open pores left. That shows the gradient in CO2 levels:
http://www.ferdinand-engelbeen.be/klimaat/klim_img/law_dome_firn.jpg
As you can see, top firn CO2 levels match the South Pole measurements and gradually decrease to where the pores are fully closed. At that moment there is no exchange with the atmosphere anymore and the average age of the CO2 levels found is about 7 years older with 10 ppmv less than in the atmosphere.
The surrounding ice at that depth is already 40 years old.
That means that there is a 33 difference between gas age and ice age. Something Jaworowski in a direct correspondence with me denied.
Thus not only is the above objection completely wrong and only shows that he didn’t read the scientific literature of that time. Still accused others of manipulation by “arbitrarely shifting the data to match the Mauna Loa data” while he used the wrong data column (of the ice age data, not the gas age data) himself.
Thus, please, Kenneth, let him rest in peace together with his ideas about the unreliability of ice cores, as only his own opinion was completely unreliable…
Ferdinand, see if you can explain why it is that high CO2 measurements (i.e., 500 ppm) were reported in ice cores in 1982 and then, using data from the very same core, these high CO2 values were not reported in 1988. Why did Neftel et al. (1982) arbitrarily decide to reject some measurements and not others?
For that matter, can you scientifically support the practice of rejecting 43 percent (!) of the measurements from a core as Pearman et al (1986) did? Are “scientific” polls that toss out 43% of the “wrong” responses actually scientific? Please provide the scientific reason why some CO2 measurements were kept and others were discarded…from the same core! Because that’s how your “excellent” measurements were obtained.
http://21sci-tech.com/2006_articles/IceCoreSprg97.pdf
“Neftel, et al. reported in 1982 rather high median CO2 concentrations in the preindustrial ice core from Byrd, Antarctica, of about 330 and 415 ppmv, with maximum value reaching 500 ppmv. However, in 1988, in the second publication on the same core, Neftel et al. did not show these high readings; the highest concentration reported was 290 ppmv, in agreement with the global warming theory.”
“Pearman, et al. [1986] “on examination of the data,” rejected 43 percent of the CO2 readings from Law Dome, Antarctica core … because they were higher or lower than the assumed “correct” values. Thus, they concluded a value of 281 ppmv CO2 for the pre-industrial atmosphere.”
Or, since you maintain the belief that CO2 measurements are “excellent” (your word), why did one set of measurements say that CO2 values dropped by -25 ppm during the 8.2 K event, and then, a few years later, other measurements showed CO2 values
rose by +1-2 ppm. Why and how could these measured values change so dramatically if they are as “excellent” as you’ve contended?
Kenneth,
“Why did Neftel et al. (1982) arbitrarily decide to reject some measurements and not others?”
Well for the simple reason that the ice at that depth was contaminated with drilling fluid.
It is impossible that at the same depth large differences in real CO2 levels are found.
Ice from different ice cores with extreme differences in accumulation rate and average temperatures show the same CO2 levels for the same periods within 5 ppmv. If the differences within one core at the same depth are larger, then there is something wrong with the sample(s).
Problems were found at two depthe for the 22 depths measured. The comment of Neftel e.a. for the wide range for these two depths was that drilling fluid was observed in the large samples needed for the analytic methods of that time.
Inclusion of drilling fluids (a mix of gasoil and a freon) – and thus cracks in the ice – may lead to too high values, never too low.
Nevertheless, Neftel was right to only retain the lowest values, as more recent (2007-2008) modern measurements of the same core at a much higher frequency with smaller samples, avoiding the contaminated places, shows no high outliers and a difference of only 1-5 ppmv between 2 or more samples taken from the same depth. See:
http://www.usap-dc.org/view/dataset/609314
And download the different items there, which are very interesting.
“rejected 43 percent of the CO2 readings from Law Dome, Antarctica core … because they were higher or lower than the assumed “correct” values.”
From Etheridge 1996 about Law Dome CO2 measurements:
“Ice core results”.
“A total of 95 ice samples were measured. Of these the results of 11 were discarded because the following problems were identified: leaks in the vacuum line or extraction flask (6 samples), post coring melting (2 samples), GC problems (power failure and too small sample size, 2 samples), inadequate sample cryotrapping (1 sample).”
Again Jaworowski assumes selective bias from the researchers, while that were problems with the samples or measurements…
Kenneth, CO2 measurements in Antarctic ice cores are excellent, global, but averaged over 10 to 600 years, depending of the snow accumulaiton rate.
CO2 measurements in Greenland ice cores are problematic due to frequent highly acidic deposits of volcanic dust from nearby Iceland, which produces in situ CO2 with carbonate dust from the oceans.
CO2 levels from stomata data are proxies: regional, locally biased over land and measured in an atmosphere with large excursions on hourly to centennial scales.
In this case the NH stomata data may reflect the regional CO2 changes over land due to changes in the changed main wind direction during the growing season, as probably also was the cause during the LIA (normally SW, then probably more East). Anyway not global CO2 level changes.
“Why did Neftel et al. (1982) arbitrarily decide to reject some measurements and not others?”
Written like a true believer. Of course, it just so happens that each and every one of the “bad” (i.e., the 400 ppm to 500 ppm) CO2 measurements were contaminated. All the “good” measurements weren’t. Why? Because they were right. We know this because…we know what the “right” measurements are. The “right” measurements are the ones that agree with our presuppositions. The “wrong” ones are the ones that don’t. Disagree? Then you’re wrong.
The above is pretty much what each and every “rebuttal” amounts to. This is why it’s pointless to engage in debates with you. Your mind is completely closed.
There has NOT been adequate accounting for the VAST increase in natural CO2 release due to the slight but highly beneficial warming.
Its a huge case of cognitive dissonance from the AGWers.
They moan and wail about increased methane from warming Arctic areas,
(methane breaks down to CO2 in the atmosphere)
.. extra CO2 release from melting ice
We know from ice cores that warming causes atmospheric CO2 to increase.
And they turn around and say humans are responsible for 100% of the increase.
DOH !!!!!
Nobody is saying that this is not the case.
Only “skeptics” believe that CO2 concentration increases can be caused only/mostly by temperature increases and not by actually putting more CO2 into the atmosphere by means of burning stuff. Skeptics also believe that it works like putting 4% milk and 96% into a coffee cup that leaks, resulting in a mixture of 4% and 96% milk/coffee in the cup at equilibrium (Ed Berry’s version of a CO2 analogy that mirrors the Harde version).
Only moronic brains-hosed closed-minded, gullible AGW cultists believe human CO2 contributes more than about 15% of the highly beneficial rise in atmospheric CO2.
And yet another MORONICALLY IRRELEVANT analogy that is totally unrelated to what is happening in REALITY..
ROFLAMO…
You truly are into your own slap-stick comedy, little seb.
Do you practice in front of your mirrors as you preen yourself ??
If you are pressed for time, Ferdinand, just watch from where this begins through to the 11:00 minute mark.
https://youtu.be/sGZqWMEpyUM?t=481
It ain’t us humans what’s causing all the increase in atmospheric CO2. It just doesn’t add up.
Of course it adds up, it more than adds up. That’s the problem … apparently the ability to sink CO2 must have increased or nature now emits less CO2.
Poor seb, digging deeper and deeper..
.. into his own BS. !!
TOTAL lack of comprehension of physics and maths… poor seb.
Even a MINOR change in Natural CO2 would swap human contribution.
And the NATURAL warming would have caused a HUGE increase in NATURAL CO2 emissions.
Listen to Salby, and try to OPEN YOUR PADDED mind, if you have the capability.
I KNOW that you do NOT have that capability.
Your mind is TOTALLY CLOSED TO REALITY.
I love this argument, so let’s assume a BIG change instead. Since you seem to think my math is wrong, feel free to correct it … anytime.
So we have 96 units of natural emissions, 4 units of human emissions and apparently 98 units of absorption. We are observing an increase of roughly 2 units per year, aren’t we?
Good, now let’s assume natures emissions changed “BIGLY”. 20 units more, but we still observed only an increase of 2 units in those years. So absorption must have increased too and since humans emitted 4 units the share is now 116 + 4 – 118 = 2.
Correct or incorrect?
Now what would have happened if humans didn’t emit those 4 units? Would the concentration still increase by 2 units? What do you think?
So, just more junior maths, with ZERO comprehension
Just make up some numbers seb.. FANTASISE !!!
“116 + 4 – 118 = 2”
So you are saying that nature has now absorbed 118/120 of the total, correct seb?
So its absorbed 3.9333 units out of the 4 units of human produced.
You seem to be finally on the right path, little-mind.
You aren’t seriously suggesting that the human CO2 is NOT absorbed in the same proportion as the total? Surly even you aren’t that dumb?
Your basic IGNORANCE and LACK of understanding of the effect of warming on ALL biological matter is quite expected.
And in your 96 natural to 4 human CO2 example, with 98 absorbed, 98 out of a total of 100 is absorbed back by nature, so 3.92 parts of the 4 parts human CO2 is absorbed.
Increase due to human CO2 is only 0.08 parts, and the extra absorbed makes plant-life so much happier.
Spike55,
“So its absorbed 3.9333 units out of the 4 units of human produced.”.
Wrong reasoning…
The sinks do absorb 118 out of 120 inputs as mass, but that mass has not the ratio of the inputs, that has the ratio of what is in the atmosphere at that moment.
If you start with zero human emissions and a total of 400 units in the atmosphere (A), in that year you have 116 natural units in (N) and out (S) and still 400 in the atmosphere.
Year 1: add 4 units human CO2 (H)
Composition A and S: 99% N, 1% H
116 N + 4 H in; 118 S out (*); 402 A
98% of H remains in the atmosphere.
Year 2: add 4 H
Compo A and S: 98%, 2% H
116 N + 4 H in; 118 S out (*); 404 A
96% of H remains in the atmosphere.
….
In both years the entire increase is from human emissions…
(*) Of course a small increase of 4 units will not invoke an extra sink of 2 units, that will need far more accumulation of units…
“ratio of what is in the atmosphere at that moment.”
So even LESS than 0.06666 of human CO2 remains.
Thanks, ferd, for clarifying that.
You seem to think that NATURAL CO2 is not climbing with the increase carbon cycle activity.
What a bizarre conjecture, when the carbon cycle will ALWAYS continue to increase to match the available CO2.
Be very glad that human CO2 kicked the carbon cycle out of its lethargy, or there would be FAR less food to feed the increasing population.
Spike55,
Again wrong reasoning:
The part of human CO2 that is absorbed is much smaller than what remains, thus it is the latter which causes all the increase in the atmosphere…
Further:
The largest natural cycle is the seasonal cycle: 110 GtC CO2 in and out over the seasons. Problem for you: the cycle is entirely driven by temperature and near independent of the amount (= pressure) of CO2 (human or not) in the atmosphere:
http://www.ferdinand-engelbeen.be/klimaat/klim_img/seasonal_CO2_MLO_trend.jpg
Despite some 30% more CO2 in the atmosphere, the amplitude of the seasonal cycle hardly increased…
In the second period, the residual CO2 increase doubled, but human emissions also doubled and in both cases human emissions were about twice the residual CO2 increase in the atmosphere.
It is the difference between human emissions and increase in the atmosphere which is stored in the oceans and more permanent vegetation. Still humans are responsible for near all of the increase.
That doesn’t tell us anything about the effect of the increase: that is – in my opinion – very modest and no reason to panic.
“The part of human CO2 that is absorbed is much smaller than what remains,”
NO, nearly ALL the human CO2 is absorbed.
Seb-maths shows that to be the case.
Plus there is an ever increasing contribution from natural CO2 emissions as the carbon cycle expands.
Spike55:
Seb-maths shows that to be the case.
Plus there is an ever increasing contribution from natural CO2 emissions as the carbon cycle expands.
Sebastian made an error, as the composition in the sinks has not the same ratio as the natural vs. human inputs.
Indeed the sinks expand with the human input, but that is not with 2% for 4% extra input. One need 110 ppmv extra CO2 in the atmosphere (30%) to expand the sinks with 2%. Thus most human CO2 simply accumulates in the atmosphere (as mass, not the original molecules)…
The carbon cycle dictates that the TOTAL SOURCES expand as the atmospheric CO2 increases.
There is a VERY large increase in CO2 sources as warm areas expand.
All that old dead carbon that dies and was frozen, can now decay properly.
Methane clathrates that the alarmist so love to panic about, thawed peat bogs, massive increase in the area of termite activity and carbon decay
Stop thinking that NATURAL sources have had minimal change. They have almost certain expanded by a FAR GREATER amount than human CO2 activity.
And as I said before. If humans really are responsible for a reasonable percentage of atmospheric CO2 increase.. the more the merrier.
.. BRING IT ON 🙂 !!!
Spike55:
The carbon cycle dictates that the TOTAL SOURCES expand as the atmospheric CO2 increases.
No way that the sources expand, the sinks expand, but the ocean part of the sources shrinks with higher CO2 (pressure) in the atmosphere and there is small increase in total CO2 emitted by the decay of the increased amount of organic debris, but that can’t never be more than what is extra taken away by the same vegetation during the growing season.
Methane and CO2 releases from the warming seabottom and melting permafrost still are minor sources. During the previous interglacial, temperatures in the circumpolar high north were 5-10 K higher than today. All permafrost was melted and trees were growing up to the Arctic Ocean, where nowadays only tundra vegetation grows. CO2 in that time: 310 ppmv. CH4: 700 ppbv. CO2 today: 410 ppmv, CH4: 1900 ppbv. That increase is not natural.
I do agree that 1000 ppmv (as used in greenhouses) is far more beneficial for most vegetation on earth than the pre-industrial levels. But it does the sceptics case more harm than good by objecting against the human role in the CO2 increase…
WRONG AGAIN, ferd.
Cold ocean areas that have warmed up naturally release their CO2.
Do you really not understand that the oceans aren’t the same temperature everywhere ???
WOW. !!!
Mr. Ferdinand,
John has observation.
If nature sink 150 Giga tonne of CO2 and produce is 150 Giga tonne the ppm in the atmosphere no change.
Now say produce goes up 160 Giga tonne and sink 160 Giga tonne also no change. PPM no telling us how much CO2 come in or go out!
If ppm goes up we only know that produce is more than sink.
Ken show very good information and paper. Your position very human centric, not even allowing nature to play part. Other position more careful, not saying knowing all. John think this better.
John other observation in Mr. Ferdinand post. He says “warming seabottom”
Where is warming? Sea bottom very special in deep sea all same temperature. Mr. Ferdinand has source John can read?
Yonason,
I have been in London for an earlier speach of Dr. Salby in the London Parliament. I had a lot of questions for him, but there was too little time to discuss things out. Still waiting for an open discussion with him on WUWT or anywhere else…
For this case: what Dr. Salby doesn’t take into account is that any increase in the atmosphere above equilibrium (290 ppmv for the current sea surface temperature) increases the sinks into the cold oceans near the poles (and reduces the releases at the equator). Thus even with increased human emissions, there may be zero increase in rate of change of CO2 in the atmosphere for some period.
Natural variability in the CO2 rate of change is +/- 1.5 ppmv, while human emissions are around 4.5 ppmv/year nowadays.
One can calculate the theoretical increase in the atmosphere from the emissions at one side and the calculated net sink rate at the other side (with a decay rate of about 50 years):
http://www.ferdinand-engelbeen.be/klimaat/klim_img/dco2_em2B.jpg
calculations are still midst of the natural noise…
@Ferdinand Engelbeen
I’m afraid that you can’t assail Salby’s equations. They are solid, and involve very straightforward basic calculus similar to that used in solving problems one gets as an undergrad. And he makes few and solid assumptions, as well.
You aren’t going to be able to persuade me he’s wrong by replacing his calculations with yours. Yours just aren’t rigorous enough. If you want to show he’s wrong, you’ll have to do it some other way, and be as painstakingly organized and detailed about it as he is. If not, you won’t get anywhere, even if you by some odd chance happen to be correct. E.g., if all Einstein had said was “Gravity works by bending space and time.” but couldn’t write down equations for it that made sense and gave the right answers, no one would have believed it. They barely did as it was. Even if he had the correct equations, but presented it in a sloppy way, his paper probably wouldn’t have been accepted, as crazy as it was to them at that time. (Some people still think he was wrong!)
Just one point about your post above. You write that “Natural variability in the CO2 rate of change is +/- 1.5 ppmv, while human emissions are around 4.5 ppmv/year nowadays.” But we can’t separate out the contributions, because we don’t know the processes involved. Slaby’s method is so powerful because he doesn’t need to know what they are a priori to solve his equations. Since no one knows what they are, you can’t know either, and that means you’re guessing, which makes the likelihood of you’re being correct very very slim.
Regards
Well, for once Yonason is right on something. You need to be able to express your findings in a way people understand.
But the problem here is obviously you misunderstanding the equations and mechanisms involved and seeing someone like Salby as an authority on this topic while it basically is settled science.
The fun part here is that the established models also don’t need to know anything about nature’s emission or absorption rates. We can observe the changes in CO2 concentration and what we emit. If the change in concentration were higher than what we emit, we could not be sure, but it’s not … so it is pretty much certain, what causes the increase.
It’s like pouring a cup of water into a bucket of water and taking only half a cup of water out of the bucket. You can very clearly attribute the water level rising to the cup of water, even though it doesn’t mean a 100% of that water is still in the bucket.
OMG, seb rants, then another mindless analogy, which shows he has basically zero comprehension of the REALIY of the situation.
So Funny.
“so it is pretty much certain, what causes the increase.”
NO, your own calculations have shown that human CO2 has only contributed 0.01 out of 2 of the increase.
I still don’t know why you are arguing that humans contribute so much. Its just mindless trolling, uisn’t it
I mean, we KNOW human emissions will just keep on rising as the third world countries develop. So there is NOTHING your ranting can do about atmospheric CO2 levels continuing to increase.
All you do with your rabid anti-science beliefs is cause yourself even more desperate panic..
You will send yourself even further into the depths of manic depression.
So you weren’t trolling to annoy me, you really mean that? Wow. And you have the audacity to call me math challenged?
You have no idea. I’m having fun observing people like you, but sometimes I am really in awe what you come up with. I am sure professional therapists would pay you to have a chat with you.
Yonason,
I have a background of chemical engineering, be it that my math is completely rusty. My main job in a chemical factory was intrducing new products. With all the problems that caused. My strength was finding the cause of the problems, often much faster by eliminatong the impossibilities than by searching for the possible sources…
Dr. Salby made an essential error by integrating temperature and declaring that was the cause of the CO2 increase. Even without any math it is clear that the integral of temperature is a meaningless, unphysical unit.
In essence, a small, sustained offset in temperature from a base line will supply a CO2 increase until eternity without any response of the increased CO2 pressure in the atmosphere…
Either compare T with CO2 or the derivatives dT/dt with dCO2/dt. Not the integral of T with CO2, neither T with dCO2/dt as some others do.
Here all the natural variability of the extremes (Pinatubo, 1998 El Niño): +/- 1.5 ppmv around a trend of about 90 ppmv:
http://www.ferdinand-engelbeen.be/klimaat/klim_img/wft_trends_rss_1985-2000.jpg
Here all the variability in the derivatives (including the δ13C changes to check the cause of the variability):
http://www.ferdinand-engelbeen.be/klimaat/klim_img/temp_dco2_d13C_mlo.jpg
As you can see, there is a lag of CO2 after T changes in both the direct measurements and the derivatives. There is no lag between CO2 and δ13C changes, which are opposite to each other. That means that the main CO2 reaction on T changes is from vegetation, not the oceans.
But vegetation is a small, but growing sink over periods longer than 3 years, the earth is greening. Thus not the cause of the increase.
Neither are the oceans which show more sink than source in global seawater pCO2 sampling.
At any moment in time, the carbon mass balance nust be obeyed. We know with reasonable accuracy human emissions and we know with high accuracy how much CO2 is in the atmosphere. The difference is what nature as a whole does.
For the current amounts, that is:
increase in the atmosphere = human emissions + natural sources – total sinks.
2 ppmv/year = 4.5 ppmv/year + X – Y
X-Y = -2.5 ppmv/year.
No matter if
X = 10 ppmv/year and Y = 12.5 ppmv/year
or
X = 100 ppmv/year and Y = 102.5 ppmv/year
or
X = 1000 ppmv/year and Y = 1002.5 ppmv/year.
How huge the exact individual natural fluxes are or how much they changed over the years is not of any interest for the balance, as we know the net total: a net sink in every year of the past 60 years and thus human emissions are the main cause of the increase.
@Ferdinand Engelbeen 1. September 2018 at 9:55 PM
That’s more specific – something to work with. I need to go back and look again at what he said, before I comment further. I think I know what you’re referring to, and that it doesn’t mean what you think it does, but it’s worth another look.
Thanks
(He has several videos, so if you could let me know which you are referring to, that would be even more helpful.)
Yonason,
Have a look at https://www.youtube.com/watch?v=O8niiyDn2FI
The subject of interest starts at about 13 minutes.
While he correctly shows that temperature changes induce the variability of the CO2 rate of change, he then integrates the CO2 rate of change, thus attributing all increase to natural CO2.
In reality, the temperature rate of change is all variability and no trend at all, only a small offset from zero and all trend is from human emissions:
http://www.ferdinand-engelbeen.be/klimaat/klim_img/temp_dco2_d13C_mlo.jpg
@Ferdinand Engelbeen 3. September 2018 at 12:31 PM
You write: “Even without any math it is clear that the integral of temperature is a meaningless, unphysical unit.”
What Salby said was
1. Temp has no effect on human emissions.
2. Cumulative surface temp is what drives natural emissions.
“Cumulative surface temperature” would be determined by the area under the curve of temp vs time, and that is technically an “integral.”
And, yes, it appears to be an “unphysical” quantity, but if CO2 actually responds as if it is, then treat it as such in that case. I.e., if it can be used to calculate something, use it. There is ample engineering precedent for doing that (specific heat exchange applications, as I recall).
Remember, the global average temperatures, and even more so the residual “anomalies” that the warmists obsess over and want to terrorize us with are also very “unphysical.” And they don’t even appear to cause anything, so using them as metrics for climate health does not appear to be justified.
@Ferdinand
Just one more comment on your…
“Even without any math it is clear that the integral of temperature is a meaningless, unphysical unit.”
Not always. It depends on what situation you are talking about, and to know that you DO have to know the math. For instance…
PV = nRT
At const pressure, PdV = nRdT
Integrating that you get P(V2-V1) = nR(T2-T1), which is the relationship of temperature and pressure for an ideal gas.
And, as I wrote, if indeed [CO2] is dependent on accumulated temperature, Salby may well be justified in “integrating,” Temp over time.
There are times when you can integrate it and it will make sense, and there are times when you can’t. Sorry I didn’t go into that detail before, but it occurred to me I should be a bit more explicit. Lots more, but that should do.
Brief overview.
https://ocw.mit.edu/courses/mechanical-engineering/2-141-modeling-and-simulation-of-dynamic-systems-fall-2006/lecture-notes/ideal_gas.pdf
And just one more, F.E.
Here’s his Hamburg presentation, starting at the point just before he begins the harder math, including the integration of temperature.
https://www.youtube.com/watch?v=2ROw_cDKwc0&feature=youtu.be&t=648
Looks legit to me.
Time to move on.
“be it that my math is completely rusty.”
And you make way too many unfounded assumptions.
If you REALLY think that the gradual build-up of temperature/energy, due mostly to solar activity, is NOT important to natural CO2 emissions, then it really is not worth even bothering with trying to get you to accept a more realistic point of understanding.
Yonason,
The relationship between PdV = nRdT and PV = nRT is valid as that is directly integrating at both sides of the equation.
The T – CO2 reletionship is clear too:
http://www.ferdinand-engelbeen.be/klimaat/klim_img/wft_trends_rss_1985-2000.jpg
+/- 1.5 ppmv with a lag after T around the +90 ppmv trend
And it is clear in the relationship between the derivatives:
http://www.ferdinand-engelbeen.be/klimaat/klim_img/temp_dco2_d13C_mlo.jpg
Again with a lag of dCO2 after dT.
What gives a completely spurious correlation between the two is integrating one side and not the other side:
There is zero lag between T variability and dCO2/dt variability, thus one can as good say that dCO2/dt causes T variability – which is of course nonsense, but the reverse is wrong too. Dr. Salby is comparing the varibility – which is true, but at the same time attributing all the CO2 increase to the increase in temperature, while comparing to the detrended trend in CO2, thus largely removing the cause of the 90 ppmv increase…
I have posted a complete discussion about that point here:
https://wattsupwiththat.com/2015/11/25/about-spurious-correlations-and-causation-of-the-co2-increase-2/
Yonason,
About his Hamburg lecture:
The same problem: all CO2 rate of change variability is caused by temperature rate of change variability, not by temperature variability.
There is a lag between CO2 and T variability and a lag between dCO2/dt variability and dT/dt variability. There is no lag between T variability and dCO2/dt variability, thus you can’t attribute one as cause and the other as effect.
By integrating T, he attributes all slope of dCO2/dt to temperature, while that slope in the derivative is from the slightly quadratic increase of human emissions, followed by a similar increase of CO2 in the atmosphere and in sink capacity.
dT/dt has no slope, only a slight offset from zero which integrated makes a more or less linear slope.
Further, his formula is physically impossible (it violates the solubility of CO2 in seawater at different temperatures) without a negative feedback from the increased CO2 pressure in the atmosphere.
A small, sustained temperature step from a baseline will emit CO2 without any time or pressure limit, while in reality the increasing CO2 pressure in the atmosphere ends the temperature induced increase at 16 ppmv/K as seen over 800,000 years in ice cores and proxies (foramins over 2 million years)…
No, this is not “reality”.
As pointed out many times (and ignored each time), this 16 ppmv/K formula contradicts the paleoclimate CO2 record of the last 80,000 years (at least). Global temperatures rose by multiple degrees within decades as CO2 concentrations didn’t budge (180 ppm). This occurred over 2 dozen times during the last glacial, about once every 1,500 years. So either the currently accepted CO2 values for the paleoclimate are wrong or the formula is. They cannot both be right. And if the currently accepted (via confirmation bias) CO2 record is wrong, so is the conceptualization of an “equilibrium” CO2 value of 290 ppm, which is what this “explanation” rests upon.
Kenneth,
The 16 ppmv/K is what is what is observed over the past 800,000 years, with a lot of smoothing and lags.
That is the absolute maximum. It is the observed change in solubility of CO2 in seawater.
On shorter time frames it is only smaller, not larger. CO2 in ice cores is a highly reliable measurement in ancient air, as good as for CH4 and lotd of other gases and isotopes. The only drawback is that it is smoothed over 10 to 600 years, depending of the snow accumulation rate.
Temperature indications in ice from Antarctica are more discutable, as that are proxies based on water (vapor) isotope ratios from where the water evaporated and condensed to snow. Thus if anything is wrong, it is the temperature indication.
The Vostok ice core had a resolution of about 600 years (that is a 600 years moving average), thus may have missed faster CO2 changes.
Even so, the current 110 ppmv peak would be seen as an extra peak of at least 20 ppmv, even 800,000 years ago in any ice core of any resolution.
The resolution of the longest Law Dome DSS core has a resolution of only 20 years and a repeatability of CO2 measurements at the same depth of the ice of 1.2 ppmv (1 sigma). That would detect a 2 ppmv “peak” sustained over 20 years or a one-year peak of 40 ppmv.
That core indicates a pre-industrial global CO2 level of 280-285 ppmv.
If you have any firm indication that 1 K temperature increase gives more than 16 ppmv CO2 increase, I am very interested, as that would violate the solubility of CO2 in seawater…
Kenneth,
16 ppmv/K is the solubility change of CO2 with temperature in seawater. Observed by over 3 million seawater samples over the past centuries.
Whatever the resolution of measurements and proxies in the past, that was the MAXIMUM change measured. Smaller to no changes are seen, as the equilibrium (especially with the deep oceans) may cost a lot of time, while temperature changes were much faster than the resolution of ice cores and proxies.
Ice core CO2 measurements are excellent, temperatures are based on proxies, which still are under discussion.
Nevertheless temperature can’t be the cause of the 110 ppmv CO2 rise over the past 165 years, of which 90 ppmv over the past 60 years of direct measurements. That violates the solubility of CO2 in seawater.
Only if one employs confirmation bias and discards measurements from the same core that don’t “agree” with presuppositions while accepting as “truth” those measurements that do. Because that’s how this happened…
http://21sci-tech.com/2006_articles/IceCoreSprg97.pdf
“Neftel, et al. reported in 1982 rather high median CO2 concentrations in the preindustrial ice core from Byrd, Antarctica, of about 330 and 415 ppmv, with maximum value reaching 500 ppmv. However, in 1988, in the second publication on the same core, Neftel et al. did not show these high readings; the highest concentration reported was 290 ppmv, in agreement with the global warming theory.”
“Pearman, et al. [1986] “on examination of the data,” rejected 43 percent of the CO2 readings from Law Dome, Antarctica core … because they were higher or lower than the assumed “correct” values. Thus, they concluded a value of 281 ppmv CO2 for the pre-industrial atmosphere.”
“New light was shed on the validity of the dating of recent ice strata when six U.S. Lightning fighter planes and two B 1 7 Flying Fortresses from World War II were found buried in 1942 ice, about 200 km south from a classic Greenland site at Dye 3, where they had made an emergency landing. The planes were found 47 years later at a depth of 78 m, and not at the 12-m depth that had been estimated by glaciologists using oxygen isotope dating. … In the air from firn and ice at Summit, Greenland, deposited during the past ~200 years, the CO2 concentration ranged from 243.3 ppmv to 641.4 ppmv. Such a wide range reflects artifacts caused by sampling, or natural processes in the ice sheet, rather than the variations of CO2 concentration in the atmosphere. Similar or greater range was observed in other studies of greenhouse gases in polar ice.”
“No study has yet demonstrated that the content of greenhouse trace gases in old ice, or even in the interstitial air from recent snow, represents the atmospheric composition.”
Hmmm.
“…in a a warm water year, more than one Gt (1015 g) carbon is additionally injected into the atmosphere, in comparison to a cold water year”
Flohn, 1982
https://www2.meteo.uni-bonn.de/bibliothek/Flohn_Publikationen/K287-K320_1981-1985/K299.pdf
“The role of the carbon budget has aroused general interest among paleoclimatologists, after Delmas et al., (1980), Berner et al., (1980) and Oeschger (in et al. 1980) found evidence in Antarctic and Greenland ice cores, that the CO2-content of the atmosphere has varied between about 180 ppm during the last glacial (18 ka ago, ka = 103 years) and about 350 ppm (perhaps 400 ppm) during the Holocene warm epoch 6-8 ka ago. Due to the recent wide-spread concern about the climatic consequences of the continuous increase of atmospheric CO2 (Bach, 1980), from about 295 ppm at the end of the 19th century to nearly 340 ppm (1981), the problem of the carbon budget in atmosphere, ocean and biosphere is now thoroughly investigated.
“The recent increase of the CO2-content of air varies distinctly from year to year, rather independent from the irregular annual increase of global CO2-production from fossil fuel and cement, which has since 1973 decreased from about 4.5 percent to 2.25 percent per year (Rotty 1981). Comparative investigations (Keeling and Bacastow 1977, Newll et al. 1978, Angell 1981) found a positive correlation between the rate of increase of atmospheric CO2 and the fluctuations of sea surface temperature (SST) in the equatorial Pacific, which are caused by rather abrupt changes between upwelling cool water and downwelling warm water (“El Niño”) in the eastern equatorial Pacific. Indeed the cool upwelling water is not only rich in (anorganic) CO2 but also in nutrients and organisms. (algae) which consume much atmospheric CO2 in organic form, thus reducing the increase in atmospehreic CO2. Conversely the warm water of tropical oceans, with SST near 27°C, is barren, thus leading to a reduction of CO2 uptake by the ocean and greater increase of the CO2. … A crude estimate of these differences is demonstrated by the fact that during the period 1958-1974, the average CO2-increase within five selective years with prevailing cool water only 0.57 ppm/a [per year], while during five years with prevailing warm water it was 1.11 ppm/a. Thus in a a warm water year, more than one Gt (1015 g) carbon is additionally injected into the atmosphere, in comparison to a cold water year.”
Wagner et al., 1999
http://science.sciencemag.org/content/284/5422/1971.full
Century-Scale Shifts in Early Holocene Atmospheric CO, Concentration
“We used the rate of historical CO2 responsiveness of tree birches (Fig. 2) to derive a Preboreal atmospheric CO2 record based on the mean SI values for the fossil leaf remains. In the Friesland phase [~11,400 years ago], inferred CO2 concentrations of 265 ± 21 and 260 ± 25 parts per million by volume (ppmv) are followed by a rapid rise to 327 ± 10 ppmv and a more gradual increase to a maximum of 336 ± 8 ppmv in the early part of the Late Preboreal. Then, there is a continuous CO2 decline to a minimum of 301 ± 21 ppmv, followed by a sharp increase to 348 ± 14 ppmv. In the uppermost part of the studied interval, CO2 concentrations stabilize again to values between 333 ± 8 and 347 ± 11 ppmv. … The initial decrease of the SI in the Friesland phase [~11,400 years ago] suggests that atmospheric CO2 concentrations rose by ∼65 ppmv in less than a century.”
You keep PROVING you are maths challenged,
Do you DENY that your own calculations show that human CO2 only contributes 0.01 of the 2ppm?
If so, then you can’t even read your own child-maths.
You are kidding, aren’t you? Nobody can be this math-challenged.
Nobody can be this math-challenged.
And yet you are. !!!
Your fantasy maths clearly shows that human CO2 contributes only 0.01 parts of the 2mm/year CO2 rise
You can’t even follow your own maths !!
so funny 🙂
Your maths ability is at a low-end, remedial junior high level., but your baseless ego won’t let you admit that you need help.
Ferdinand makes mistake:
he writes:
“How huge the exact individual natural fluxes are or how much they changed over the years is not of any interest …”
How does he propose nature knows how to store away all “natural” CO2 and to keep human produced CO2 in the atmosphere.
In his example he suggests that the natural CO2 sinks are can take any amount of CO2 but only the produced from nature???
When he suggests that nature can produce and store 1000 ppm, how come that a little more CO2 from humans is not stored? Is your breath stored or is still natural?
THis flawed arguments from Ferdinand.
The most likely change of concentration of CO2 comes from an imbalance of produce and sinks, which for some reasons Ferdinand wants to ignore.
He ignores that temperature can create that imbalance.
So yes humans produce extra CO2 but its marginal compared to what nature exhales. But if this is the reason for the increase might be doubted.
Nature doesn’t know. That is the whole point.
Nope, he is suggesting that it doesn’t matter how much nature emits and absorbs. We can observe what stays in the atmosphere and thus we actually know that nature can take the amount it emits plus some of the amount we emit.
Because we observe an increase in the concentration that is less than what we emit. If it could absorb all we emit, but somehow not the “increase” in natural emissions, then this would violate the fact that nature can not decide to only absorb human CO2.
That is the case. More CO2 gets produced than absorbed. That’s why the concentration increases. We produce enough to explain the increase.
That is impossible. The temperature did not increase enough to explain it.
Marginal to what nature exhales, but about double of the yearly increase. This is really very simple math … I don’t get why skeptics go to these lengths (vodoo math?) trying to explain it away.
John Brown,
Nature doesn’t make any differentiation between CO2 from human or natural origin, but natural processes react different on temperature changes than on pressure changes.
Most of the natural flows in and out are seasonal: 110 GtC in and out, countercurrent between oceans and vegetation, where vegetation wins with a net effect of +/- 10 GtC (5 ppmv) between seasons and essentially zero effect after a year when at equilibrium with the sea surface. That is the main cause of the “residence time” of about 5 years for any CO2 molecule in the atmosphere.
If the temperature incerases, the input from the oceans increases and the sinks decrease. That gives an increase of CO2 in the atmosphere.
If the CO2 in the atmosphere increases (= more CO2 pressure), the input of the oceans decreases and the sinks increase.
This makes that the CO2 increase from a temperature change ends when a new equilibrium is reached at about 16 ppmv/K, not by coincidence the change in solubility of CO2 in seawater:
http://www.ferdinand-engelbeen.be/klimaat/klim_img/upwelling_temp.jpg
There was an increase in temperature since the LIA, good for 10-16 ppmv extra. The rest from the 110 ppmv increase is from the pressure increase by some 200 ppmv human emissions.
As pointed out many times (and ignored each time), this 16 ppmv/K formula contradicts the paleoclimate CO2 record of the last 80,000 years (at least). Global temperatures rose by multiple degrees within decades as CO2 concentrations didn’t budge (180 ppm). This occurred over 2 dozen times during the last glacial, about once every 1,500 years. So either the currently accepted CO2 values for the paleoclimate are wrong or the formula is. They cannot both be right. And if the currently accepted (via confirmation bias) CO2 record is wrong, so is the conceptualization of an “equilibrium” CO2 value of 290 ppm, which is what this “explanation” rests upon.
Kenneth,
this 16 ppmv/K formula contradicts the paleoclimate CO2 record of the last 80,000 years (at least)
Over the past 420,000 years Vostok ice core (confirmed by the more recent 800,000 years Dome C ice core):
http://www.ferdinand-engelbeen.be/klimaat/klim_img/Vostok_trends.gif
8 ppmv/K for Antarctic temperatures translates to about 16 ppmv/K for global temperatures.
Over the past deglaciation:
http://www.ferdinand-engelbeen.be/klimaat/klim_img/epica5.gif
Again with a lag and some discrepanties in trends…
The 16 ppmv/K is the observed solubility ratio in over 3 million seawater samples. In different shorter periods other influences (deep oceans, vegetation) may give a temporary deviation.
Temporary deviation? The accepted CO2 record is not compatible with the “CO2 solubility in water” formula of 16 ppmv/K. It wholly contradicts it for nearly all of the last 80,000 years. This graph alone overtly shows the contradiction for the 10,000-year Holocene:
https://notrickszone.com/wp-content/uploads/2016/11/Holocene-CO2-and-Pacific-Ocean-Heat-Content-Rosenthal-2013.jpg
(0-700 m ocean temperatures fell by -2.5 K as CO2 rose by 20 ppm)
The “accepted” CO2 record has concentrations staying the same (180 ppm) as global temperatures rose and fell by multiple Kelvin ~25 times between 20 and 80 thousand years ago. (See the comment below this one for a small sampling of papers referencing this.)
The contradiction is also featured in the 8.2 K event, when CO2 concentrations changed by only 1-2 ppm while global temperatures rose and fell by multiple degrees in a matter of 150 years.
Will you admit that the paleoclimate CO2 record is incompatible with this 16 ppmv/K formula?
Using the “accepted” paleoclimate CO2 concentrations from the last 80,000 years, it does follow temperature very generally and loosely, especially the lag during the glacial-interglacial transition (between 20,000 to 10,000 years ago). But after and before that, the connection doesn’t work. Something is wrong with the “accepted” CO2 values. This is pointed out by Dr. Salby in his 2012 textbook.
http://www.langtoninfo.com/web_content/9780521767187_frontmatter.pdf
“The resemblance between observed changes of CO2 and those anticipated from increased surface temperature also points to a major inconsistency between proxy records of previous climate. Proxy CO2 from the ice core record (Fig 1.13) indicates a sharp increase after the nineteenth century. At earlier times, proxy CO2 becomes amorphous: Nearly homogeneous on time scales shorter than millennial, the ice core record implies virtually no change of atmospheric CO2. According to the above sensitivity, it therefore implies a global-mean climate that is “static,” largely devoid of changes in GMT and CO2. Proxy temperature (Fig. 1.45), on the other hand, exhibits centennial changes of GMT during the last millennium, as large as 0.5–1.0◦ K. In counterpart reconstructions, those changes are even greater (Section 1.6.2). It is noteworthy that, unlike proxy CO2 from the ice core record, proxy temperature in Fig. 1.45 rests on a variety of independent properties. In light of the observed sensitivity, those centennial changes of GMT must be attended by significant changes of CO2 during the last millennium. They reflect a global-mean climate that is “dynamic,” wherein GMT and CO2 change on a wide range of time scales. The two proxies of previous climate are incompatible. They cannot both be correct.” pg. 254
——————————
Lohmann and Ditlevsen, 2018
https://www.clim-past.net/14/609/2018/cp-14-609-2018.pdf
“During the last glacial period, lasting from approximately 120 to 12 kya BP (thousands of years before present), a large number of abrupt large-scale climate changes have been recorded in Greenland ice cores and other Northern Hemisphere climate proxies. These so-called Dansgaard–Oeschger (DO) events (Dansgaard et al., 1993) are characterized by an abrupt warming of 10–15 K from cold conditions (stadials) to warmer conditions (interstadials) within a few decades. This is typically followed by gradual cooling, lasting centuries to thousands of years, until a more abrupt jump back to cold conditions is observed.”
—
Jensen et al., 2018
https://journals.ametsoc.org/doi/pdf/10.1175/JCLI-D-17-0802.1
“The forcing mechanisms behind the abrupt climate changes occurring repeatedly during the last ice age, the Dansgaard–Oeschger (DO) events, are still debated. The DO events were first identified in ice cores on Greenland, where the events are characterized by an abrupt warming of 10°C ± 5°C in a few decades (Johnsen et al. 1992; Dansgaard et al. 1993; North Greenland Ice Core Project members 2004). During the glacial period the climate of Greenland alternated between cold stadial and warm interstadial conditions with a period of roughly 1500 years (Grootes and Stuiver 1997). Further climate reconstructions suggested a global extent with, for example, warmer and wetter climate in Europe coinciding with interstadial conditions on Greenland. Climate reconstructions show large variations in the North Atlantic during the same time period with, for example, sea surface temperature changes of 10°C (Sánchez Goñi et al. 2008) and movements of ocean fronts (Eynaud et al. 2009; Voelker and de Abreu 2013; Rasmussen et al. 2016) occurring with the Greenland stadial–interstadial cycles.”
—
Jensen et al., 2017
https://www.clim-past-discuss.net/cp-2017-103/cp-2017-103.pdf
“The Dansgaard-Oeschger (DO) events of the last glacial are some of the most prominent climate variations known from the past. Ice cores from Greenland show multiple temperature excursions during the last glacial period as the climate over Greenland alternated between cold stadial (Greenland Stadial, GS), and warmer interstadial (Greenland Interstadial, GI) conditions with a period of roughly 1500 years (Grootes and Stuiver, 1997). Each DO-event is characterised by an initial temperature rise of 10±5 °C toward GI [Greenland Interstadial] conditions in a few decades, a more gradual cooling over the following several hundreds of years, and a relatively rapid temperature drop back to GS at the end of most of the events (Johnsen et al., 1992; Dansgaard et al., 1993; North-Greenland-Ice-Core-project members, 2004; Kindler et al., 2014). DO-events are manifested not only in Greenland, but around the world.”
—
Lynch-Stieglitz, 2017
http://www.annualreviews.org/doi/abs/10.1146/annurev-marine-010816-060415
“Abrupt changes in climate have occurred in many locations around the globe over the last glacial cycle, with pronounced temperature swings on timescales of decades or less in the North Atlantic. The global pattern of these changes suggests that they reflect variability in the Atlantic meridional overturning circulation (AMOC).”
—
Rasmussen et al., 2016
http://www.nature.com/articles/srep20535
https://www.sciencedaily.com/releases/2016/02/160219134816.htm
“Extreme climate changes in the past Ice core records show that Greenland went through 25 extreme and abrupt climate changes during the last ice age some 20,000 to 70,000 years ago. In less than 50 years the air temperatures over Greenland could increase by 10 to 15 °C. However the warm periods were short; within a few centuries the frigid temperatures of the ice age returned. That kind of climate change would have been catastrophic for us today. Ice core records from Antarctica also show climate changes in the same period, but they are more gradual, with less severe temperature swings.”
—
Hewitt et al., 2016
http://adsabs.harvard.edu/abs/2016EGUGA..18.8388H
“Many northern hemisphere climate records, particularly those from around the North Atlantic, show a series of rapid climate changes that recurred on centennial to millennial timescales throughout most of the last glacial period. These Dansgaard-Oeschger (D-O) sequences are observed most prominently in Greenland ice cores, although they have a global signature, including an out of phase Antarctic signal. They consist of warming jumps of order 10°C, occurring in typically 40 years, followed generally by a slow cooling (Greenland Interstadial, GI) lasting between a few centuries and a few millennia, and then a final rapid temperature drop into a cold Greenland Stadial (GS) that lasts for a similar period.”
—
Agosta and Compagnucci, 2016
http://link.springer.com/chapter/10.1007/978-3-319-40000-6_5
“The climate in the North Atlantic Ocean during the Marine Isotope Stage 3 (MIS 3) —roughly between 80,000 years before present (B.P.) and 20,000 years B.P., within the last glacial period—is characterized by great instability, with opposing climate transitions including at least six colder Heinrich (H) events and fourteen warmer Dansgaard–Oeschger (D-O) events. … During the D-O events, the high-latitude warming occurred abruptly (probably in decades to centuries), reaching temperatures close to interglacial conditions. Even though H and D-O events seemed to have been initiated in the North Atlantic Ocean, they had a global footprint. Global climate anomalies were consistent with a slowdown of AMOC and reduced ocean heat transport into the northern high latitudes.”
Kenneth,
“0-700 m ocean temperatures fell by -2.5 K as CO2 rose by 20 ppm”
Sorry, heat content 0-700 meter from 10,000 years ago? They still have troubles to get the right heat content even recently with several thousand ARGO floats.
Moreover, only the upper 100-200 m is the “mixed” layer which is in direct contact with the atmosphere for CO2 levels ánd temperature of the atmosphere.
Further, 6000 years ago was when humans started to settle in towns and agriculture and cattle herding got more and more important and CO2 levels started to increase instead of falling down.
In the previous interglacial there was over 5000 years lag between CO2 dropping and the temperature drop:
http://www.ferdinand-engelbeen.be/klimaat/klim_img/eemian2.gif
Where CH4 follows T changes far more direct and CO2 is far more lagged and smoothed. 5-18Oatm*5 is an indication of ice sheet volume from delta18O in N2O, don’t know the reasoning behind it, but seems a good indication for the ice sheet growth and wane, including the D.-O. events.
Anyway, take it or leave it, the very long term T-CO2 ratio is 16 ppmv/K. That is the maximum change. On shorter time intervals the ratio is smaller and even seasonally opposite:
-5 ppmv/K for seasonal changes (opposite to temperature)
+4 to +5 ppmv/K for year by year variability.
Both with a lag of a few months.
8 ppmv/K for the MWP-LIA transition, depending of which temperature reconstruction you use (Moberg: 8 ppmv/K, MBH98: 40 ppmv/K) with a lag of about 50 years.
16 ppmv/K for multi-millennial transitions with a lag of ~800 to several thouusands of years.
Mr. Ferdinand,
thanks for your answer. You also posted a link to a Whatsup blog entry. Thanks.
There John found a link to a discussion in another blog, here: http://joannenova.com.au/2015/11/the-mystery-of-a-massive-2-5gt-of-co2-that-came-and-went-could-it-be-phytoplankton/#comment-1763073
All John says to fully agree with Richard there, when he says:
“…Ferdinand, if you were correct that the sinks were overloaded then they were overloaded by the total emission (i.e. both natural and anthropogenic). The natural pulse of CO2 from “the plant source” in 1989 – 1991 provided an addition to any overloading of the sinks. But there was no such addition to the overloading because the sinks ‘mopped-up’ that addition within three years.
You are claiming the sinks are overloaded when humans emit CO2 but the sinks are not overloaded when nature increases its emission of CO2. That is self-contradictory unless you can suggest a mechanism which enables the sinks to discriminate which CO2 is emitted by human activity.”
You answer here in the same way that you did back then and it is still wrong.
Why you do not see it John does not know, but it is even more evident when you claim that 1000 ppm can go in and out of sinks naturally, but a tiny extra from humans is responsible for the rise.
The contradiction is clearly visible.
John Brown,
I had a lot of discussions in the past with Richard Courtney, who is a master in word (mis)interpretation.
OK, take the origin of the discussion, with the IPCC figures as base:
atmospheric increase = human emissions + natural sources – total sinks
In 1992 (Pinatubo):
0.4 ppmv = 2.9 ppmv + X – Y
X – Y = -2.5 ppmv
For X = 75 ppmv, Y = 77.5 ppmv
Increase with 0.4 ppmv totally caused by human emissions.
In 1998 (strong El Niño):
2.9 ppmv = 3.1 ppmv + X – Y
X – Y = -0.2 ppmv
For X = 75 ppmv, Y = 75.2 ppmv
Increase with 2.9 ppmv totally caused by human emissions.
As the increase is nearly human emissions and the 0.2 ppmv is at the border of the accuracy of the global CO2 measurements, there may be a small contribution of nature to the increase, maximum 0.2 ppmv, in that year, the only year of the 60 years of measurements.
The whole discussion with Richard was about a side effect: why in one year there is more or less uptake than in another year, but that has not the slightest influence on the fact that human emissions were fully responsible for the CO2 increase in 59 out of 60 years of the recent period and in the El Niño year a maximum of a few tenths of a ppmv may be from nature.
If the variability is in total sink capacity or in natural sources is only of academic interest, while Richard makes a world drama of it.
Why does the relative small human input overwhelm the natural variability? The reason is simple: near all natural in and out fluxes are caused by seasonal temperature changes (at about 5 ppmv/ºC) and near all CO2 variability around the 90 ppmv trend is caused by temperature variability at about 4-5 ppmv/ºC. When the temperature returns to the trend (a trend of maybe 1ºC or less since the LIA), the temperature effect is over.
Human emissions aren’t removed by temperature: even a 30% increase of CO2 over the past 60 years hardly influences the seasonal amplitude which remained about the same over the past 60 years (for 55 ppmv in and out over the seasons). Human emissions are removed by the extra pressure in the atmosphere: that reduces the ocean inputs and increases both ocean and vegetation sinks. The speed of removal is of a different order: about 5 years for the residence time, about 50 years for the removal rate.
Thus nature makes no difference between human or natural CO2, natural processes react differently on pressure changes than on temperature changes…
Mr. Ferdinand,
there is not reason to discuss with you any further. You will eventually accuse me of being a master of words.
John very proud not master of words.
John free thinking man, sees logic issue in Ferdinand posts.
Ferdinand long time say same thing, not worth discussing.
Only one thing John still not understand, you say temperature effect on CO2. But not on human CO2. How comes?
You Mr. have a good day!
“Ferdinand long time say same thing, not worth discussing.” – John Brown
I was beginning to wonder if anyone else noticed. :o)
John Brown,
Have a look at the seasonal changes in the past 60 years:
http://www.ferdinand-engelbeen.be/klimaat/klim_img/seasonal_CO2_MLO_trend.jpg
The increase of 15% of CO2 in the atmosphere (whatever the source) has near zero effect on the seasonal amplitude.
That amplitude is composed of about 30 ppmv absorbed and released by vegetation and about 25 ppmv released and absorbed by the ocean surface. Countercurrent, thus while one is absorbing, the other is releasing. In this case, vegetation wins and the net result is a seasonal amplitude of about 5 ppmv, near the same as at average 51 years ago and 19 years ago.
All what happens is that the residual increase at the end of a full cycle doubled.
But so did human emissions in the same periods too and these were twice the observed increase in both periods.
How is that possible?
Seasonal CO2 fluxes are the bulk of the CO2 fluxes between atmosphere and ocean surface/vegetation and are near entirely temperature driven. There is not a 15% increase in leaf growth with 15% more CO2 in the atmosphere or 15% more absorption by the ocean surface if it cools down in winter. Thus whatever the source of the extra CO2 in the atmosphere, that hardly influences the largest CO2 fluxes on earth.
What then influences the absorption of any extra CO2?
The extra CO2 pressure makes that the permanent CO2 sources from the deep ocean upwelling release less CO2 (as the difference in CO2 pressure between warm oceans and atmosphere decreases) and pushes more CO2 into the cold sink places near the poles (and in plant stomata).
That makes that about half human emissions are absorbed at the end of a full seasonal cycle, or about 1 and 2 ppmv only in the two periods. That is an order of magnitude less than the seasonal fluxes.
The bulk of the natural CO2 fluxes is temperature driven en hardly influenced by CO2 pressure changes.
The removal of any extra CO2 out of the atmosphere (whatever the source: humans, volcanoes,…) is pressure driven and hardly influenced by temperature changes…
Yonason,
Any comment on my “spurious correlation” article at WUWT?
@Ferdinand
You have put a lot of effort into it, but it’s still clear as mud. Sorry. Salby’s presentation was clear, concise, and made sense. I don’t see that you have unseated his approach, that it is cumulative temperature that causes [CO2] to rise, not the [CO2] that has any detectable effect on temperature.
And so what if [CO2] rises? It’s plant food, and for most of earth’s history it’s been higher with no adverse effects. Avg., temperature has never exceeded about 22 Deg C, which is what it was during the Cambrian Explosion, at which time [CO2] was also the highest it’s ever been. Life wasn’t harmed. It thrived.
Salby’s point, which he makes much more convincingly than you make the contrary, is that human additions of CO2 are insignificant. But even if he’s wrong, and humans are adding a lot more to the atmosphere than he says, who cares? It is certainly not worth destroying civilization by squandering precious resources in a futile effort to prevent it, because it isn’t a real problem.
If you can put together a coherent presentation, I would like to see/read it some time. But, as John Brown says, “Ferdinand long time say same thing…”, and I agree. Your material is rambling and repetitious. You aren’t yet ready for prime time. Please don’t ask me to read any more until you are. Thanks.
Yonason,
I think that the problem is mainly in the format here. The same objections are repeatedly asked and the same responses put again. And my short term memory which isn’t anymore what it was 20 years ago…
All I like – if you have the time – is that you read the article I wrote at WUWT about the spurious correlation between the increase in temperature and the increase of the CO2 rate of change, as that is the base of the tmeperature integration that Dr. Salby – and others – used.
And there is a step by step article that shows all the observations that support the human contribution on my website:
http://www.ferdinand-engelbeen.be/klimaat/co2_origin.html
This isn’t a fact. It’s an assumption based on assumptions.
Dr. Ed Berry pointed out your chronic tendencies to rely on assumptions in formulating your explanations in the debate he had with you in the comment section here:
https://edberry.com/blog/climate-physics/agw-hypothesis/preprint-a-fatal-flaw-in-global-warming-science/
“The problem I find with your year-by-year examples is they have no model to back them up. They merely assume the IPCC assumption is correct. But you can’t prove an assumption is correct by using the assumption in an argument.”
“your examples use the unwarranted IPCC assumption, namely, that human emissions are the primary cause of the increase in atmospheric CO2 since 1750. Before you can use that assumption, you must provide a good argument to support the assumption. My Section 2.2 proves the IPCC argument for the assumption is wrong.”
“I think all your arguments are based upon the invalid IPCC model.”
Kenneth,
That is of course not based on a model, it is based on the fact that the mass balance must be obeyed at any moment of time.
That human emissions are the cause of the increase is not an assumption, but a hard fact, as nature was a net sink in every year of the past 60 years.
If that wasn’t the case, the increase in the atmosphere should have been larger than from human emissions alone.
You can’t have different behavior for human and natural CO2…
Yes, I understand this is your belief. Atmospheric physicists like Dr. Murry Salby and Dr. Ed Berry do not agree that this is a “hard fact”.
Again, this is an assumption, not fact, as scientists have affirmed that “the current inability to accurately quantify the mean CO2 sink regionally or locally also suggests that present-day observational constraints are inadequate to support a detailed, quantitative, and mechanistic understanding of how the ocean carbon sink works” and “it is not yet possible to directly confirm from surface observations that long-term growth in the oceanic sink is occurring” and “land use change uncertainty is at least 50% of the mean flux, and uncertainty is growing for emissions from fossil fuel burning and cement manufacture” and “variability in CO2 flux is large and sufficient to prevent detection of anthropogenic trends in ocean carbon uptake on decadal timescales.”
But you go right on ahead and keep believing there is no uncertainty and that we have all the answers, enough to transform your beliefs into facts.
McKinley et al., 2017
http://www.annualreviews.org/doi/10.1146/annurev-marine-010816-060529
“That the growth of the partial pressure of CO2 gas in the atmosphere ( pCO2 atm) drives a growing oceanic sink is consistent with our basic understanding that, as the globally averaged atmosphere-to-ocean pCO2 gradient increases, carbon accumulation in the ocean will occur at an increasing rate. This behavior has been illustrated clearly with models forced with only historically observed increases in pCO2 atm and no climate variability or change (Graven et al. 2012, Ciais et al. 2013). Nonetheless, critical mysteries remain and weigh heavily on our ability to quantify relationships between the perturbed global carbon cycle and climate change.”
“The current inability to accurately quantify the mean CO2 sink regionally or locally also suggests that present-day observational constraints are inadequate to support a detailed, quantitative, and mechanistic understanding of how the ocean carbon sink works and how it is responding to intensifying climate change. This lack of mechanistic understanding implies that our ability to model (Roy et al. 2011, Ciais et al. 2013, Frolicher et al. 2015, Randerson et al. 2015), and thus to project the future ocean carbon sink, including feedbacks caused by warming and other climate change, is seriously limited.”
“First, substantial uncertainty remains on the mean sink (∼30% of the total flux). Formally, the quantitative estimate of the 1980–1989 sink (−2.0 ± 0.7 Pg C y−1) is not statistically distinguishable from that for 2000–2009 (−2.3 ± 0.7 Pg C y−1). Reducing this uncertainty is absolutely critical to global partitioning of anthropogenic carbon sources and sinks. Each year, the Global Carbon Project (http://www.globalcarbonproject.org) estimates global sources and sinks of carbon, but because the heterogeneous and sparsely measured terrestrial biosphere cannot be directly measured, its flux is estimated by difference from estimated anthropogenic sources and the ocean sink (Le Quer´ e et al. 2015). In these budgets, land use change uncertainty is at least 50% of the mean flux, and uncertainty is growing for emissions from fossil fuel burning and cement manufacture (Ciais et al. 2013). Reduction in ocean sink uncertainty could therefore help to compensate from a global budgeting perspective.”
“The sum of the available evidence indicates that variability in the ocean carbon sink is significant and is driven primarily by physical processes of upwelling, convection, and advection. Despite evidence for a growing sink when globally integrated (Khatiwala et al. 2009, 2013; Ciais et al. 2013; DeVries 2014), this variability, combined with sparse sampling, means that it is not yet possible to directly confirm from surface observations that long-term growth in the oceanic sink is occurring.”
“Globally integrated variability fluctuates with ENSO. Yet, at regional scales outside the equatorial Pacific, these modes tend to explain less than 20% of the large-scale variance in pCO2 ocean and CO2 flux (McKinley et al. 2004, 2006; Breeden & McKinley 2016), indicating that much variance remains undescribed. Consistent with the limited amount of variance explained, the mechanistic connections of these modes are not well understood, except in the equatorial Pacific with ENSO. In the North Atlantic, a variety of studies have suggested a connection of the NAO and AMO to pCO2 ocean and CO2 fluxes, but whether these changes occur through convection or advection remains an open question. In the Southern Ocean, the SAM has been linked to pCO2 ocean and CO2 fluxes through impacts on wind-driven ventilation and subduction; however, since the mid-2000s, the clear relationship to SAM has substantially weakened (Fay & McKinley 2013, Landschutzer et al. 2015). In the North Pacific, the relative influence of the PDO ¨ as opposed to ENSO requires further study. Particularly as observations in the high latitudes have become more abundant, evidence has grown that climate modes do not adequately explain carbon cycle variability and that mechanistic understanding of carbon sink variability requires substantial additional elucidation.”
“[T]his CESM-LE analysis further illustrates that variability in CO2 flux is large and sufficient to prevent detection of anthropogenic trends in ocean carbon uptake on decadal timescales.”
Kenneth,
“Atmospheric physicists like Dr. Murry Salby and Dr. Ed Berry do not agree”
Atmospheric physicists who don’t know the difference between residence time (caused by temperature sensitive processes) and excess decay rate (which needs pressure sensitive processes) need to come down from their ivory tower and may learn something from someone with more practical than theoretical experience…
“the current inability to accurately quantify the mean CO2 sink regionally or locally”.
Kenneth, there is not the slightest knowledge necessary from any individual natural source or sink to know that humans are the main cause of the CO2 increase in the atmosphere. All you need is the overall balance, which is the difference of what humans emit and what remains in the atmosphere. That shows that nature was more sink than source, every year of the past 60 years.
No matter if an individual sink or source doubled or halved over the years or that a sink turned into a source or reverse: the endresult is all what counts: more sink than source, all the rest is of academic interest only.
It is of zero interest for the mass balance that carbon cycle models are not reflecting reality or that the variability in CO2 growth is not fully explained. As long as the increase in the atmosphere is less than human emissions, the rest of the earth is a CO2 sink, wherever that may be.
“Atmospheric physicists like Dr. Murry Salby and Dr. Ed Berry do not agree”
Your hubris is off-putting, Ferdinand. I don’t regard you as any more informed than any other who formulate opinions based on assumptions about the ancient past. In fact, considering your continued heavy reliance on confirmation bias (Those high CO2 values must be contaminated! The temperatures must be wrong because the CO2 measurements are excellent! Those values are wrong because these values are reality!) and the ways you must contort the past to fit your beliefs makes your explanations far less persuasive. You’re a true believer and not the least bit skeptical.
“All you need is the overall balance,”
WRONG,
Natural CO2 release has almost certainly increased by a LARGE amount since the LIA..
.. far more than human releases of sequestered CO2.
What do you think natural warming does after a period of excessive cold like the LIA kills off so much organic matter?
Your lack of knowledge of the basic carbon cycle and how biology works, works against you, always, ferd.
Be VERY glad the atmospheric CO2 has increased from the barely sustainable levels of 250ppm.
I’m really glad that you “believe™” that humans are responsible for this highly beneficial enhancement of atmospheric CO2, because with all the coal fired power stations being constructed in Asia, and other third world countries, that enhancement will only increase.
BE HAPPY. 🙂
Kenneth and Spike55,
Good, it doesn’t make any sense to go further with this discussion.
One last word:
If a nice theory, completely explained with formula’s and quantitatively right, does violate only one observation, then it shoud be rejected.
Harde’s, Salby’s, Berry’s and Bartemus’ theories violate many observations like the mass balance, the δ13C balance and not at least the solubility of CO2 in seawater.
See: http://www.ferdinand-engelbeen.be/klimaat/co2_origin.html
During the Holocene, the accepted paleoclimate record states that CO2 rose by 25 ppm as the ocean’s temperatures dropped by -2.5 K, which is the exact opposite of what the 16 ppmv/K formula your explanation rests on says should have happened.
https://notrickszone.com/wp-content/uploads/2016/11/Holocene-CO2-and-Pacific-Ocean-Heat-Content-Rosenthal-2013.jpg
The same occurred with surface temperatures:
https://notrickszone.com/wp-content/uploads/2018/05/Holocene-Cooling-Baltic-Lake-Belle-2018.jpg
–
https://notrickszone.com/wp-content/uploads/2018/03/Holocene-Cooling-Subantarctic-South-Georgia-Fan-Lake-Oppedal-2018.jpg
–
https://notrickszone.com/wp-content/uploads/2018/05/Holocene-Cooling-Canada-Inland-BC-Lemmen-Lacourse-2018.jpg
–
https://notrickszone.com/wp-content/uploads/2018/02/Holocene-Cooling-Swiss-Alps-Badino-2018.jpg
–
https://notrickszone.com/wp-content/uploads/2018/06/Holocene-Cooling-Greenland-Baffin-Bay-McFarlin-2018.jpg
–
https://notrickszone.com/wp-content/uploads/2017/03/Holocene-Cooling-Antarctic-Stenni-17-East-West-Whole-Antarctica.jpg
–
https://notrickszone.com/wp-content/uploads/2017/06/Holocene-Cooling-China-Northeast-Zheng-2017.jpg
–
https://notrickszone.com/wp-content/uploads/2017/04/Holocene-Cooling-Svalbard-Arctic-Mangerud-Svendsen-2017.jpg
–
https://notrickszone.com/wp-content/uploads/2017/06/Holocene-Cooling-Greenland-Northwest-Lasher-2017.jpg
–
https://notrickszone.com/wp-content/uploads/2017/05/Holocene-Cooling-Qinghai-Tibetan-Plateau-Chang-2017.jpg
–
https://notrickszone.com/wp-content/uploads/2017/03/Holocene-Cooling-Macedonia-Greece-Thienemann-17.jpg
–
https://notrickszone.com/wp-content/uploads/2016/12/Holocene-Cooling-Antarctica-West-Fudge-16.jpg
–
https://notrickszone.com/wp-content/uploads/2016/12/Holocene-Cooling-Mediterranean-Ionian-Sea-2-Jalali-16.jpg
–
https://notrickszone.com/wp-content/uploads/2016/12/Holocene-Cooling-North-Atlantic-SSTs-Mark-16.jpg
–
https://notrickszone.com/wp-content/uploads/2016/12/Holocene-Cooling-Pacific-NW-Yamamoto-16.jpg
–
https://notrickszone.com/wp-content/uploads/2016/12/Holocene-Cooling-Canadian-Arctic-Fortin-16-copy.jpg
–
https://notrickszone.com/wp-content/uploads/2017/06/Holocene-Cooling-Indo-Pacific-Ocean-Heat-Kalansky-2015.jpg
–
https://notrickszone.com/wp-content/uploads/2017/03/Holocene-Cooling-Finland-Lakes-Luoto-14.jpg
–
https://notrickszone.com/wp-content/uploads/2017/03/Holocene-Cooling-Antarctica-Rella-Uchida-14.jpg
–
https://notrickszone.com/wp-content/uploads/2016/10/Holocene-Cooling-Greenland-North-Agassiz-Ice-Cap-Lecavalier13-copy.jpg
–
https://notrickszone.com/wp-content/uploads/2017/03/Holocene-Cooling-Southeast-Pacific-Shevenell-2011.jpg
–
https://notrickszone.com/wp-content/uploads/2017/03/Holocene-Cooling-North-Africa-Kim-07.jpg
So we therefore have expressed permission to reject your nice theory.
The funny things is, the mass-balance argument as expounded by Gavin Cawley is entirely consistent with the increase in CO2 being natural. It is possible for the oceans to simultaneously absorb anthropogenic CO2 and release CO2 due to warming. Consider a fizzy drink for example. Say we had a fizzy drink with an average temperature of 15°C and added 100 grams of CO2 into the head-space above the water. The CO2 would rapidly equilibrate with the water until 98 grams has been dissolved and 2 grams resided in the head-space in accordance with the 1:50 partitioning ratio at that temperature. Now imagine at the same time we increased the water-temperature by 5°C and thereupon shifted the partitioning ratio for CO2 between air and water to 1:40. Instead of 0.98 grams being dissolved into the water 97.5 grams would be dissolved, leaving 2.5 grams in the head-space. At the same time, some CO2 would be released from the water due to the temperature-change, let’s assume 10 grams. The end result is that the water has simultaneously absorbed 97.5% (essentially all) of the CO2 we added while increasing the CO2 in the head-space due to the temperature-change. This is why the mass-balance argument (as it is being inappropriately applied by warmists) is invalid.
THERE IS A BIAS
“Improper manipulation of data, and arbitrary rejection of readings that do not fit the pre-conceived idea on man-made global warming is common in many glaciological studies of greenhouse gases. ” – Zbigniew Jaworowski, M.D., Ph.D., D.Sc.
https://www.john-daly.com/zjiceco2.htm
[…] From No Tricks Zone: AGW Gatekeepers Censor The CO2-Climate Debate By Refusing To Publish Author’s Response To Criticis… […]
Gavin Schmidt is not known for either his veracity or tact.
https://climateaudit.org/2009/01/20/realclimate-and-disinformation-on-uhi/
But, in his favor, he does have an excuse. He’s an ignoramus (that or a liar, so I’m giving him the benefit of the doubt here).
https://climatechangedispatch.com/special-report/3/?amp
No, I guess that doesn’t really help, actually. I mean, you may be able to explain misinformation by incompetence, but that doesn’t make it true. Here’s more proof that Real Climate blog is a source of misinformation.
https://pielkeclimatesci.wordpress.com/2009/06/30/real-climates-misinformation/
I’ve posted on them before.
“Real Climate” is a staged and contracted production, which wasn’t created by “scientists”, it was actually created by Environmental Media Services, a company which specializes in spreading environmental junk science on behalf of numerous clients who stand to financially benefit from scare tactics through environmental fear mongering.”
http://www.breadandbutterscience.com/Peden.pdf
I’ll have a bit more on “Real Climate” blog later.
Oh dear … just clicked on one of your links:
https://pielkeclimatesci.wordpress.com/2009/06/30/real-climates-misinformation/
And you believe sources like that one? 😉
That is someone who sees stable conditions or cooling everywhere. I mean 3 years or 6 years periods while ignoring the bigger picture? Of course, this being from 2009 we now can only laugh about postings like this in hind sight. But you still believe in this BS … and use it trying to smear specific persons or websites.
The irony in this is that you don’t like it when someone points out to you that your own sources a not trustworthy for several reasons. Calling it ad-hom attacks, etc …
Conditions HAVE been stable since 2001 apart from a El Nino.
Do you have any relevant point to make seb?
Or just more mindless brain-hosed bluster.
I suppose you think a world wide ocean warming of 0.08ºC is somehow “significant” ROFLMAO. You live in a warped fantasy, seb.
And its YOU that is doing the smearing and sliming, as it always is.
You have a bigger picture which resides ONLY in your manic AGW fantasies.
The irony is that you have basically NEVER linked to a trustworthy source, yet you STILL just “believe” the AGW BS, DESPITE your abject inability to produce one bit of evidence to support the scams most basic myth, CO2 warming.
The warmists at the Hadley Center see things as stable or cooling.
https://notalotofpeopleknowthat.files.wordpress.com/2014/01/image73.png
Why does SebH give them any credibility?
Oh, wait. They make “adjustments.” Funny how they always make the present warmer, and the past colder, that removes any hint of cooling or stability.
https://notalotofpeopleknowthat.wordpress.com/2015/08/05/hadcrut-cool-the-past-yet-again/
As Paul Homewood remarks there, “Some would call it fraud.” Yes. And I would be one of them.
And that’s the problem with you guys. For you a trustworthy source is a tabloid or some “software expert” turned conspiracy theorist … how can anything compete with that?
DATA seb
real DATA analysis.
Something will NEVER understand or be CAPABLE of understanding.
and there’s that word “conspiracy” again
Is it part of your cult-driven mantra, seb ???
PROVEN collusion,
PROVEN agenda, right from your high priest’s mouths. !!
You can’t even FACE FACTS about your own dubious AGW religion.
And you CERTAINLY cannot support the most basic fallacy. CO2 warming.
Q1. In what way has the climate changed in the last 40 years, that can be scientifically attributable to human CO2 ?
Q2. Do you have ANY EMPIRICAL EVIDENCE at all that humans have changed the global climate in ANYWAY WHATSOEVER?
RUN AWAY again, little headless-chook troll. !!
But, but I thought the science was settled?!
It’s at least settled that Harde and the likes are wrong. Don’t know why the skeptics community isn’t skeptic about their “findings” at all.
You have NOT given one piece of real science that backs up that point.
And you have not given one bit of evidence that the 15% or so of human CO2 in the atmosphere has cause any warming or any change in the climate.
You RUN AWAY from providing any such proof, because you KNOW that you just can’t produce any evidence.
Q1. In what way has the climate changed in the last 40 years, that can be scientifically attributable to human CO2 ?
Q2. Do you have ANY EMPIRICAL EVIDENCE at all that humans have changed the global climate in ANYWAY WHATSOEVER?
OT, WOW…Remarkable SMB gains in Greenland this year
https://notalotofpeopleknowthat.files.wordpress.com/2018/08/image_thumb42.png
Ferdinand says that the δ13C values (which are around -8.3) indicate that there is around 10% of human CO2 in the atmosphere. However a decrease in δ13C is not a unique signature of anthropogenic CO2. For example an increase in biogenic CO2 would decrease δ13C. I posted a short article counterpointing Skeptical Science here if anyone is interested in checking it out: https://chipstero7.blogspot.com/2018/09/is-co2-increase-man-made-or-natural.html
Richard,
Indeed there are two (and only two) main sources of low-13C on earth: fossil organics and recent organics. all the rest is inorganic and has a higher δ13C level.
To start with: that already excludes the oceans as main source of the CO2 increase: CO2 from the oceans is between zero and +5 per mil δ13C. With the conversion at the sea surface – atmosphere and back, that did give a level of -6.4 +/- 0.2 per mil in the atmosphere for thouaands of years as seen in ice cores and +4.95 +/- 0.2 per mil in surface seawater for coralline sponges at Bermuda over a few hundred years before the start of the decline from about 1850 on. See:
http://www.ferdinand-engelbeen.be/klimaat/klim_img/sponges.jpg
Since then, δ13C levels declines to currently about -8.3 per mil. So which caused the decline: humans or vegetation? The oxygen balance shows the source:
Burning fossil fuels uses oxygen, each fuel type with a different ratio. The biosphere produces oxygen with photosynthesis and uses oxygen when decaying or used as feed or food.
Since about 1990, the oxygen content measurements were accurate enough (better than 1:1 million) to calculate the oxygen balance. Result: the biosphere is more sink than source. It produces more oxygen than it uses, thus it absorbs more CO2 than it releases. As it preferentially absorbs 12CO2, it leaves relative more 13CO2 in the atmosphere, that should increase the δ13C level, while there is a firm decrease. The biosphere therefore is not the cause of the δ13C decline. See:
http://www.bowdoin.edu/~mbattle/papers_posters_and_talks/BenderGBC2005.pdf
That the biosphere is a net sink for CO2 is independently confirmed by satellites looking for chlorophyll: the earth is greening…