An accumulating collection of “headlines” taken from the 2018 scientific literature is indicating the Arctic region is no longer experiencing accelerated mass ice sheet/glacier loss, warming, or sea ice declines.
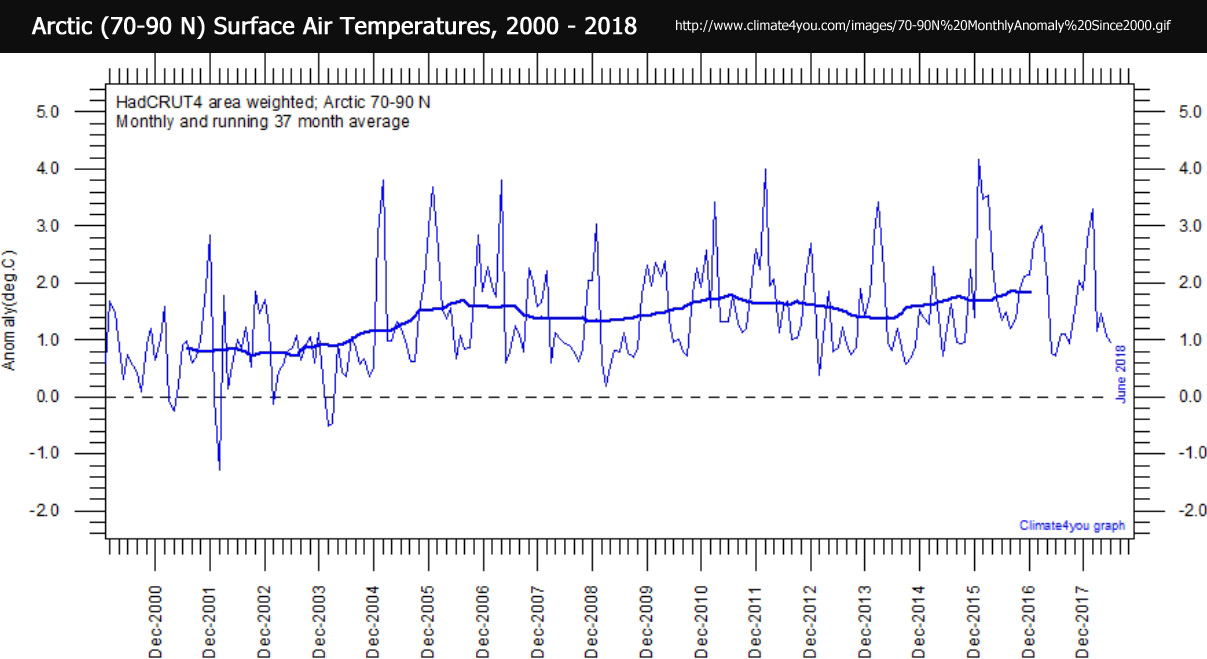
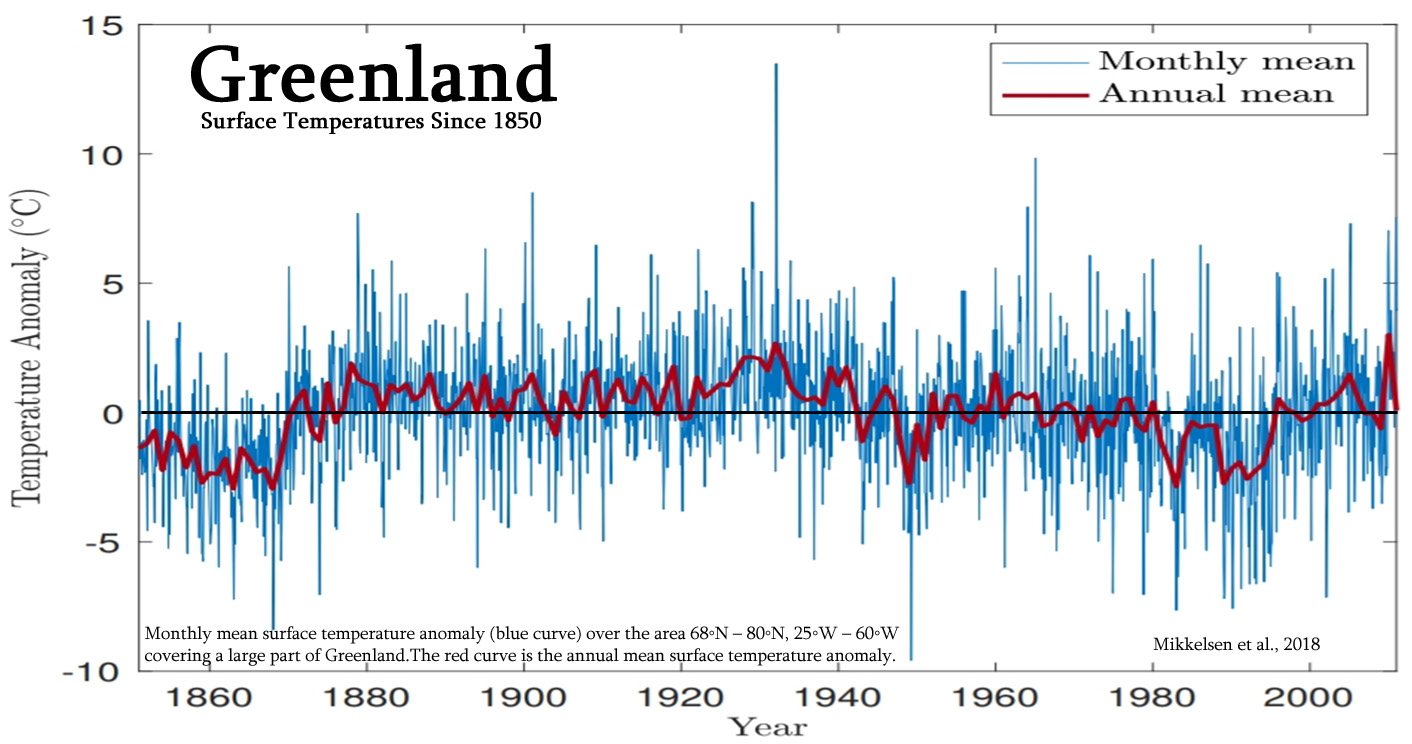
Image Source: Climate4you
I. Ice Sheet/Glacier Mass Loss Decelerating, Stabilizing
• “Notable Absence” Of Recent Acceleration In Ice Sheet Loss
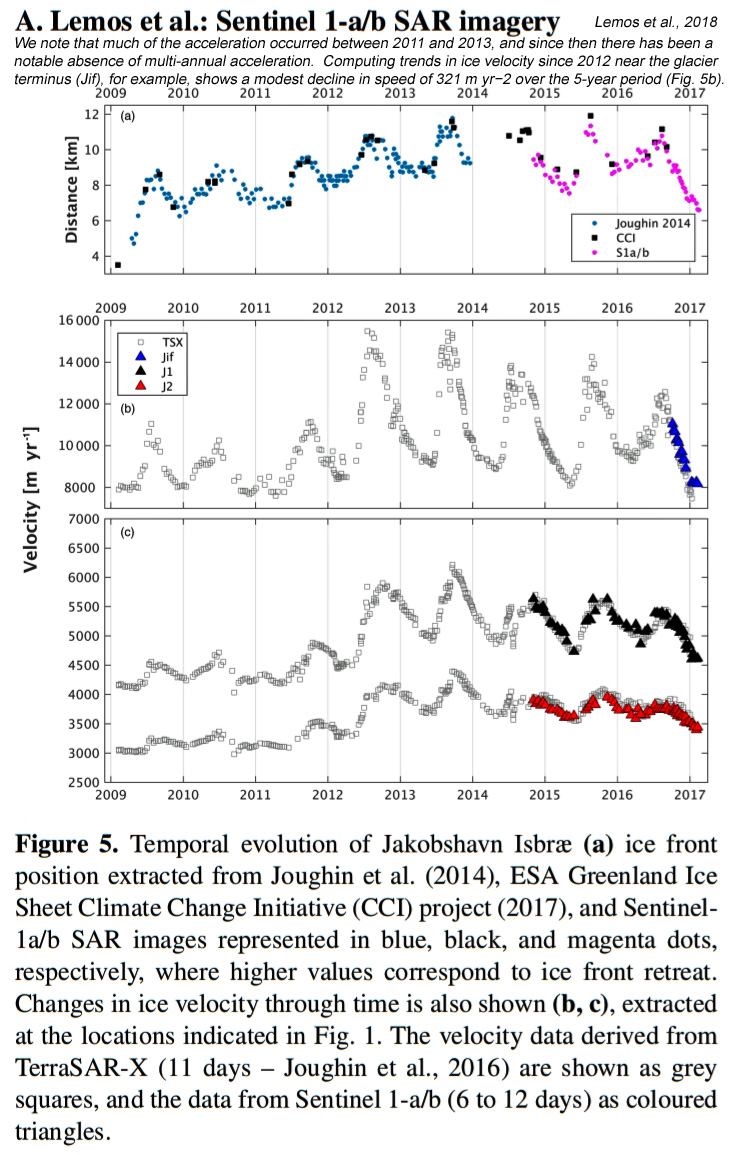
“We have presented a new, high temporal resolution record of ice velocity evolution for four important, high discharge marine-based glaciers in Greenland, updated to the present day (October 2014 to February 2017). … At J1 […], the average seasonal variability in ice speed was 400 m yr−1 during 2009–2011, increasing by more than a factor of 3, to 1400 m yr−1 between 2012 and 2013 and then diminishing to 750 m yr−1 between 2015 and 2017.”
“Turning to the longer term evolution of JI (Fig. 5; time series location shown in Fig. 1), fitting a linear trend to the data suggests an annual acceleration since 2009 of ∼ 218 m yr−1 at Jif, diminishing inland to ∼ 128 m yr−2 at J1, and ∼ 102 m yr−2 at J2. Although this provides a simple characterization of the longer-term evolution in ice speed, it is clear from our time series that computing a linear trend does not capture the full decadal-scale variability in ice velocity. In particular, we note that much of the acceleration occurred between 2011 and 2013 (Fig. 5b and c), and since then there has been a notable absence of multi-annual acceleration as earlier records suggest (Joughin et al., 2014). Computing trends in ice velocity since 2012 near the glacier terminus (Jif), for example, shows a modest decline in speed of 321 m yr−2 over the 5-year period (Fig. 5b).”
“The calving front position migration has been suggested as the trigger to the stresses regimes variations and consequently the main driver to the JI velocity fluctuations (Joughin et al., 2008a, b, 2012, 2014; Bondzio et al., 2017). After a successive and gradually increased rate of ice front retreat until 2012 (Fig. 5a), the JI grounding line is now located on a higher bed location (Joughin et al., 2012; An et al., 2017). This may be acting to stabilize the grounding line, and in turn contribute to the glacier deceleration, although the main cause remains to be determined and further investigations is necessary.”
• Glaciers “Stable…Since 2001” – More Mass Lost Before 1949
“A Century of Stability of Avannarleq and Kujalleq Glaciers, West Greenland … We digitize the summer ice front positions using aerial photos from 1964 (Carbonnell & Bauer, 1968) and Landsat imagery spanning 1976 to 2017. AVA did not retreat at a significant level (150–200 m) during the entire time period (Figure 1). KUJ advanced and retreated over a region about 2.5 km wide. At midrange in the 1960s to 1970s, the ice front advanced in the 1980s, remained at an advanced position in the 1990s, and retreated by 1.5 km from 1997 to 2001. The ice front of KUJ has remained stable within ±300 m since 2001. On the longer term, AVA has not migrated more than 100 m since 1903, while KUJ retreated by 2 km in 1851–1949, followed by stable conditions in 1949–1961, and a readvance of 700 m in 1961–1964 (Weidick, 1968).”
“High-resolution airborne gravity acquired at a low aircraft speed, with low ground clearance, combined with novel multibeam echo sounding data of the fjord helps resolve the bed topography and ice thickness of major outlet glaciers flowing into the ice-chocked Torssukatak Fjord in central West Greenland. The results explain the exceptional stability of two large glaciers over the last 1.5 century, despite the presence of warmer ocean waters in the fjord since the mid-1990s, because the glaciers are protected from the ocean by sills at the end of deep (700 m) fjords. The retreat of these glaciers from the deep fjords to the sills precedes year 1851.”
• Glacier “Currently Advancing…Stable/Advancing Since 1950”
“In this study, we reconstruct the timing and pattern of middle- and late-Holocene GrIS [Greenland Ice Sheet] margin fluctuations at two locations, ~190 km apart, in central West Greenland using radiocarbon-dated sediment cores from proglacial-threshold lakes. Our results demonstrate that deglaciation occurs at both sites during the early Holocene, with the ice sheet remaining in a smaller-than-present ice margin configuration until ~500 years ago when it readvanced into lake catchments at both sites.”
“Historical and remote-sensing records indicate that Nordenskiöld Gletscher has been stable or advancing since AD 1950 (Weidick, 1968, 1994). This evidence, in addition to the lack of a moraine or trimline marking the culmination of the late-Holocene advance fronting the ice margin, as occurs across much of the region, infers that the system is at or is still advancing to its late Holocene maximum extent.”
“We note the difference between the ice margin locations on the laterals versus the terminus relative to the late-Holocene maximum position and attribute this to deepening of the glacial trough as described by Kaplan et al. (2009). In fact, observations at the terminus of Nordenskiöld Gletscher in 2013 documented that the terminus is currently advancing onto living tundra.”
• “Slight Deceleration” Of Ice Flow Velocity During 1968-2014
“Glaciers and ice streams drain the ice from the ice sheets to the ice shelves, and contribute to global sea-level changes. Therefore, ice velocity is an essential parameter for the assessment of mass balance. … The results show that the estimated velocity obtained by the use of the proposed method is superior to the other methods, and the long-term series of ice velocity measurements shows that the ice velocity in the Amery Ice Shelf has hardly changed over the past 45 years (1968–2014). We conclude that the ice flow velocity of the Amery Ice Shelf has showed a slight deceleration over the past 45 years.”
II. Warming Trend Paused/Reversed To Cooling
• Warming Hiatus Since 2005 At An Arctic-Representative Site
“[W]e find that there was a warming hiatus/slowdown since 2005 at Ny-Ålesund. Additionally, the variation of air temperature lags by 8–9 years, which implies that the warming hiatus probably exists in the Arctic but lags behind, globally. This phenomenon is not an isolated instance, An et al. [2017] reported that the warming rate above 4000 m of the Tibetan Plateau has been slowing since the mid-2000s. In the Antarctic Peninsula, the slowdown of the increasing temperature trend was also found after 1998/1999, however, the reason is attributed to local phenomena, such as the deepening of Amundsen Sea Low and not due to the global hiatus [Turner et al., 2016].”
“From the correlation analysis, we found Ny-Ålesund could represent most Arctic areas, especially the Atlantic-Arctic sector.”
“Especially air temperature, the record of Ny-Ålesund can capture the variation of surface temperature over most of [the] Arctic.”
“The oscillations of atmospheric dynamic systems, the methods of energy transport from low to high latitudes, and feedback mechanisms of the Arctic on climate change may contribute to the warming hiatus.”
“[C]limate changes in polar areas remain difficult to predict, which indicates that the underlying mechanisms of polar amplification remain uncertain and debatable.”
• “Marked Cooling” Since 2000
“The authors examined the variability of activity of modern glaciation and variation of natural conditions of the periglacial zone on climate and on dendrochronological data. Results of larch and Siberian stone pine growth data were revealed at the higher border of forest communities. It is believed that the temperature could be 3.5 °C warmer at the Holocene optimum than at the present time(Vaganov and Shiyatov 2005).”
“Since 2000, there has been growth of trees instability associated with a decrease in average monthly summer temperatures. … Since the beginning of 2000, decrease in summer temperatures was marked.”
• “A Cooling Is Observed During The Last 15 Years”
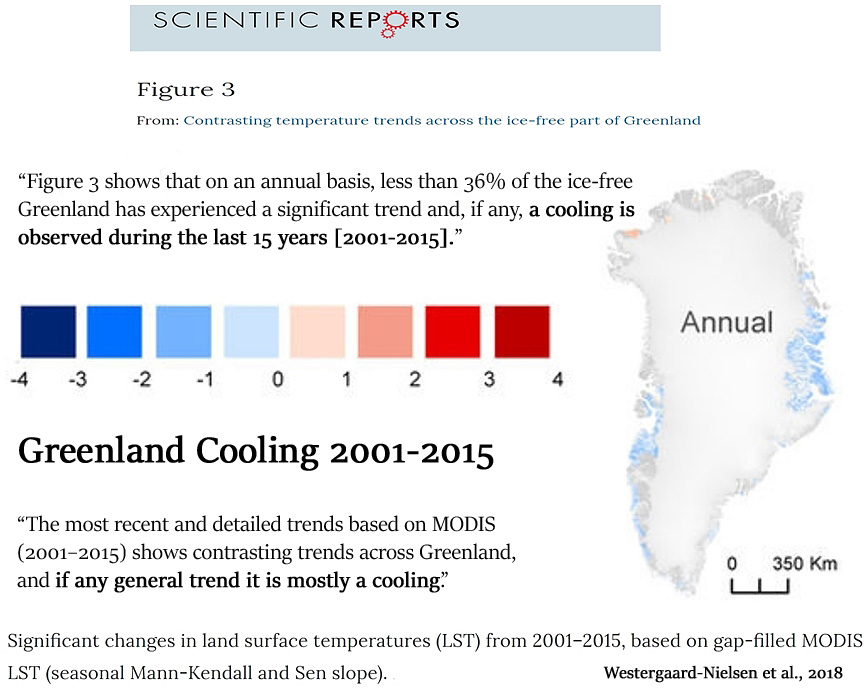
Westergaard-Nielsen et al., 2018
“Here we quantify trends in satellite-derived land surface temperatures and modelled air temperatures, validated against observations, across the entire ice-free Greenland. … Warming trends observed from 1986–2016 across the ice-free Greenland is mainly related to warming in the 1990’s. The most recent and detailed trends based on MODIS (2001–2015) shows contrasting trends across Greenland, and if any general trend it is mostly a cooling. The MODIS dataset provides a unique detailed picture of spatiotemporally distributed changes during the last 15 years.”
“Figure 3 shows that on an annual basis, less than 36% of the ice-free Greenland has experienced a significant trend and, if any, a cooling is observed during the last 15 years (<0.15 °C change per year).”
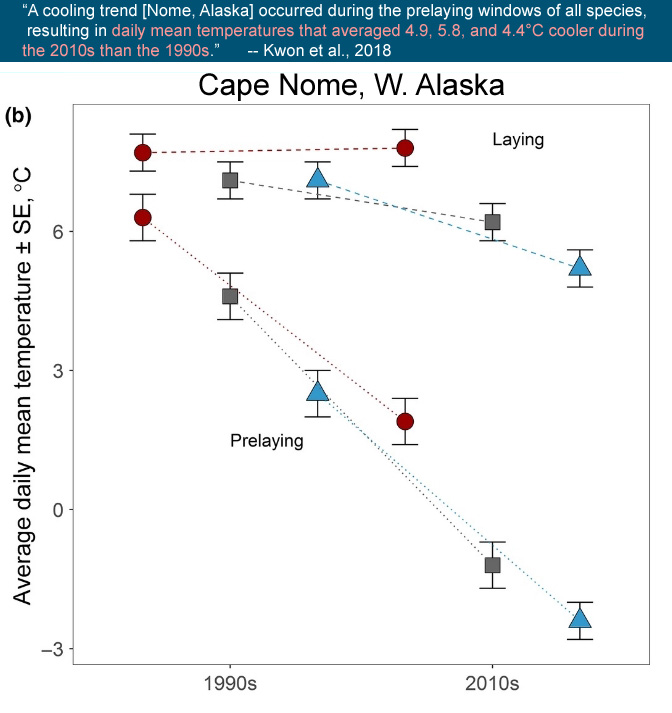
• Temps “4.9, 5.8, and 4.4°C Cooler” During 2010s Than 1990s
“We monitored 1,378 nests of western sandpipers, semipalmated sandpipers, and red‐necked phalaropes at a subarctic site during 1993–1996 and 2010–2014. … We found an unexpected long‐term cooling trend during the early part of the breeding season. Three species delayed clutch initiation by 5 days in the 2010s relative to the 1990s.”
“A cooling trend occurred during the prelaying windows of all species, resulting in daily mean temperatures that averaged 4.9, 5.8, and 4.4°C cooler during the 2010s than the 1990s for western sandpiper, semipalmated sandpiper, and red‐necked phalaropes, respectively.”
• Cooling During 1997-2016 Driven By The Arctic Oscillation
“The AO [Arctic Oscillation] has positive and negative phases that infuence broad weather patterns across the northern hemisphere (Thompson et al. 2000). For example, during the positive phase of the AO, atmospheric pressure over the Arctic is lower than average, which tends to result in warmer and wetter winters in northern regions as warmer air is able to move further north (Thompson et al. 2000; Aanes et al. 2002).”
“From 1988 to 1996, the summer intensity of the AO was largely in the positive phase, with a mean value of 0.207 (± 0.135 SE), and this was a period of population stability or growth for each of the three herds that we examined here. In contrast, from 1997 to 2016 the summer AO has remained largely in the negative phase [cooling], with a mean value of − 0.154 (± 0.077 SE).”
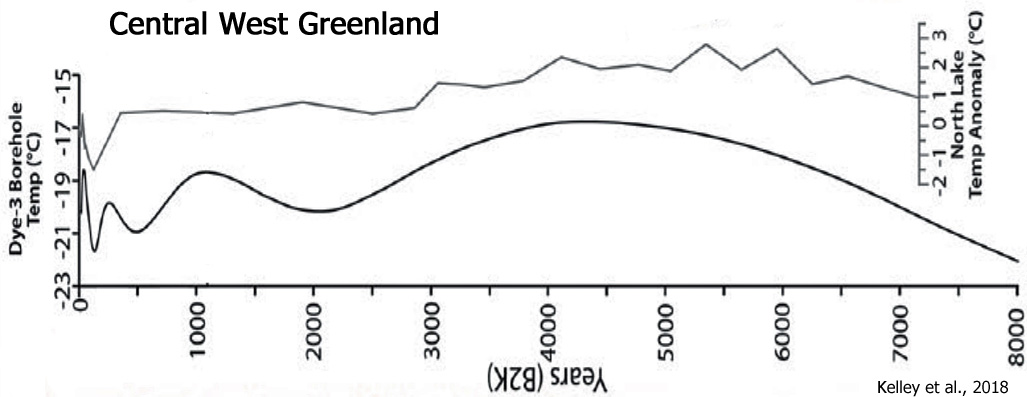
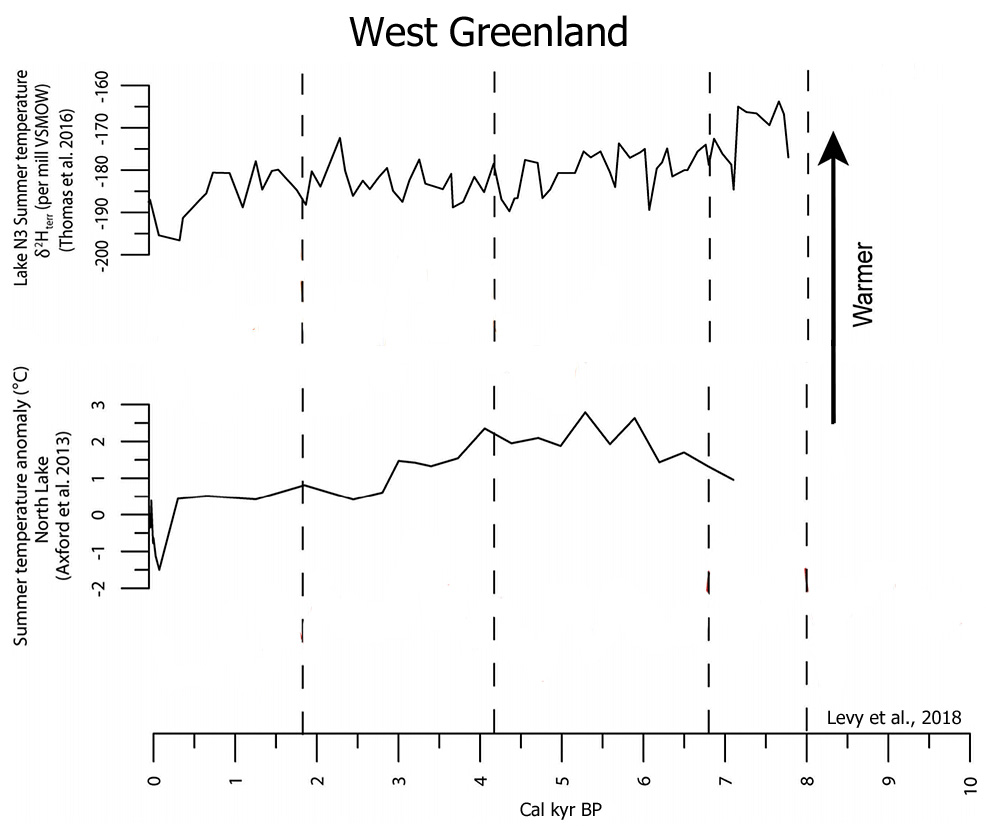
• Summer Temperature “Cooling In The Past 200 Years”
“The three historical moraine crests indicate that there were at least three ice-margin stillstands or advances during historical time. Summer temperature records from North lake (Axford et al. 2013) and Lake N3 (Thomas et al. 2016) broadly register cooling in the past 200 years in western Greenland, which likely influenced the advance to the historical moraines.”
• Surface Temperatures Show No Net Warming In 80+ Years
III. Sea Ice Loss Has Paused, Stabilized
As indicated first by Swart et al. (2015), there was “a 7-year period of near-zero trend in September Arctic sea-ice extent, as observed between 2007 and 2013”.
Extending this non-trend another 4 years, there has been no detectable trend in September Arctic sea ice during 2007-2017.
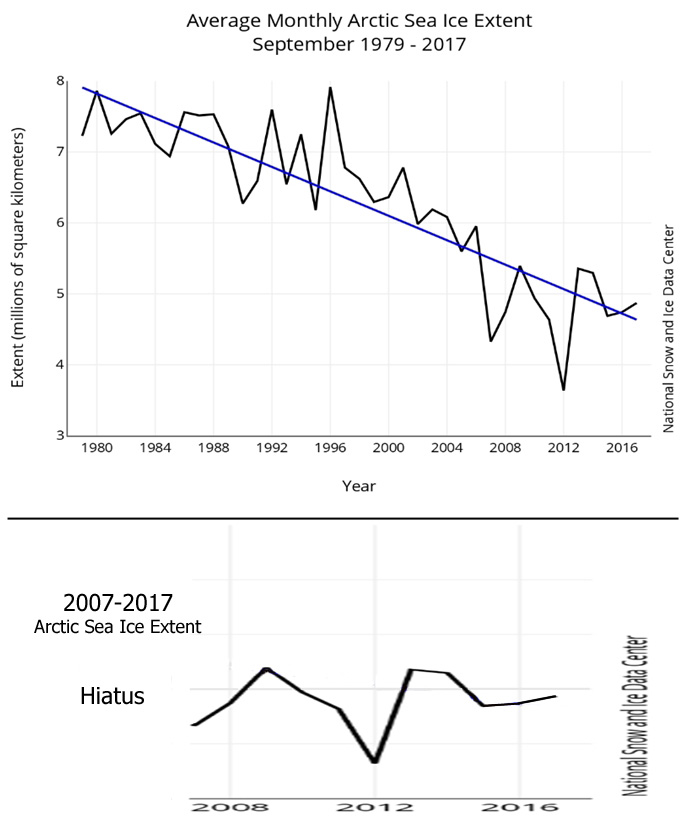
Image Source (top): NSIDC
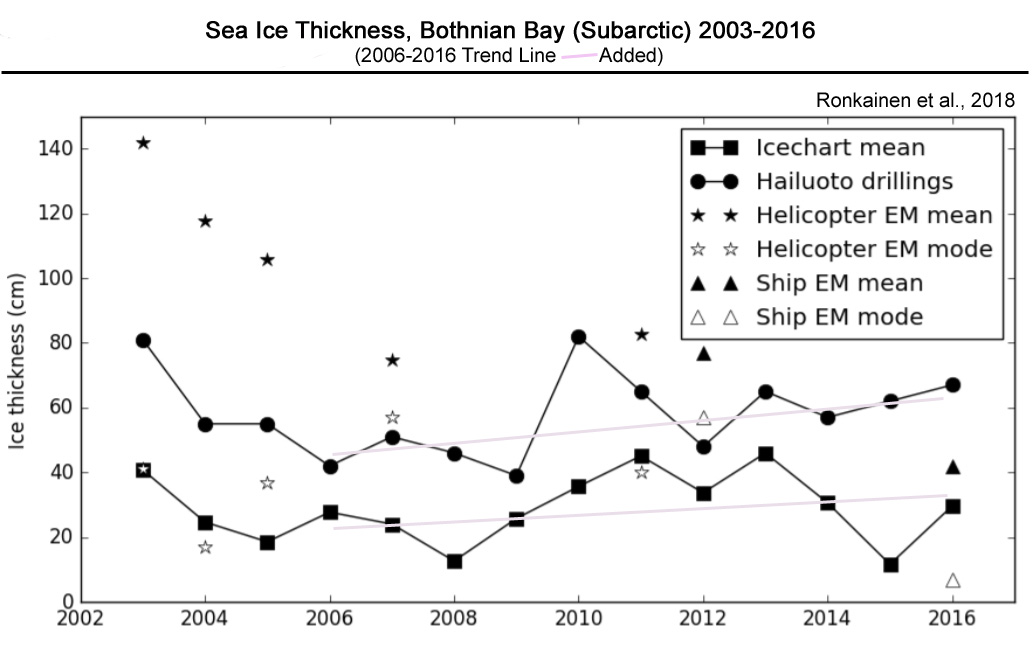
• Sea Ice Thickening During 2006-2016
“In our study, we quantify the interannual variability of sea ice thickness in the Bay of Bothnia during the years 2003-2016.”
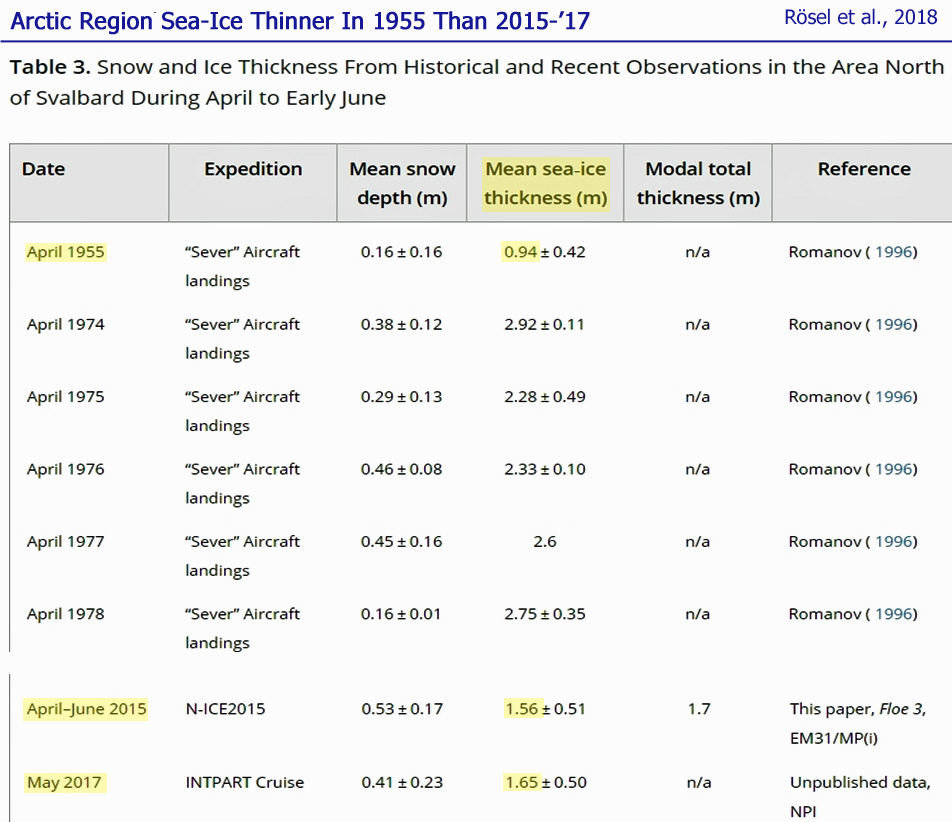
• Mean Sea-Ice Thickness Greater Today Than 1955
“We present a continuous time series of in situ measurements from the N‐ICE2015 expedition from January to June 2015 in the Arctic Basin north of Svalbard, comprising snow buoy and ice mass balance buoy data and local and regional data gained from electromagnetic induction (EM) surveys and snow probe measurements from four distinct drifts. The observed mean snow depth of 0.53 m for April to early June [2015] is 73% above the average value of 0.30 m from historical [1955, 1970s] and recent observations in this region, covering the years 1955–2017.”
“The modal total ice and snow thicknesses, of 1.6 and 1.7 m [2015] measured with ground‐based EM and airborne EM measurements in April, May, and June 2015, respectively, lie below the [1970s] values ranging from 1.8 to 2.7 m, reported in historical observations from the same region and time of year [but well above the sea-ice thickness values of 0.94 m for 1955].”
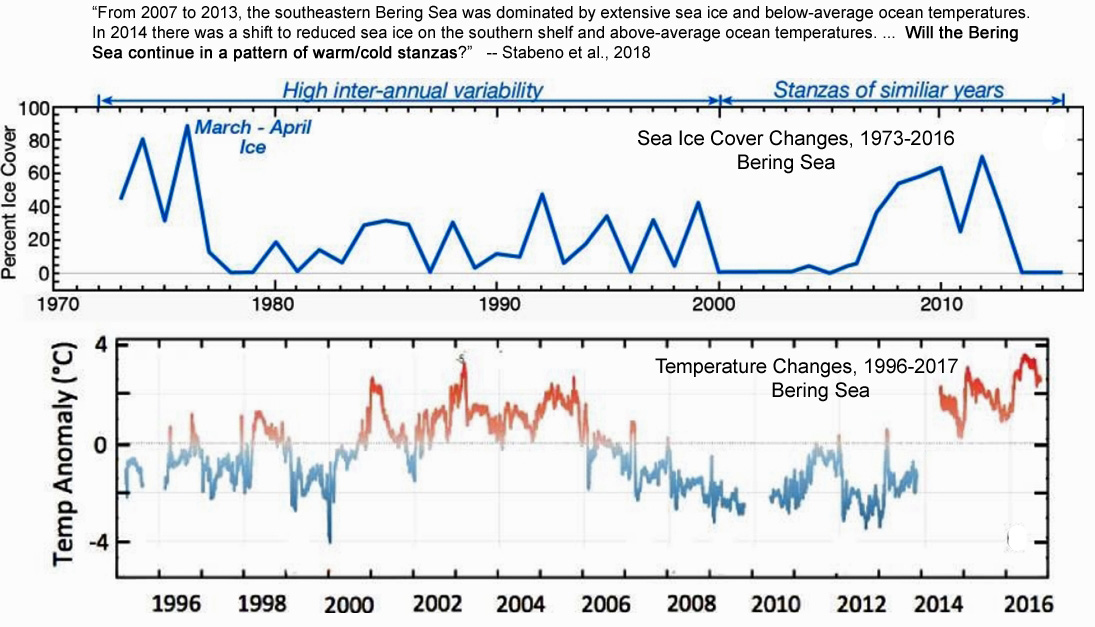
• Warm/Cold Stanzas – 2007-2013 “Extensive Sea Ice”
“From 2007 to 2013, the southeastern Bering Sea was dominated by extensive sea ice and below-average ocean temperatures. In 2014 there was a shift to reduced sea ice on the southern shelf and above-average ocean temperatures. These conditions continued in 2015 and 2016. … Historically, the dominant parameters controlling sea-ice extent are winds and air temperature, with the persistence of frigid, northerly winds in winter and spring resulting in extensive ice. After mid-March 2014 and 2016 there were no cold northerly or northeasterly winds. Cold northerly winds persisted into mid-April in 2015, but did not result in extensive sea ice south of 58°N. The apparent mechanism that helped limit ice on the southeastern shelf was the strong advection of warm water from the Gulf of Alaska through Unimak Pass. This pattern has been uncommon, occurring in only one other year (2003) in a 37-year record of estimated transport through Unimak Pass.”
“During years with no sea ice on the southern shelf (e.g. 2001–2005, 2014–2016), the depth-averaged temperature there was correlated to the previous summers ocean temperature. … This latest string of three warm years apparently ended this year (2017). In March, sea ice had covered M4, and the ice edge was near or at M2 on 13 March 2017, but by June 2017 the depth-averaged temperatures at M2 were average, indicating that ocean temperature near M2 in 2017 (like the 2006 transition between the previous warm and cold stanzas) will likely be average. With this end of a warm stanza, questions arise. Will the Bering Sea continue in a pattern of warm/cold stanzas?”


Impressive set of research papers all pointing to the current plateau in Arctic sea ice. I can add a simple graph showing MASIE and SII are showing August consistent with this assessment.
https://rclutz.files.wordpress.com/2018/08/arctic-ice-august07to18final.png
https://rclutz.wordpress.com/2018/08/31/august-arctic-ice-results/
But, but “The Guardian”, the BBC and Professor Wadhams all told us that the ice was melting and would be gone by 2012/2013/2015/whatever?
And the science was “settled”?
I’m all confused.
Surely these papers must have been written by Deniers, paid for by fossil-fuel, big businesses?
Surely?
Dont act a troll! 🙂
But it’s such good fun😁
John knows. John knows not everyone will tell the difference.
John thinks its better than insignificant woeful.
I think this comment is tongue-in-cheek…
Yup!
Does this mean I can’t feed you now? )-;
Thats “acting” for Ya!
Impressive paper tells us the heat content in the Arctic dramatically doubled and is enough to melt 0.8m thick ice in the Arctic and tremendously change the winter behaviour of the sea ice further in the coming times. (did I use enough “strong” words to conway to gravity of this paper’s result?)
“Warming of the interior Arctic Ocean linked to sea ice losses at the basin margins” – Mary-Louise Timmermans et al.
http://advances.sciencemag.org/content/4/8/eaat6773
Have fun
From Seb’s paper: “These observations were assimilated in a numerical modeling study spanning 1992–2015”.
As usual it is models all the way down!
Everything is models … if you think you can measure temperature without a model, you are mistaken. This pseudoskeptic aversion to the word “model” needs to stop. It’s getting ridiculous …
So the thermometers used for the Central England Temperature record during the 1700s was not actually producing anything directly measurable? So what are those temperature records, then?
Kenneth, how does a thermometer (old and new) measure temperature? Answer this for yourself and you’ll be one step closer to answering your question.
Poor seb doesn’t understand how thermometers work.
Doesn’t understand scientific measurements (probably why he can never produce any supporting CO2 warming.)
Thinks thermometers are similar to a fabricated ASSumption/agenda driven climate computer model.
Models that are ASSumption driven garbage, and HAVE NOT BEEN VALIDATED against reality.
They are pointless, worthless and meaningless..
.. just like a seb post.
SebH comment???
Models one thing, measurement other thing.
Models useless if you do not measure and calibrate.
Measurements fine, still measurements, no need models.
It’s what you put into the “model” that matters. Miss out an essential item in a model and you have rubbish.
How do you know all the essential items are included?
This AGW collaborator WORSHIP of non-validated, worthless nonsense models HAS TO STOP. !!
Seb needs to comprehend the difference between constantly VALIDATED engineering models, and “magic-fairy-dust” AGW fantasy models that are based on UNPROVEN ANTI-SCIENCE ASSumptions.
Good point but DNCWTRT.
“the heat content in the Arctic dramatically doubled “
What an incredibly ANTI-SCIENCE statement.
What is the “ZERO heat content” point, so that the word “doubled” can be used.?
Especially as we know the heat content change of the oceans in the last 60 or so years is barely a tiny squiggle compared to the heat loss during the Neoglaciation period.
https://s19.postimg.cc/w9lqm2nc3/OHC_in_perspective_2.jpg
Anyway, its just more crystal balls gazing.
HILARIOUS !!!
Great for a LAUGH, seb.
Is this a serious question, spike55? Just read the damn paper instead of flat out accusing scientists of “ANTI-SCIENCE” because you don’t agree. If you are so appalled by anti-science then please try to explain Yonason how integrating temperature would work in a non-anti-science way 😉
Poor seb, no answer as usual.
When was the Arctic “heat content” zero?
Simple question.
Why do you ALWAYS have so much trouble answering simple questions?
You seem to have an inbuilt IGNORANCE that you can’t find your way passed.
You KNOW it is scientific NONSENSE.. but you just gullibly choose to accept such anti-science idiocy.
The truth is that the heat content increase in the oceans in the last 60 years is but a TINY FRACTION of the heat LOSS during the “neoglaciation”
https://s19.postimg.cc/l7ypganoz/OHC_in_perspective.png
But then, a temperature change of only 0.08C is TINY.
Poor seb, doesn’t understand the concept of “integrating temperature”
Doesn’t understand it is an accumulation of energy
Seb has GREAT DIFFICULT with understanding basic scientific and mathematical concepts, that is why he constantly fantasies meaningless analogies and other climate BS.
And since they are talking about Chukchi, let’s have a look at longer term sea ice in that region.
https://s19.postimg.cc/a2p8qx7oz/Arctic-_Sea-_Ice-_Changes-_Chukchi-_Sea-_Yamamoto-2017.jpg
Notice anything, like maybe the current level of sea ice is FAR HIGHER than form most of the last 10,000 years?
Seems these modellers have DENIED climate history, like they MUST if they want to maintain their childish scare campaigns.
@spike55
SebH (to you): “…please try to explain Yonason how integrating temperature would work in a non-anti-science way “
I’ll tell you what, spike, I’ll either let you yourself explain it scientifically, I’ll help you, or I’ll do it myself – BUT ONLY ON ONE CONDITION… that SebH answer the questions that YOU have been asking HIM, and that he do it to your complete satisfaction.
Failing that, …feh!
Climate Science (TM) needs a “Dow Jones Average” of Global Mean Surface Temperature (TM) in order to regain some semblance of credibility, IMHO.
Why should this be so difficult?
Could some warmists/activists attempt a stab?
You mean what pseudoskeptics think the temperature should be or should have been deserves to be somewhat equally weighted against the actual temperature record in one great temperature index?
Come on! That’s like allowing those 1+1=3 kids to nudge the actual result from 2 to 2.x … how does that help? Promotting nutty people’s opinion as equal to actual science doesn’t help anyone.
“Promotting nutty people’s opinion as equal to actual science doesn’t help anyone.”
SO don’t keep doing it seb
Provide ACTUAL REAL EVIDENCE instead of your arrogant self-opinionated garbage and BS.
The ONLY people “adjusting” temperature to suit a meme/agenda/whim, are the AGW cultists.
What they produce with their fabrication, infilling and data-torture bears basically ZERO resemblance to the “Actual temperature record”
Poor seb still thinks 1+1=3..
Keep trying, seb, eventually you might crack a primary school pass in mathematics.