The year 2018 could mark the beginning of the end of climate change alarmist reporting. Projections of catastrophic melting of the ice sheets and sea level rise swallowing up the Earth’s coasts are increasingly undermined by observations.
Extensive glacier and ice sheet melt resulting in an accelerated sea level rise threatening the world’s population centers living along the coasts is indeed the most legitimate threat posed by a global-scale warming trend.
Alarming sea level rise predictions abound. Several meters of sea level rise due to catastrophic melting of the Greenland and Antarctic ice sheets have been predicted based on anthropogenic CO2 emissions scenarios.
For example, claims that we shall experience 260 centimeters (2.6 meters) of global sea level rise by 2100 unless we dramatically curtail our fossil fuel consumption have been published by authors like Dr. Michael Mann and Dr. Richard Alley (Garner et al. 2017). These same authors even suggest seas will rise by 17.5 meters in the next 180 years (Mörner et al., 2018).
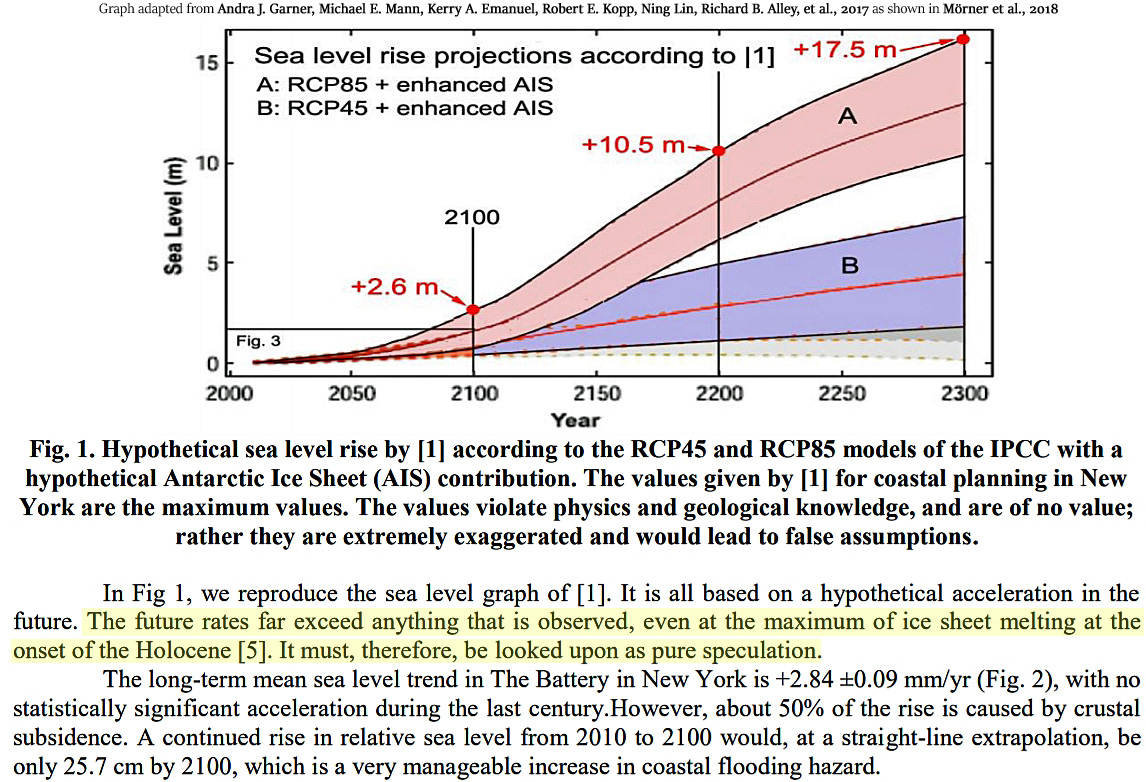
Image Source: Mörner et al., 2018
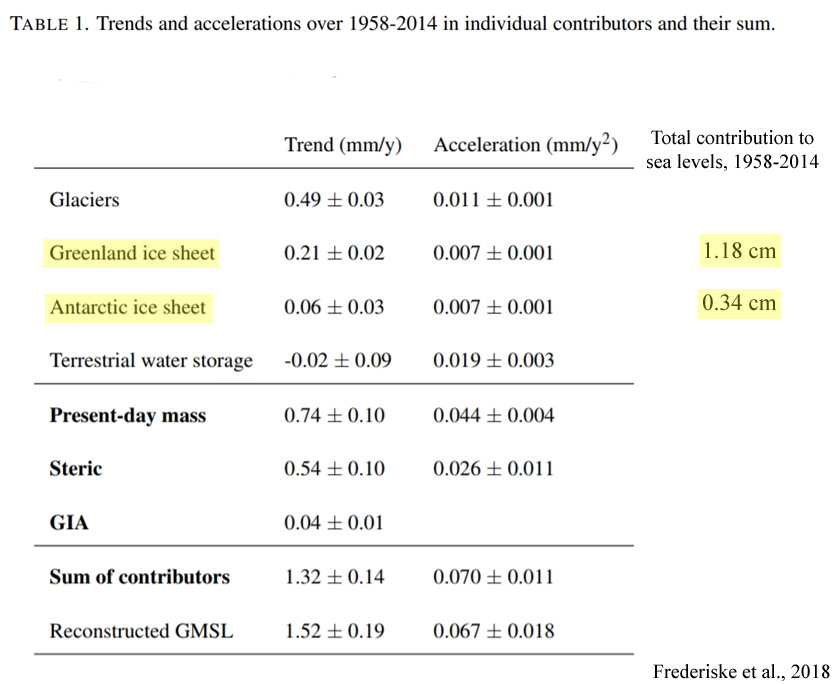
Despite the hackneyed practice of reporting “staggering” ice sheet melt for both Greenland and Antarctica in recent decades, the two polar ice sheets combined to add just 1.5 centimeters to sea level rise between 1958 and 2014 (graph from Frederikse et al., 2018) as global sea levels only rose by “1.5 ± 0.2 mm yr−1 over 1958–2014 (1σ)” or “1.3 ± 0.1 mm yr−1 for the sum of contributors”.
That’s about 7.8 centimeters (3.1 inches) of global sea level change in 56 years.
Even more significantly, satellite observations all across the globe show that the coasts of islands and sandy beaches and continents have not only not been shrinking for the last several decades, they’ve been stable to growing on net. Along the world’s coasts, there is today more land area above sea level than there was in the mid-1980s (Donchyts et al., 2016), leaving scientists “surprised”.
“We expected that the coast would start to retreat due to sea level rise, but the most surprising thing is that the coasts are growing all over the world,” said Dr Baart. “We’re were able to create more land than sea level rise was taking.” (BBC press release for Donchyts et al., 2016)
Dr. Nils-Axel Mörner – a world-renown sea level expert who headed the Department of Paleogeophysics & Geodynamics at Stockholm University – and 3 other co-authors have concluded that sea level rise projections of 2.6 m by 2100 and 17.5 m by 2300 are “deeply flawed” and “not rooted in facts” (Mörner et al., 2018).
What follows is a very abbreviated summary of the dozens of alarmism-quelling papers published in 2018 pertaining to ice sheet melt, sea level rise, and coastal expansion.
Mörner et al., 2018
Estimating Future Sea Level Changes, Assessing Coastal
Hazards, Avoiding Misguiding Exaggerations, and
Recommending Present Coastal Management
“Tide-gauges offer records of the relative changes in sea level. Out of a total of about 2300 stations (PSMSL), “a global set of ~300 tide gauges that serves as the backbone of the global in situ sea level network” in the Global Sea Level Observing System (GLOSS). There is no objective, straightforward solution for estimating a global mean value. The University of Colorado chose 184 global tide-gauge records. Their rate of distribution has a marked peak in the zone from ±0.0 to +2.0 mm/yr with a mean value at +1.14 mm/yr. Because the majority of stations used include a component of regional subsidence and local sediment compaction, the true mean sea level value should be <+1.14 mm/yr. … Satellite altimetry is a new and important tool, which reconstructs the entire ocean surface changes. But nowhere do the measurements agree with coastal observations. Satellite altimetry exceeds tide-gauge records by about 300%. There have even been accusations of data manipulation [Mörner, 2018].”
“Garner et al. (2017) propose SLR of up to 2.6 m by 2100, 10.5 m by 2200, and 17.5 m by 2300 (Fig. 1). These SLRs are far greater than those that occurred during catastrophic melting of immense ice sheets at the end of the Pleistocene, so the question arises, where will all the water come from to produce these very large SLRs? Melting of small, temperate, alpine glaciers wouldn’t produce anywhere near the SLRs projected by Garner et al., so the only possible sources of water are the Antarctic and Greenland ice sheets. The projections of Garner et al. of SLR of 7–8 m per century would require about seven times the end of the Pleistocene SLR when immense ice sheets were collapsing under warming of up to 20 °F in less than a century. To get these huge SLRs would require melting of an immense amount of ice from the Antarctic ice sheet. The average winter temperature in Antarctica is about –55 °F and temperatures have reached as low as 135 °F, so any significant melting of the Antarctic ice sheet would require 55° + 32° = 87 °F of warming just to get to the freezing point plus another 10 degrees or so to melt much ice. So Antarctica would have to warm up by 90–100 °F to melt enough ice to substantially raise sea level.”
“Hazard prediction is important, but the essence of science is the testing of predictions by comparison with observational facts. Without that validation, predictions are really just idle speculations. The future sea level values given by Garner et al. [2017] are deeply flawed and therefore misleading for coastal planning. They must be rejected as nonsense. Sea level research has its own well established means of recording past and present sea level changes and from those data to estimate likely sea level changes in the future. There are also physical frames to consider, some of which are absolute and must not be violated. … [T]he values given by Garner et al. [2017] violate not only physical laws but also accepted scientific knowledge of glaciology. Therefore, their values must not be considered in coastal planning. We also question the reviewing process.”
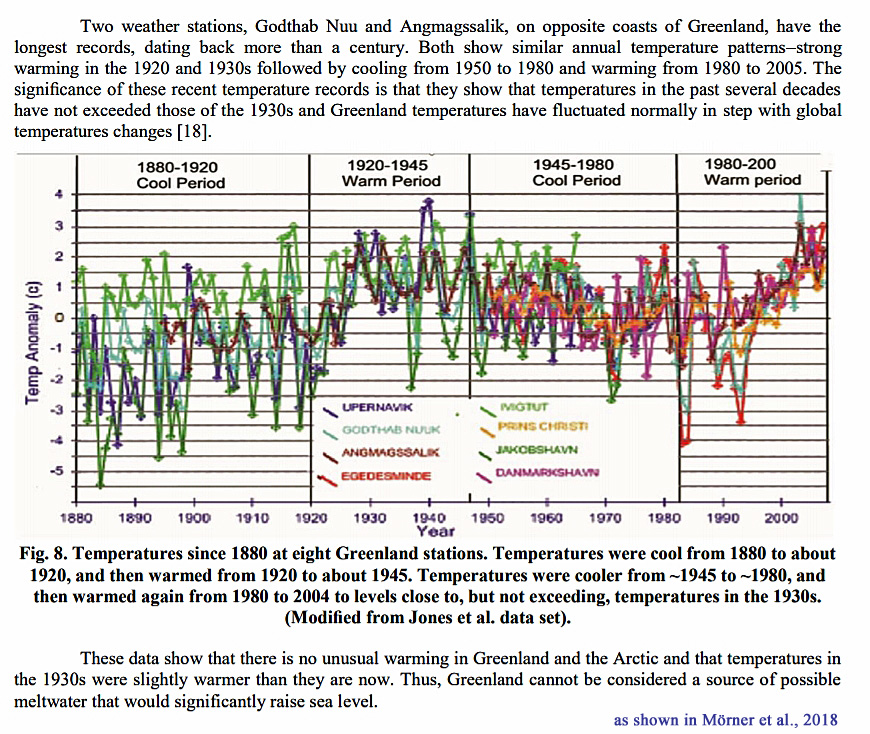
“Is Greenland warming and the ice sheet melting away? Chylek et al. [2004] analyzed temperature histories of coastal stations in southern and central Greenland having almost uninterrupted temperature records between 1950 and 2000 and found that coastal Greenland’s peak temperatures occurred between 1930 and 1940, after which subsequent decrease in temperature was so substantial and sustained that current coastal temperatures “are about 1°C below their 1940 values.” At the summit of the Greenland Ice Sheet, the summer average temperature has decreased at the rate of 2.2 °C per decade since the beginning of measurements in 1987. Two weather stations, Godthab Nuu and Angmagssalik, on opposite coasts of Greenland, have the longest records, dating back more than a century. Both show similar annual temperature patterns–strong warming in the 1920 and 1930s followed by cooling from 1950 to 1980 and warming from 1980 to 2005. The significance of these recent temperature records is that they show that temperatures in the past several decades have not exceeded those of the 1930s and Greenland temperatures have fluctuated normally in step with global temperatures changes [Easterbrook, 2016].”
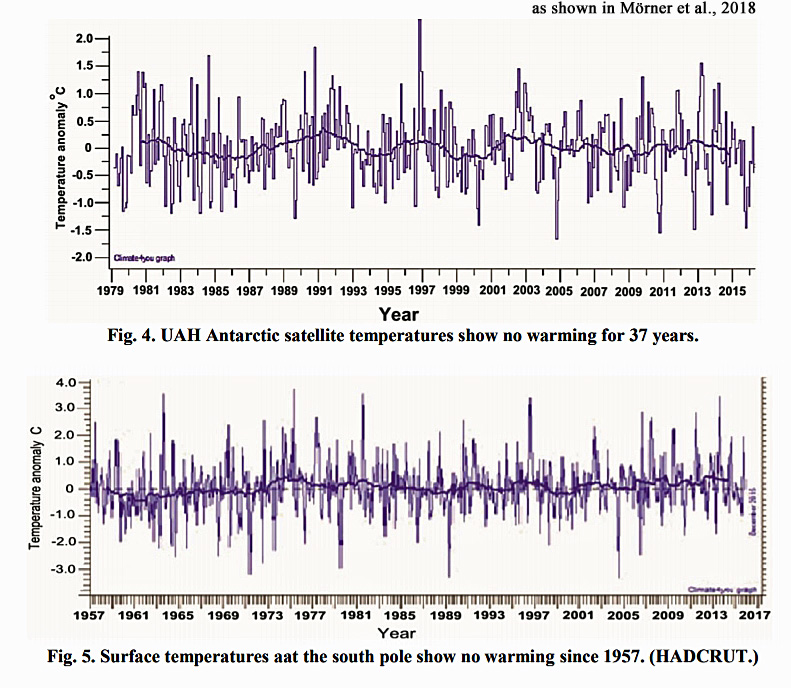
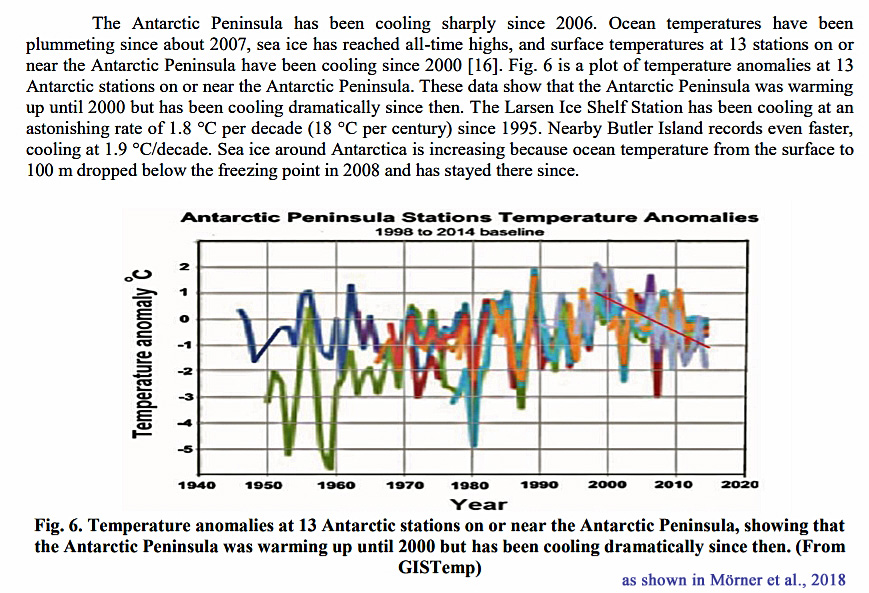
“Satellite and surface temperature records and sea surface temperatures show that both the East Antarctic Ice Sheet and the West Antarctic Ice Sheet are cooling, not warming. Satellite and surface temperature measurements show that the East Antarctic Ice Sheet is cooling, not warming, and glacial ice is increasing, not melting. Satellite and surface temperature measurements of the southern polar area show no warming over the past 37 years. Growth of the Antarctic ice sheets means sea level rise is not being caused by melting of polar ice and, in fact, is slightly lowering the rate of rise. Satellite Antarctic temperature records show 0.02 °C/decade cooling since 1979. The Southern Ocean around Antarctica has been getting sharply colder since 2006. Antarctic sea ice is increasing, reaching all-time highs. Surface temperatures at 13 stations show the Antarctic Peninsula has been sharply cooling since 2000. This indicates that the hypothetical “enhanced Antarctic Ice Sheet contribution” of Garner et al. [2017] is a serious mistake (Fig. 1) not anchored in facts.”
2. Ice melt from Greenland, Antarctica added just 1.5 cm to sea levels since 1958
“For the first time, it is shown that for most basins the reconstructed sea level trend and acceleration can be explained by the sum of contributors, as well as a large part of the decadal variability. The global-mean sea level reconstruction shows a trend of 1.5 ± 0.2 mm yr−1 over 1958–2014 (1σ), compared to 1.3 ± 0.1 mm yr−1for the sum of contributors.” (Frederikse et al.,2018)

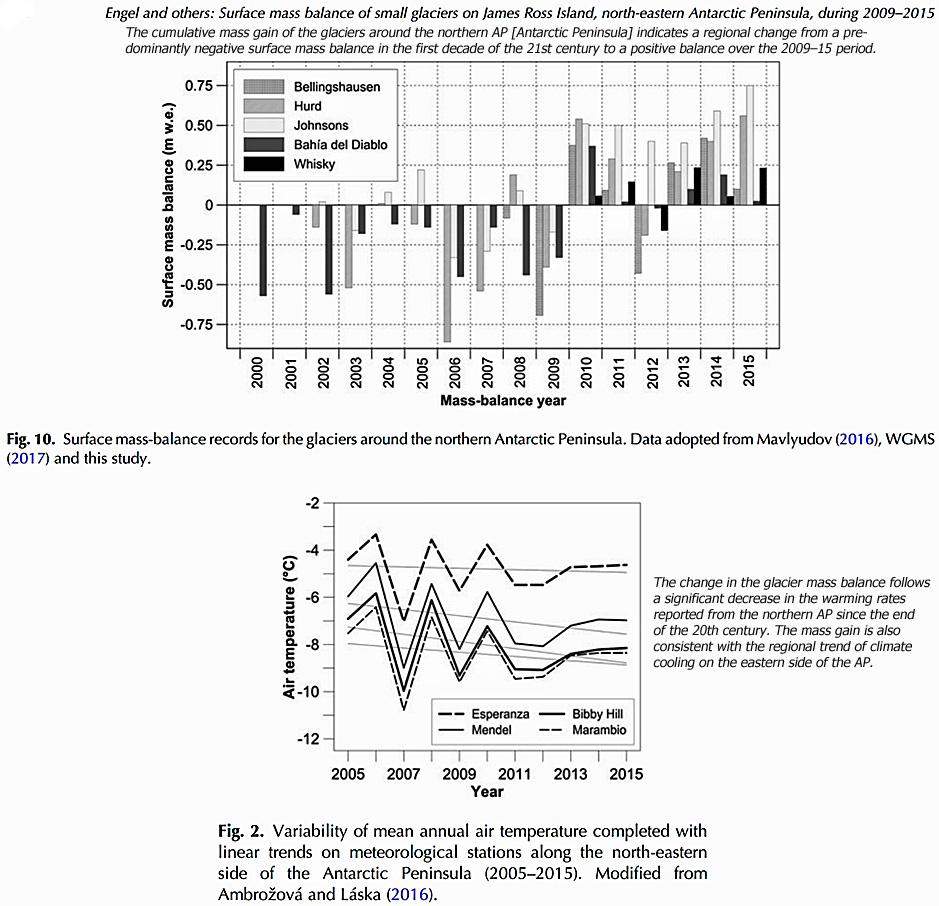
3. Ice mass gains in the rapidly-cooling Antarctic Peninsula since 2009
“Two small glaciers on James Ross Island, the north-eastern Antarctic Peninsula, experienced surface mass gain between 2009 and 2015 as revealed by field measurements. A positive cumulative surface mass balance of 0.57 ± 0.67 and 0.11 ± 0.37 m w.e. was observed during the 2009–2015 period on Whisky Glacier and Davies Dome, respectively. … Ambrožová and Láska (2016) reported a significant decrease (0.03–0.15°C a−1 [-0.3 to -1.5°C per decade]) in the temperature along the AP [Antarctic Peninsula] over the 2005–15 period with the most prominent cooling at the Bibby Hill station on JRI [James Ross Island]. … The cumulative mass gain of the glaciers around the northern AP [Antarctic Peninsula] indicates a regional change from a predominantly negative surface mass balance in the first decade of the 21st century to a positive balance over the 2009–15 period. The change in the glacier mass balance follows a significant decrease in the warming rates reported from the northern AP [Antarctic Peninsula] since the end of the 20th century. The mass gain is also consistent with the regional trend of climate cooling on the eastern side of the AP [Antarctic Peninsula].” (Engel et al., 2018)
4. Collapse of Larsen C glaciers would add 0.25 to 0.42 of a cm to sea levels
“Here we apply numerical ice-sheet models of varying complexity to show that the centennial sea-level commitment of Larsen C embayment glaciers following immediate shelf collapse is low ( < 2.5 mm to 2100, < 4.2 mm to 2300) [0.25 to 0.42 of a cm added to sea levels by 2100/2300 with Larsen C collapse]. Despite its large size, Larsen C does not provide strong buttressing forces to upstream basins and its collapse does not result in large additional discharge from its tributary glaciers in any of our model scenarios. In contrast, the response of inland glaciers to a collapse of the George VI Ice Shelf may add up to 8mm to global sea levels by 2100 and 22mm by 2300 [0.8 cm to 2.2 cm] due in part to the mechanism of marine ice sheet instability. Our results demonstrate the varying and relative importance to sea level of the large Antarctic Peninsula ice shelves considered to present a risk of collapse.” (Schannwell et al., 2018)
5. East Antarctica is gaining mass – it takes “millions of years” for “even partial retreat”
“The East Antarctic ice sheet may be gaining mass in the current, warming climate. The palaeoclimate record shows, however, that it has retreated during previous episodes of prolonged warmth. … In terms of immediate sea-level rise, it is reassuring that it seems to require prolonged periods of lasting hundreds of thousands to millions of years to induce even partial retreat.” (Nature Geoscience, 2018)
6. No glacier-melt trend for Antarctica’s largest sea level rise contributor in 70 years
“Pine Island Glacier is the largest current Antarctic contributor to sea level rise. Its ice loss has substantially increased over the last 25 years through thinning, acceleration and grounding line retreat. However, the calving line positions of the stabilizing ice shelf did not show any trend within the observational record (last 70 years) until calving in 2015 led to unprecedented retreat and changed alignment of the calving front. … Despite the thinning and flow acceleration of PIG [Pine Island Glacier], and sustained, rapid thinning of the ice shelf over at least the past 25 years the position of the ice front had not shown any clear trend over 68 years of observations prior to 2015 (Bindschadler, 2002;MacGregor et al., 2012;Rignot, 2002).” (Arndt et al., 2018)
7. East Antarctica gaining mass…projections due to ice sheet melt “overestimated”
“East Antarctic Ice Sheet (EAIS) mass balance is largely driven by snowfall. Recently, increased snowfall in Queen Maud Land led to years of EAIS mass gain. It is difficult to determine whether these years of enhanced snowfall are anomalous or part of a longer-term trend, reducing our ability to assess the mitigating impact of snowfall on sea-level rise. We determine that the recent snowfall increases in western Queen Maud Land (QML) are part of a long-term trend (+5.2±3.7% decade-1) and are unprecedented over the past two millennia. Warming between 1998 and 2016 is significant and rapid (+1.1±0.7 °C decade-1). Using these observations, we determine that the current accumulation and temperature increases in QML from an ensemble of global climate simulations are too low, which suggests that projections of the QML [Queen Maud Land] contribution to sea-level rise are potentially overestimated with a reduced mitigating impact of enhanced snowfall in a warming world.” (Medley et al., 2018)
8. Globally, 73.1% of island coasts are stable, 15.5% are growing, and 11.4% are shrinking
“This review first confirms that over the past decades to century, atoll islands exhibited no widespread sign of physical destabilization by sea-level rise. The global sample considered in this paper, which includes 30 atolls and 709 islands, reveals that atolls did not lose land area, and that 73.1% of islands were stable in land area, including most settled islands, while 15.5% of islands increased and 11.4% decreased in size. Atoll and island areal stability can therefore be considered as a global trend. Importantly, islands located in ocean regions affected by rapid sea-level rise showed neither contraction nor marked shoreline retreat, which indicates that they may not be affected yet by the presumably negative, that is, erosive, impact of sea-level rise. .. These results show that atoll and island areal stability is a global trend, whatever the rate of sea-level rise. Tuvaluan atolls affected by rapid sea-level rise (5.1 mm/yr; Becker et al., 2012) did not exhibit a distinct behavior compared to atolls located in areas showing lower sea-level rise rates, for example, the Federated States of Micronesia or Tuamotu atolls.” (Duvat et al., 2018)
9. Since 1984, 48% of the globe’s shorelines have been stable, 28% are growing, and 24% are shrinking
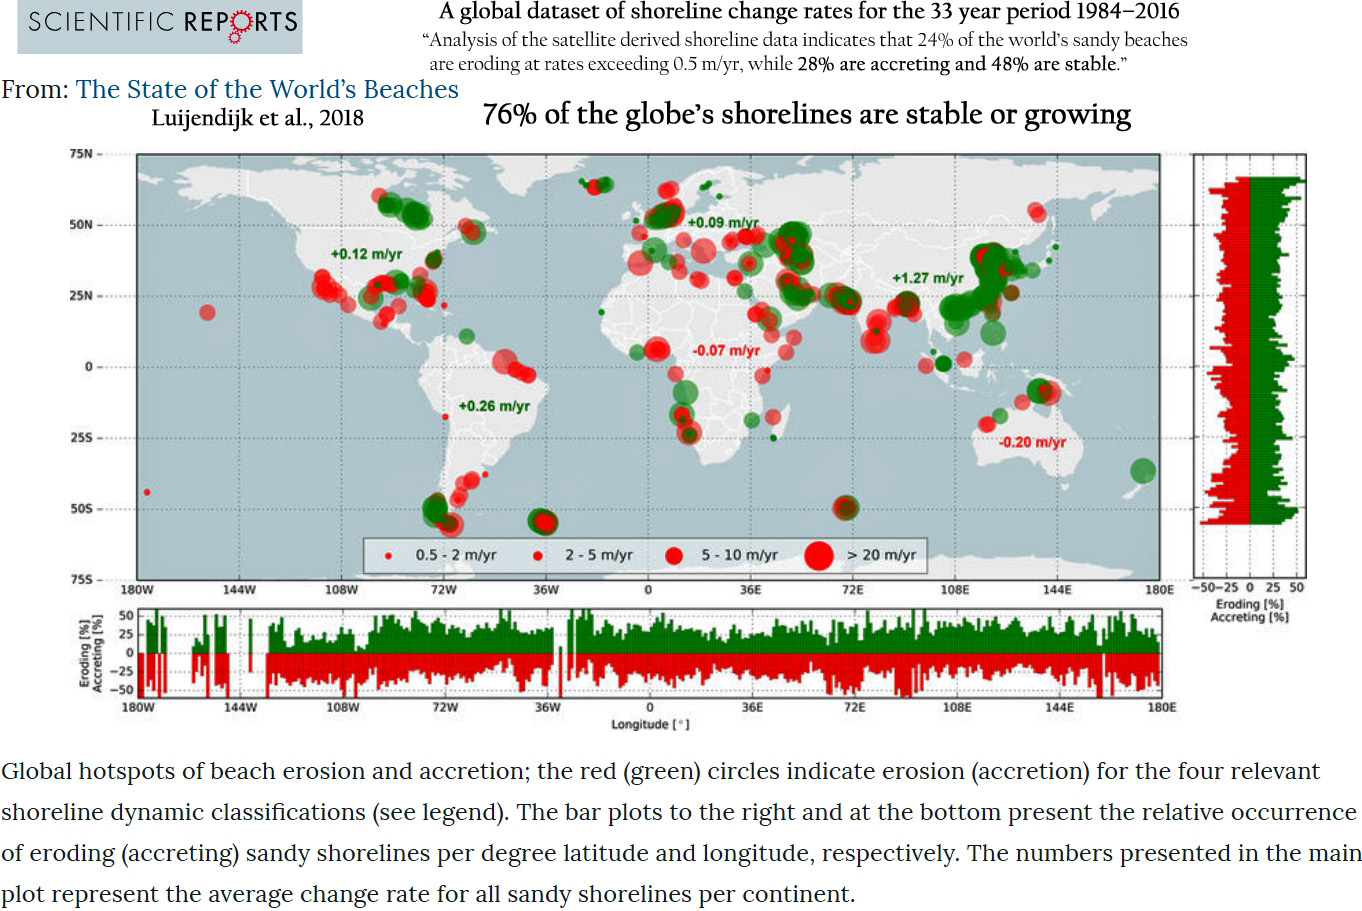
“The application of an automated shoreline detection method to the sandy shorelines thus identified resulted in a global dataset of shoreline change rates for the 33 year period 1984–2016. Analysis of the satellite derived shoreline data indicates that 24% of the world’s sandy beaches are eroding at rates exceeding 0.5 m/yr, while 28% are accreting and 48% are stable. …. Erosion rates exceed 5 m/yr along 4% of the sandy shoreline and are greater than 10 m/yr for 2% of the global sandy shoreline. On the other hand, about 8% of the world’s sandy beaches experience significant accretion (>3 m/yr), while 6% (3%) are accreting more than 5 m/yr (10 m/yr). … Taking a continental perspective, Australia and Africa are the only continents for which net erosion (−0.20 m/yr and −0.07 m/yr respectively) is found, with all other continents showing net accretion.” (Luijendijk et al., 2018)
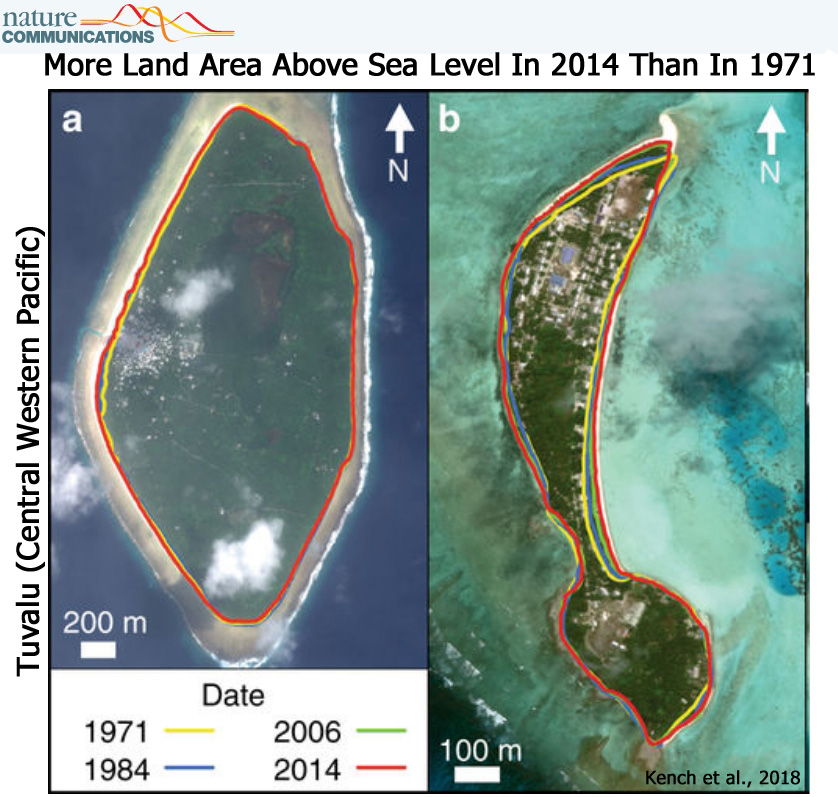
10. “Despite sea-level rise” there has been a “land area increase in eight of nine atolls” since 1971
“We specifically examine spatial differences in island behaviour, of all 101 islands in Tuvalu, over the past four decades (1971–2014), a period in which local sea level has risen at twice the global average (Supplementary Note 2). Surprisingly, we show that all islands have changed and that the dominant mode of change has been island expansion, which has increased the land area of the nation. … Using remotely sensed data, change is analysed over the past four decades, a period when local sea level has risen at twice the global average [<2 mm/yr-1] (~3.90 ± 0.4 mm.yr−1). Results highlight a net increase in land area in Tuvalu of 73.5 ha (2.9%), despite sea-level rise, and land area increase in eight of nine atolls.” (Kench et al., 2018)
11. Bangladesh coastal land area has expanded by 7.9 km2 per year during 1985-2015
“This paper draws upon the application of GIS and remote sensing techniques to investigate the dynamic nature and management aspects of land in the coastal areas of Bangladesh. … This research reveals that the rate of accretion [coastal land growth] in the study area is slightly higher than the rate of erosion. Overall land dynamics indicate a net gain of 237 km2 (7.9 km2annual average) of land in the area for the whole period from 1985 to 2015.” (Ahmed et al., 2018)
12. 54% of ‘vulnerable’ SW Pacific Islands studied had shorelines that expanded from 2005-2015


Morner is a joke when it comes to measuring sea level. A few years ago he was saying that sea level hadn’t risen at all since 1970.
http://www.durangobill.com/GwdLiars/GwdLiarsMoncktonSL.jpg
Original source of the above graph can be seen at: http://scienceandpublicpolicy.org/images/stories/papers/originals/co2_jan_2011.pdf
Bill Butler –
Are you trying to take Seb’s role, aka resident troll?
I agree, the graph you posted is sloppy. The text indicates data through 1960, but doesn’t reference the source of the post-1960 curve.
But the statement, “Mörner is a joke when it comes to measuring sea level” sounds like an ill-advised rant. Are you aware of his credentials and experience? His CV indicates that he may know a thing or two more about sea level rise than Bill Butler / Durango Bill. / sarc off.
https://www.researchgate.net/profile/Nils-Axel_Moerner
The article you referenced in fact covers measured data from several locations which have experienced scant sea level rise over the past few decades.
Butler shows up periodically, not to give us any useful information, but to berate and insult.
I’m guessing his comment above is referring to this document.
Note that just as with temperature data, so with sea level rise. They can’t seem to find it without adjust the data by adding it in by hand.
Funny how he doesn’t bother to show exactly why he thinks that Mörner is wrong. I guess someone of his towering intellect just can’t be bothered explaining anything to the rabble who don’t share his sacred beliefs. I mean, it surely can’t because he’s incapable of doing so, ….can it? //sarc//
ASIDE – Oh, look at how the rising ocean has destroyed the economy of the Maldives!
https://www.hoteliermaldives.com/velana-international-airport-passenger-traffic-2018/
Just how is it that science and public policy got hijacked by scam artists and religious fanatics?
Kurt, I have the feeling you are trying to go the spike55 route here …
The fun part in this is that you skeptics always seem to argue that people like me argue from authority, but here we are and one of you brings up the CV of a guy to support his argument. Just great 😉
OK Seb,
Give us a coherent argument challenging Mörner’s scientific publications.
@Kurt
Butler doesn’t attack the data, or show what’s wrong with it. He attacks the source of that data by calling him “a joke,” and the only “evidence” Butler brings as proof is that 1) his conclusions were different from those of warmists, and 2) his work was featured in an SPPI publication. Talk about ironclad reasoning.
You present evidence that he’s not “a joke,” but is, at the very least, the equal of any of their “experts.”
The house troll then accuses you of appealing to authority, which wasn’t what you were doing at all.
Funny how when the they appeal to authority, it’s always an imaginary one like the perenially wrong IPCC; even though they aren’t real authorities, but slimy bureaucratic trolls in high places who tell us lies about what the real scientists say.
It’s like when they pushed their phony 97% consensus, and one skeptical scientist started a petition that was signed by tens of thousands of scientists, to show that there was no consensus in support of the warming scam. I repeat, it was not an appeal to imaginary authority, but merely a proof that there was no warming consensus.
See also here, here and here.
So, given the evidence, warmists belong more on the bottom of movie theater seats than in positions of power and influence.
So nice of the troll to give me an excuse to vent on this topic. 😉
Well put.
Morner writes then (2011, pg. 30):
“The values of NOAA’s 159 tide gauge stations indicate that they range from uplifted areas to subsiding areas (green zones). If the uplifting and subsiding sites (green zones) are excluded, we are left with a number of sites (red zone) where the rise in sea level ranges between 0.0 and 2.0 mm/year. This is well below the rate given by IPCC (pink area) and satellite altimetry.”
Morner writes now (2018):
“The University of Colorado chose 184 global tide-gauge records. Their rate of distribution has a marked peak in the zone from ±0.0 to +2.0 mm/yr with a mean value at +1.14 mm/yr. Because the majority of stations used include a component of regional subsidence and local sediment compaction, the true mean sea level value should be <+1.14 mm/yr."
Morner writes in 2017:
Mörner, 2017
http://www.ijesi.org/papers/Vol(6)8/Version-1/G0608014851.pdf
“Global tide gauge data sets may vary between +1.7 mm/yr to +0.25 mm/yr depending upon the choice of stations. At numerous individual sites, available tide gauges show variability around a stable zero level. Coastal morphology is a sharp tool in defining ongoing changes in sea level. A general stability has been defined in sites like the Maldives, Goa, Bangladesh and Fiji. In contrast to all those observations, satellite altimetry claim there is a global mean rise in sea level of about 3.0 mm/yr. In this paper, it is claimed that the satellite altimetry values have been “manipulated”. In this situation, it is recommended that we return to the observational facts, which provides global sea level records varying between ±0.0 and +1.0 mm/yr; i.e. values that pose no problems in coastal protection“
Other peer-reviewed estimates:
Parker and Ollier, 2017
https://link.springer.com/article/10.1007/s41748-017-0019-5
“[L]ocal sea-level forecasts should be based on proven local sea-level data. Their naïve averaging of all the tide gauges included in the PSMSL surveys showed ‘relative’ trends of about + 1.04 mm/year (570 tide gauges of any length). By only considering the 100 tide gauges with more than 80 years of recording, the average trend was only + 0.25 mm/year [2.5 centimeters per century].”
“The loud divergence between sea-level reality and climate change theory—the climate models predict an accelerated sea-level rise driven by the anthropogenic CO2 emission—has been also evidenced in other works such as Boretti (2012a, b), Boretti and Watson (2012), Douglas (1992), Douglas and Peltier (2002), Fasullo et al. (2016), Jevrejeva et al. (2006), Holgate (2007), Houston and Dean (2011), Mörner 2010a, b, 2016), Mörner and Parker (2013), Scafetta (2014), Wenzel and Schröter (2010) and Wunsch et al. (2007) reporting on the recent lack of any detectable acceleration in the rate of sea-level rise. The minimum length requirement of 50–60 years to produce a realistic sea-level rate of rise is also discussed in other works such as Baart et al. (2012), Douglas (1995, 1997), Gervais (2016), Jevrejeva et al. (2008), Knudsen et al. (2011), Scafetta (2013a, b), Wenzel and Schröter (2014) and Woodworth (2011). … [T]he information from the tide gauges of the USA and the rest of the world when considered globally and over time windows of not less than 80 years […] does not support the notion of rapidly changing mass of ice in Greenland and Antarctica as claimed by Davis and Vinogradova (2017). The sea levels have been oscillating about a nearly perfectly linear trend since the start of the twentieth century with no sign of acceleration. There are only different phases of some oscillations moving from one location to another that do not represent any global acceleration. … The global sea-level acceleration is therefore in the order of + 0.002 ± 0.003 mm/year², i.e. + 2 ÷ 3 μm/year², well below the accuracy of the estimation. This means that the sea levels may rise in the twenty-first century only a few centimeters more than what they rose during the twentieth century. This is by no means alarming.”
—
Zerbini et al., 2017
http://www.sciencedirect.com/science/article/pii/S0012825216302689
“Our study focuses on the time series of Alicante, in Spain, Marseille, in France, Genoa, Marina di Ravenna (formerly Porto Corsini), Venice and Trieste, in Italy. After removing the vertical land motions in Venice and Marina di Ravenna, and the inverted barometer effect at all the sites, the linear long period sea-level rates were estimated. The results are in excellent agreement ranging between + 1.2 and + 1.3 mm/year for the overall period from the last decades of the 19th century till 2012. The associated errors, computed by accounting for serial autocorrelation, are of the order of 0.2–0.3 mm/year for all stations, except Alicante, for which the error turns out to be 0,5 mm/year. … Our estimated rates for the northern Mediterranean, a relatively small regional sea, are slightly lower than the global mean rate, + 1.7 ± 0.2 mm/year, recently published in the IPCC AR5 (Intergovernmental Panel on Climate Change 5th Assessment Report) (Church et al., 2013), but close enough, if uncertainties are taken into account. It is known that Mediterranean stations had always had lower trends than the global-average ones. Our regional results, however, are in close agreement with the global mean rate, + 1.2 mm/year, published by Hay et al. (2015) which is currently being discussed by the oceanographic community”
There is little room for doubt that the earth has warmed considerably over recent years and, as far as we can tell, is continuing to do so. What this means for melting ice and sea levels is much less clear.
The real issue that ought to concern us is how much of this warming is down to increased atmospheric carbon dioxide. If, as I suspect, much of the warming has other causes, then the climate alarmism is unjustified
Why should concern about the rather rapid climate change be unjustified when we can’t do anything about it, e.g. if it should turn out that skeptics perception of the laws of physics have been correct all along and there is no such thing as a CO2 GHE?
When will skeptics apply some skepticism towards their own heroes and claims?
Why do you believe a 0.02°C change in the ocean heat content (i.e., what “global warming” means) over the course of the last 20 years (1994-2013) is justifiably concerning? Especially when it’s not even been robust enough to negatively affect the globe’s shorelines (i.e., more land area is above sea level today than during the 1980s). The Earth is greener, crops yields are massive, droughts, floods, hurricanes, and tornadoes are less common today than a few decades ago… What’s concerning, SebastianH?
What if there is such a thing as a CO2 greenhouse effect, but its influence is so easily overwhelmed by other natural factors (i.e., cloud cover changes) that the attempts to “do something about” CO2 emissions has such a negligible effect on climate that the costs to economies and to ecosystems is greater than if we were to do nothing?
Dr. Michael Mann claims that we’ll get 2.6 meters of sea level rise by 2100, and 17.5 meters by 2300. Do you have any skepticism about these claims? If not, how do you think we’ll get that much sea level rise? What’s the mechanism?
I ask because it’s been established that the absolute radiative forcing from the CO2 GHE has been determined to be about 1 W m-2 for both Antarctica and Greenland. How is that going to be enough to melt the ice sheets to the degree that is needed to reach those levels of SLR? Or did you have some other mechanism in mind that will be catastrophically melting the polar ice sheets?
https://agupubs.onlinelibrary.wiley.com/doi/full/10.1002/2015GL066749
“The observation of an intensity maximum in the CO2 band above Antarctica corresponds to a negative GHE, in agreement with the negative surface‐stratosphere temperature differences. This implies that increasing CO2 causes the emission maximum in the TOA spectra to increase slightly, which instantaneously enhances the LW cooling in this region, strengthening the cooling of the planet. … Short‐wave radiation is affected by changes in humidity, cloud cover, and also by the weak absorption of solar radiation by CO2. Over Antarctica, this sums up to 0.5 W/m2 for autumn, winter, and spring and up to 1 W/m2 in summer. … For most of the Antarctic Plateau, [the CO2] GHE is close to zero or even slightly negative; i.e., the presence of CO2 increases radiative cooling. Over Greenland, the greenhouse effect of CO2 is also comparatively weak but invariably positive.”
Why do you think it is not? It’s not like the entire ocean warmed by 0.02°C in that time. Maybe you could recalculate that to include the entire mass of this planet? Or better, the solar system? To make it less concerning, you know …
I know you don’t like analogies, but the bathtub with equal in- and outflow comes to mind here. Those flows are magnitudes higher than whatever I can do with a cup shoveling water into the bathtub. Yet the water level will rise because of me and not because of the overwhelming “natural factors”.
But to answer your question (“What if […] the costs to economies and to ecosystems is greater than if we were to do nothing?”), yeah what if we end up with a more sustainable economy, with cleaner air and water, less pollution, etc … but feel free to fantasize about how renewables (the buildup towards 100%) will cost more than continuing to use fossil fuels and how wind turbines destroy the environment 😉
What are the conditions for these predictions, Kenneth? Does he really say we will see this kind of rise or does he say we will see it under some well defined circumstances? I am skeptic about your generalisations. Should I hold you to the same standard as someone who predicted 10 years ago that we will see a -2.x°C temperature anomaly by 2020? Are you not skeptic about such a claim? Why not?
I am guessing that paper details this very well. Probably mostly by thermal expansion and secondly by meltwater.
Yeah I know that this is how you think ice melts or temperatures in those regions increase. You bring this up all the time, not recognizing how weird that question is 😉 As if those regions are not connected to the rest of the planet. The increased heat content of the planet gets transported to the poles, that’s why they are warming.
Because warmth is far better for the biosphere than cold…even if the added warmth is minuscule. And the only real potentially negative effect of added warmth — sea level rise that engulfs shorelines of population centers — hasn’t been realized. The opposite — coastal land area has increased — has actually occurred.
Forest-clearing for biofuel use and to build more wind turbines that destroy ecosystems and habitats is not “sustainable”. Neither is the $2.4 trillion-per-year price tag.
And CO2 is not a pollutant. Nor does it dirty the air or water.
The increased heat content in the tropics that gets transported to the poles (which hasn’t worked for the cooling Southern Ocean for some reason) can be explained by the increase in absorbed solar radiation due to the reduction of cloud cover…
https://notrickszone.com/wp-content/uploads/2018/05/Cosmic-Rays-Missing-Link-Between-Sun-and-Climate.jpg
Exactly how does one disprove the theoretical? By definition, a theory (or hypothesis) is a conceptualization that has not been proven.
So “disproving” an idea or concept (or belief) that has never been proven in the first place is circular logic.
Cite the scientific proof that quantifies how much of a change in ocean temperature a 10 ppm change in atmospheric CO2 elicits. Do you have that data? No? Then what on Earth could you possibly be asking us to disprove?
An older video of an impromptu interview of Dr Mörner where he discusses sea level reality, and how the science was hijacked by anti-science.
https://youtu.be/uBPXjQRJA90?t=50
(after the Mörner portion there’s a discussion about the immorality of keeping the poor of the world in poverty – also worth a listen)
I have definitely noticed the 0.02C change in the past 30 years
I don’t know what you are talking about – and neither, I suspect, do you.
If you take the annual trends over the last 30 years, (1988-2017) and multiply by 30, then you get the following results for the temperature rises: HCT4 =0.55; GISS =0.46; NOAA =0.51; UAHv6.0 =0.39 and RSSv4.0 =0.64 degrees centigrade.
It’s likely he’s talking about the change in ocean heat content, as the oceans are where 93% of the change in radiative energy is said to have accumulated in recent decades (according to the IPCC). The atmosphere/surface temperatures you’ve cited only account for 1% of the global warming, so the oceans are where it’s at when it comes to externally-forced changes from energy budget imbalances.
“Ocean warming dominates the total energy change inventory, accounting for roughly 93% on average from 1971 to 2010 (high confidence). The upper ocean (0-700 m) accounts for about 64% of the total energy change inventory. Melting ice (including Arctic sea ice, ice sheets and glaciers) accounts for 3% of the total, and warming of the continents 3%. Warming of the atmosphere makes up the remaining 1%.” (IPCC, 2013)
And, according to a most recent paper, the oceans warmed by 0.02°C between 1994-2013. So the only thing Matthew Bruha had wrong was that the “rapid” global warming of 0.02°C took place in the last 20 years. (He wrote 30 years.)
Wunsch, 2018
https://www.tandfonline.com/doi/full/10.1080/16000870.2018.1471911
“Lower-bounds on uncertainties in oceanic data and a model are calculated for the 20-year time means and their temporal evolution for oceanic temperature, salinity, and sea surface height, during the data-dense interval 1994–2013. … Trends [in temperature] are estimated as […] 0.0011 ± 0.0001 °C/y, with formal 2-standard deviation uncertainties. The temperature change corresponds to a 20-year average ocean heating rate of 0.48 ±0.1 W/m2 of which 0.1 W/m2 arises from the geothermal forcing. … The mean slope implies a change over 20 years [1994-2013] of 0.0213 ± 0.0014 °C.”
I suspect that Matthew is a regular reader here (though this looks like his first approved comment), as we highlighted what amounts to 0.02°C global warming a few months ago:
False Alarm: New Study Finds Global Ocean Warmed By 0.02°C From 1994-2013, With Cooling Below 3600m
“A new analysis of top-to-bottom (0-5000 m) ocean heat content changes since the mid-1990s reveals that (a) large regions of the global ocean have undergone cooling, and (b) the overall net temperature change for 1994-2013 was a modest 0.02°C. In contrast, during the Holocene the oceans naturally warmed at a rate and magnitude several times greater than the last few decades, undermining claims that the modern era change is unusual or unprecedented.”
It would be advisable to refrain from telling fellow commentators that they don’t know what they are talking about.
@skeptik
I could be wrong, but I took Matthew’s comment to be sarcasm, as in “Oh my, look how hot it’s getting!”
I mean, come on. You can’t even read tenths of a degree, let alone hundredths. How are you going to feel it?
Don’t you just love IPCC “settled science”🤮
To heck with all this peripheral argument. The fact is that for decades now I have heard the dreaded Greenland ice sheet is melting and coming to drown all of us anywhere near a low lying coast. And for decades it hasn’t happened. The Maldives were all supposed to be underwater by now. Not a single one is. The examples of failed predictions go on and on.
Where is the water? Global SLR is not accelerating. Put up or shut up already because a whole lot of people are tired of this broken disaster record being played over and over and over and over again. At least try to come up with some new type of disaster to harp on because listening to the same old one has gotten about as interesting and alarming as watching paint dry.
You haven’t noticed that Greenland lost thousands of gigatonnes of ice mass since the start of this century? Hmm …
Really? What else was predicted in the 80s that hasn’t happened by now? Or better, what else has been predicted just 10 years ago and hasn’t happened? Remember those skeptics “the coming ice age is near” claims from that time? 😉
Yes it is. Kenneth likes to link to the Frederikse et al., 2018 paper all the time. The acceleration is there even though he likes to only point to the perceived small average of around 1.5 mm/yr, the current rate is around 3 to 4 mm/yr and still accelerating.
Rest assured, those outside of your bubble are very tired of hearing the same flawed “arguments” from your side over and over as well. Maybe it is time you guys came up with something substantial? It should be easy to disprove a theory. Just find one example where it doesn’t work … can’t be that hard 😉
Tell me Seb. When will the west side highway in Manhattan be submerged and the windows taped up in NYC? Battery Park shows no SLR. The only problem they have right now is with the frozen water just as DC is having right now.
So where is the SLR rate increase? Let me guess! Only in the middle of the ocean and not near stable tide gauges with a long record?
What has been predicted to have happened has not and there are no indications in the real, non adjusted, observable world that it is going to.
In Boston, where they are in the midst of their snowiest decade on record, the ends of the big dig are just a far above SL as they were then the tunnel was finished. https://boston.cbslocal.com/2018/11/15/boston-weather-snow-snowiest-decade-northeast-storms-weatherbell-trends-beyond-the-forecast/
@rah
A simple way to settle this is to ask how much the observed rise in the oceans corresponds to loss of Greenland ice.
According to Dr Moerner, a realistic estimate of sea level rise is 0.7 mm per year. Given that if all Greenland ice melted the seas would rise 7 meters, we find that 7000mm/0.7mm per year = 10,000 years.
If we take what Moerner calls a less realistic estimate of 1.3mm per year, we find that 7000mm/1.3mm per year = 5,385 years.
Put another way, the “massive” amounts of ice melting from Greenland every year amount to no more than 0.01 to 0.02 percent of it’s total.
And if you consider that they claim that other ice is also rapidly melting, then the contribution from Greenland must be even less.
Unless sea level rise is accelerating, which it only is in the demented paranoid minds of warmists, there is NOTHING to worry about.
As Moerner points out, dramatic sea level rise was the result of adding a fudge factor to the data.
https://www.climategate.nl/wp-content/uploads/2011/05/morner.pdf
Just as they are now caught tampering with temperatures,…
https://www.manhattancontrarian.com/blog/2018-10-7-the-greatest-scientific-fraud-of-all-time-part-xix
…so they tamper with any data that doesn’t give them the answer they want.
Once again the troll is about as wrong as can be. Yeah, I’m as surprised as you are. (rolls eyes)
And what does “thousands of gigatonnes” of meltwater translate into in terms of sea level rise equivalent? 1.5 centimeters.
New Paper: Greenland Gained Ice Between 1940s-2000s, Added Just 1.5 cm To Sea Levels Since 1900
Since 1993, it’s been 0.39 of a centimeter added by Greenland ice sheet meltwater. Yeah, I kind of doubt he “noticed” that.
Since 1993, Greenland’s Ice Sheet Melt Has Added Just 0.39 Of A Centimeter To Global Sea Levels
The West Side Highway in NYC will be underwater.
Global SLR is not accelerating.
Parker and Ollier, 2017
https://link.springer.com/article/10.1007/s41748-017-0019-5
“[L]ocal sea-level forecasts should be based on proven local sea-level data. Their naïve averaging of all the tide gauges included in the PSMSL surveys showed ‘‘relative’’ trends of about + 1.04 mm/year (570 tide gauges of any length). By only considering the 100 tide gauges with more than 80 years of recording, the average trend was only + 0.25 mm/year [2.5 centimeters per century]. … The loud divergence between sea-level reality and climate change theory—the climate models predict an accelerated sea-level rise driven by the anthropogenic CO2 emission—has been also evidenced in other works such as Boretti (2012a, b), Boretti and Watson (2012), Douglas (1992), Douglas and Peltier (2002), Fasullo et al. (2016), Jevrejeva et al. (2006), Holgate (2007), Houston and Dean (2011), Mörner 2010a, b, 2016), Mörner and Parker (2013), Scafetta (2014), Wenzel and Schröter (2010) and Wunsch et al. (2007) reporting on the recent lack of any detectable acceleration in the rate of sea-level rise. The minimum length requirement of 50–60 years to produce a realistic sea-level rate of rise is also discussed in other works such as Baart et al. (2012), Douglas (1995, 1997), Gervais (2016), Jevrejeva et al. (2008), Knudsen et al. (2011), Scafetta (2013a, b), Wenzel and Schröter (2014) and Woodworth (2011). … [T]he information from the tide gauges of the USA and the rest of the world when considered globally and over time windows of not less than 80 years […] does not support the notion of rapidly changing mass of ice in Greenland and Antarctica as claimed by Davis and Vinogradova (2017). The sea levels have been oscillating about a nearly perfectly linear trend since the start of the twentieth century with no sign of acceleration. There are only different phases of some oscillations moving from one location to another that do not represent any global acceleration. … The global sea-level acceleration is therefore in the order of + 0.002 ± 0.003 mm/year², i.e. + 2 ÷ 3 μm/year², well below the accuracy of the estimation. This means that the sea levels may rise in the twenty-first century only a few centimeters more than what they rose during the twentieth century. This is by no means alarming.”
That sea level rise trend begins in the year 1958 in that paper. In 1958, sea levels were barely rising. So yeah, there’s acceleration if we begin in that selected year.
Just like what seems like most of my lifetime they keep pumping out numbers to support their claims of dangerous SLR but the effects never show in the real world of observations and effects on population centers. One tries to call them on it and what they get is just more of the same bull shine numbers over and over again. If the Greenland ice sheet is melting at a dangerous rate then where is the water? Where is the catastrophic SLR. Show me the damage. The effects. I’m done with their constant line of BS.
[…] No Tricks Zone – Climate Alarmism Dies In 2018 As Modern Ice Melt, Sea Level Rise Has No Net I… […]
[…] by Kenneth Richard, November 15, 2018 in NoTricksZone […]
You haven’t noticed that Greenland lost thousands of gigatonnes of ice mass since the start of this century?
And replaced much of it. This is not a one way process. How come there was so much less ice around Greenland in previous millennia?
From an official history (Danish) of Greenland:
“Until around 4500 BC, the remains of the mighty ice cap which had been left over from the last ice age covered parts of Arctic Canada and blocked the way to Greenland. The first people arrived in the northernmost part of Greenland in around 2500 BC, and in the course of a few hundred years the ice-free part of the island became home to an Arctic tribe of hunters known as the Palaeo-Eskimos. The warmer climate which appeared once the ice had gone allowed the
population to increase rapidly. The Arctic hunters followed the roaming herds of musk oxen and reindeer, and tools made of bone and stones found in the area from Alaska to Greenland show clear signs of cultural homogeneity.
The Dorset culture developed independently from around 500 BC until c. 1200, and the people became especially adapted to sealing and caribou hunting. An abundance of artefacts and carvings have been found from this period. Towards the end of the 10th century the climate became warmer, and
the change affected all those living in the northern hemisphere. Much of the ice in the seas around the Canadian archipelago disappeared, and baleen whales moved into the area to search for food. Eskimo whalers from northern Alaska sailed east in their large, skin-covered boats and reached Greenland in the 12th century.”
[…] Read rest at No Tricks Zone […]
[…] Read rest at No Tricks Zone […]
[…] https://notrickszone.com/2018/11/15/climate-alarmism-dies-in-2018-as-modern-ice-melt-sea-level-rise-h… […]