By Kyoji Kimoto
kyoji@mirane.co.jp
1. Warmer period of the 1930s
In 1998 D. Dahl-Jensen et al. pointed out in the journal Science that the 1930s is 0.5°K warmer than the present time based on a bore-hole study of Greenland ice sheet.
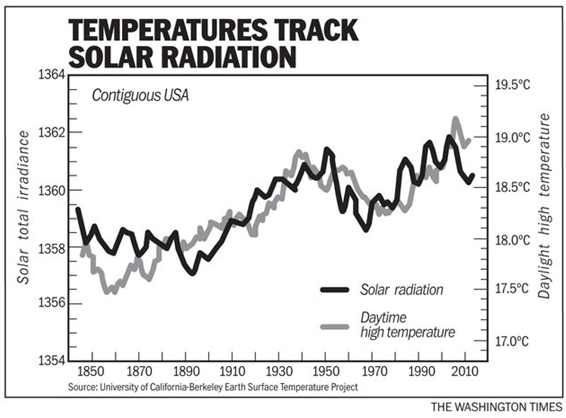
The following data support D. Dahl-Jensen’s findings, from Soon 2012.
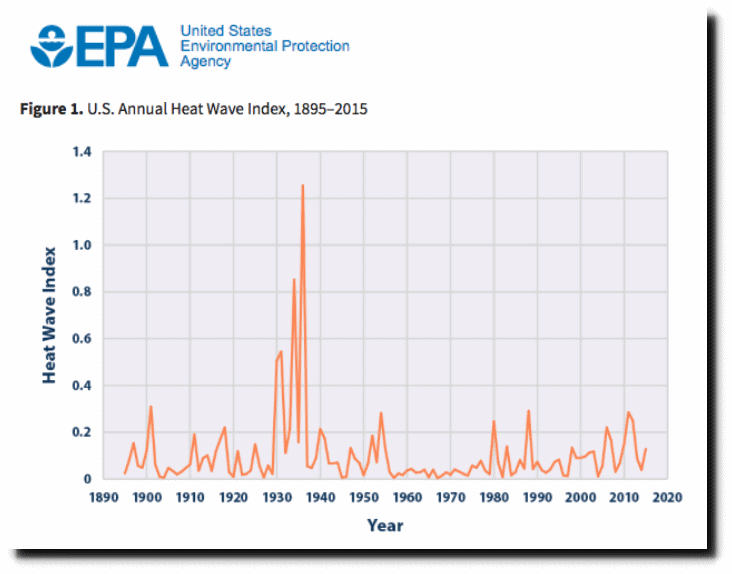
Also heat waves were far worse across the USA in the 1930s:
More heat waves in the 1930s.
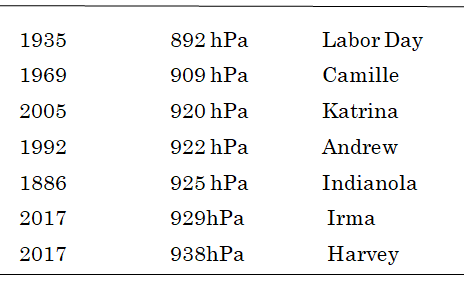
The strongest hurricane was the Labor Day hurricane, which hit in 1935. Hurricane Irma and Harvey had much higher central pressure at landfall. (U.S .National Hurricane Center):
Strongest hurricane occurred in the 1930s.
2. Arctic temperature and sea ice extent
Parts of the Arctic were warmer in the 1930s:
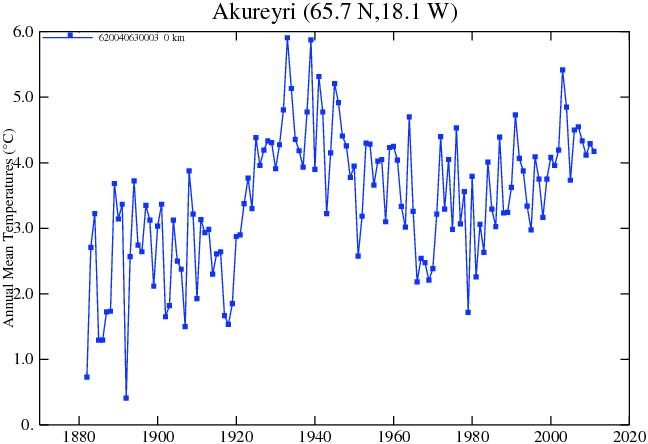
Source: Real Climate Science.
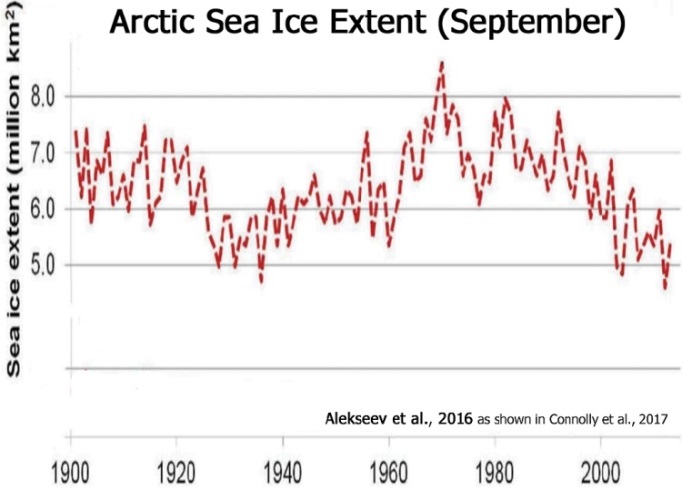
Arctic sea ice levels were just as low in the 1930s as they are today:
Read more here.
3. NASA & NOAA altered the data
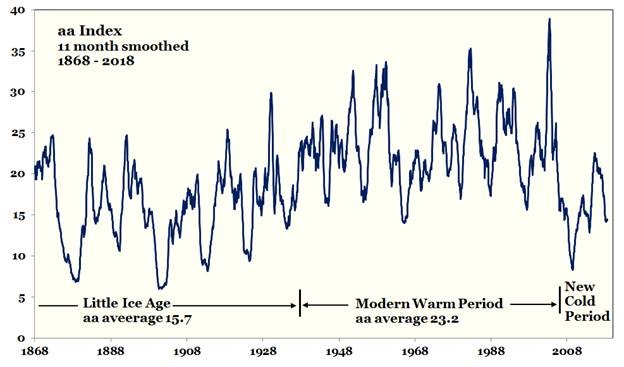
The climatic data above can be understood with solar activity change (aa Index) and ocean oscillation (Pacific Decadal Oscillation Index), see the 2 charts that follow.
(Archibald)
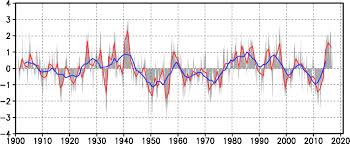
The Pacific Decadal Oscillation (PDO) index was also in its warm phase during the 1930s:
PDO index was positive from1925 to1945. Data: Japan Meteorological Agency.
In summary, increasing solar activity with positive PDO index caused the warmer period of the 1930s. However, NASA and NOAA have made data tampering to stress recent warming.
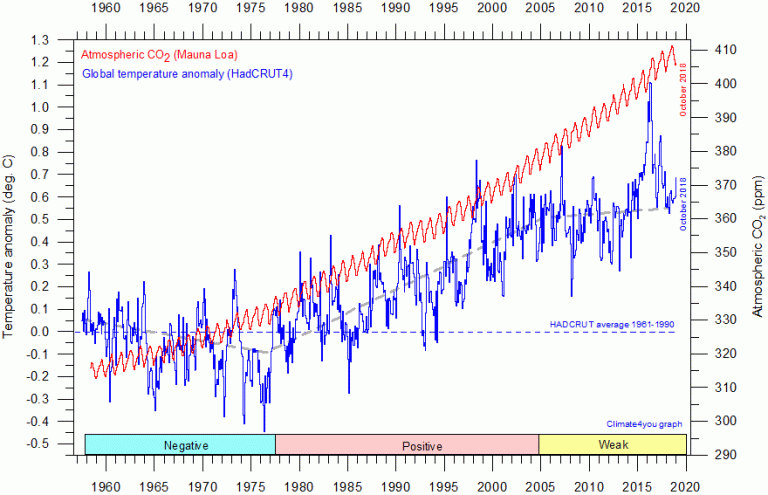
Recent temperature data shows strong influence of ocean oscillation (El Nino) and no relation with CO2 increase as follows:
Source: Climate4you
4. MWP & LIA caused by changes in solar activity
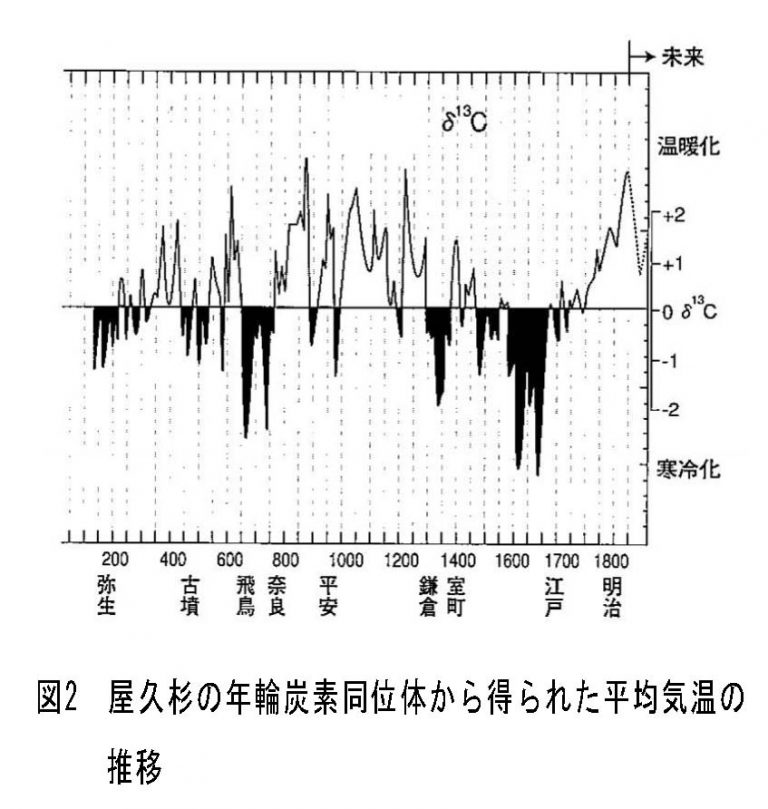
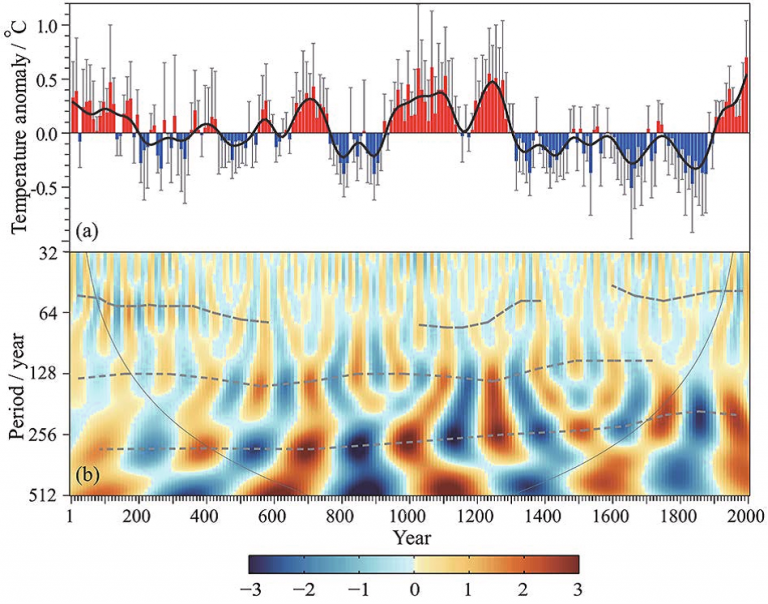
Solar activity proxies show the MWP & the LIA in Japan and China as follows:
Chart above: Kitagawa, H. & Matsumoto, E., Geophysical Research Letters, Vol. 22, 2155-2158, 1995
Graphic above: Quansheng GE. et al., Advances in atmospheric sciences, Vol. 34, 941-951, 2017.
There are hundreds of other proxies worldwide that support solar activity as the main climate driver.
5. Sea level rise
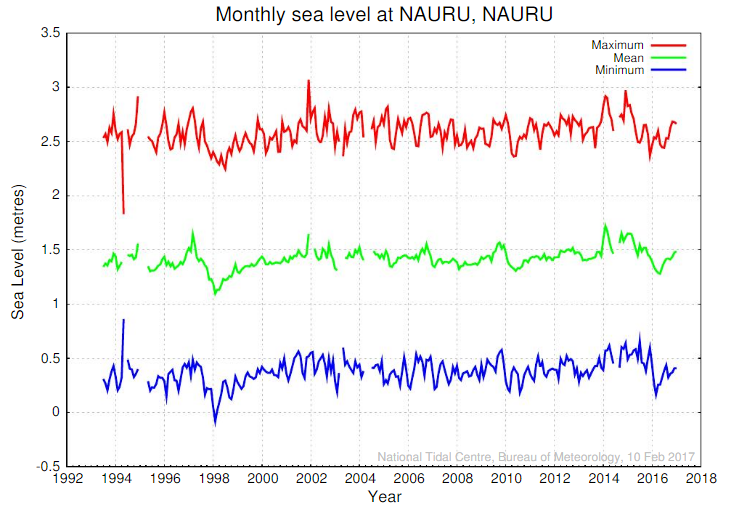
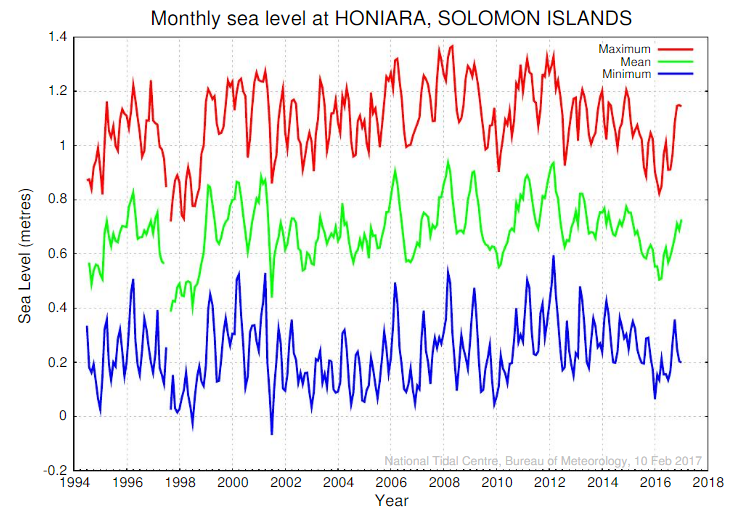
Almost 25-years of meticulous data gathered by the Australian Bureau of Meteorology displays no discernible sea-level rise for Solomon Islands and Nauru. See the two graphs that follow:
Source: WUWT.
6. El Nino linked to solar activity
A publication by Njau (2006) showed El Nino starts at the year of sunspot minimum or maximum, thus showing that solar activity has a major impact on oceanic oscillations, which in turn powerfully impact weather and climate.
7. Extreme weather and solar activity
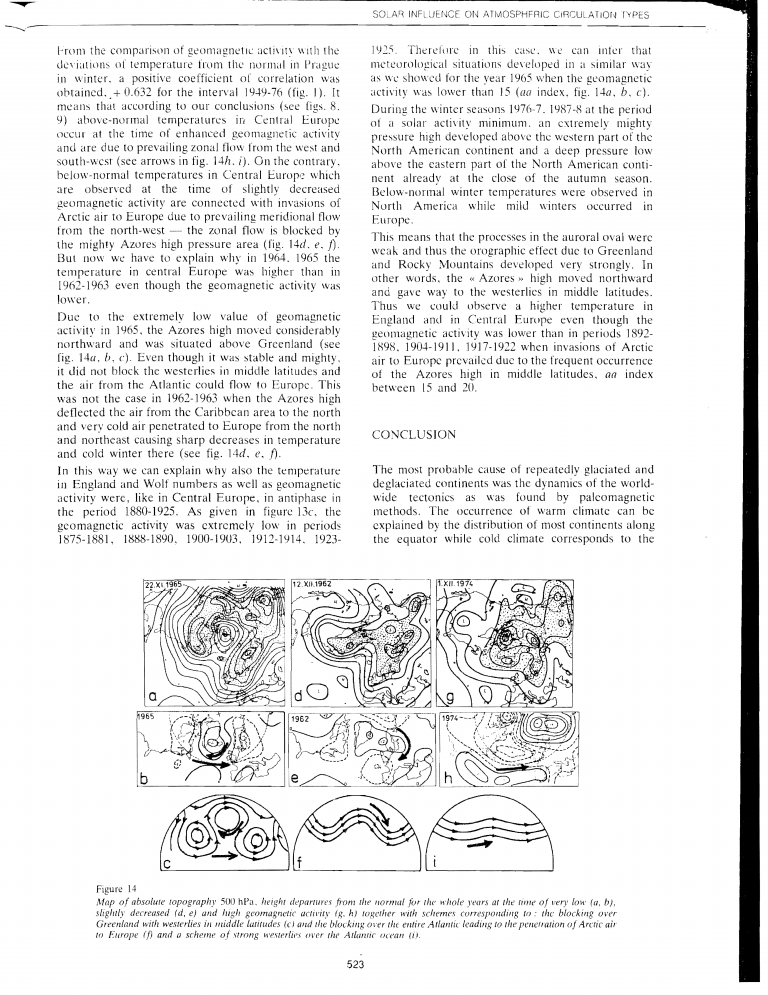
Bucha (1988) showed decreased solar activity causes meandering of jet stream which produces extreme weather in broad area. Since 2006 decreased solar activity has been causing heat waves, wildfires and heavy rainfall and snowfall all over the world.
Bucha (1988)


Very interesting 40 minute video presentation by Nir Shaviv on the solar – climate connection and cosmic rays.
Shaviv first presents the evidence that the sun affects climate before explaining the cosmic ray ideas.
https://www.youtube.com/watch?v=p9gjU1T4XL4
Thanks, Don. Very nice.
Thanks Don B. Excellent, Nir Shaviv is one of the sanest researchers in the field and well ahead of pack.
“However, NASA and NOAA have made data tampering to stress recent warming.”
The NASA link works, it goes to a Tony Heller forecast at Principia Scientific, I didn’t check it closely.
The NOAA link apparently fails and goes to a table of contents of press releases. It has a search function, but I can’t find a relevant press release, e.g. https://science.house.gov/search/node/noaa%20scientist%20adjusted%20climate%20record yields no hits.
Those two names together in one sentence really made me cringe. Imagine how you would have reacted when reading about Al Gore and skepticalscience.com in one sentence and multiply that feeling by 100 😉
Do you have anything of substance to add, or are your feelings when you see the names Tony Heller and Principia Scientific as good as it gets?
Huh? I replied to a mention of Tony Heller AND Pricipia Scientific. What do you expect? A dissertation level response? There was no claim hidden there, just the mention of those two names.
But thanks for adding such a substantial reply.
Tony Heller’s name should make you cringe as his historic data investigations show that the NASA has definitely adjusted data downward for the past.
He has also shown and I have checked that NASA use a great deal of filled in data when actual data exists.
Sebastian, I nearly didn’t check the NASA link at all, but duty called. 🙂
Kenneth, I’d go with multiply by 10. Al Gore equates climate skeptics with Flat Earthers. I met Harrison Schmitt, the only geologist to visit the moon, at an ICCC (climate conference attended mostly by skeptics). Apollo astronauts are not Flat Earthers.
Adding something of substance would overwhelm this thread. Suffice it to say that PSI has some really bizarre ideas about thermodynamics, and that Tony Heller left WUWT soon after a major blowup about CO2 frost in Antarctica that I was in the midst of. (Short answer – doesn’t happen, too little CO2. Same as cars sometimes not having frost on cold mornings.) Pity, as Heller has done some really good historical stuff.
I don’t think equating skeptics with flat earthers means that he (or I for that matter) think that skeptics are flat earthers. You guys use the same kind of language and ignore the actual science and evidence while making up stuff to support your wild claims. Kind of what flat earthers do as well.
Just curious: Does the “actual science” say that we are currently experiencing 30,000 species extinctions every year (which you believe is true), or is this figure based on a modeled assumption from someone who wrote a book?
https://notrickszone.com/2017/10/16/recent-co2-climate-sensitivity-estimates-continue-trending-towards-zero/#comment-1232607
SebastianH: “Regarding extinction of species, why do you think 30,000 species lost per year is a big number? We are already at or over that rate.”
https://notrickszone.com/2019/01/10/science-the-deep-ocean-plays-a-leading-role-in-global-warming-its-colder-now-than-during-the-1700s/comment-page-1/#comment-1284346
“The times CO2 concentration was higher, mass extinctions happened.”
SebastianH gets his “data” from Paul Erlich-esque “background rate” modeled assumptions (not observations or real-world evidence) as outlined in the following source:
Eldredge, Niles, Life in the Balance Humanity and the Biodiversity Crisis
http://www.whole-systems.org/extinctions.html
Graph is based on a mathematical model linking species to habitat loss developed by Edward O. Wilson and others.
Assumptions: Total number of species = 10 million background extinction rate from fossil records is one extinction per million species per year; estimated total number of species 10 million – background rate = 10 species per year.
Extinction Rates:
1. Edward Wilson estimates 27,000 species are currently lost per year. By 2022, 22% of all species will be extinct if no action is taken.
2. Niles Eldridge estimates 30,000 per year currently.
3. Georgina M. Mace using a different methodology based on extrapolations from the current lists of endangered species arrives at a figure of 14-22% loss of species and subspecies over the next 100 years.
4. Paul Ehrlich, using another approach based on total energy use estimates extinction rates at 7,000 to 13,000 times the background rate, (70,000 to 130,000 species per year) which he says is higher than figures based on data for higher orders of animal indicates, but we have little data on insects and micro flora and fauna.
“Suffice it to say that PSI has some really bizarre ideas about thermodynamics.” – Ric Werme
Suffice it to say that some of them have some really bizarre ideas about a lot of things. I once pointed out what one said contradicted very well established physics (can’t remember if it was Einstein or Feynman), and he said he had issues with them. Oooh Kay then.
But Tony Heller’s contributions have been pretty solid. Link isn’t working for me, probably due to Democrat induced shut-down. Do you know if PSI just printed something of his, or did he consciously contribute to them? It makes a difference to me, credibility-wise.
And, before I sign off, I’d just like to rub SebH’s face in this…
https://notrickszone.com/2018/02/04/world-leading-authority-sea-level-absolutely-stable-poor-quality-data-from-office-perps-ipcc-false/#comment-1250621
(and the one that follows that)
Poor SebH. Just kidding. I have no sympathy for anyone who’s so deliberately toxic.
Is this the result of your own thinking about this matter or has some TV/radio station or the hamberger guy himself told you too believe that this is the case? Are you this easy to manipulate into thinking that it’s always the fault of the other side? It would at least explain a lot of your climate related comments 😉
[…] Fonte: No Tricks Zone […]
OOPS
This was supposed to be posted here, instead of to the next article about ocean heat.
https://notrickszone.com/2019/01/14/regional-models-3-10c-warming-in-the-next-80-years-observations-no-warming-in-the-last-40-100-years/comment-page-1/#comment-1284752
[…] https://notrickszone.com/2019/01/13/sun-as-main-driver-japanese-scientist-cites-7-major-examples-how-… […]
[…] https://notrickszone.com/2019/01/13/sun-as-main-driver-japanese-scientist-cites-7-major-examples-how-… […]