Where have all the globe-trotting climate ambulance chasers gone? Well, they’re nowhere to be found in Europe nowadays.
Hat-tip: Snowfan in Germany
The reason is the unusual cold that has swept across a large swath of the continent and which has sent temperatures plummeting to near freezing.
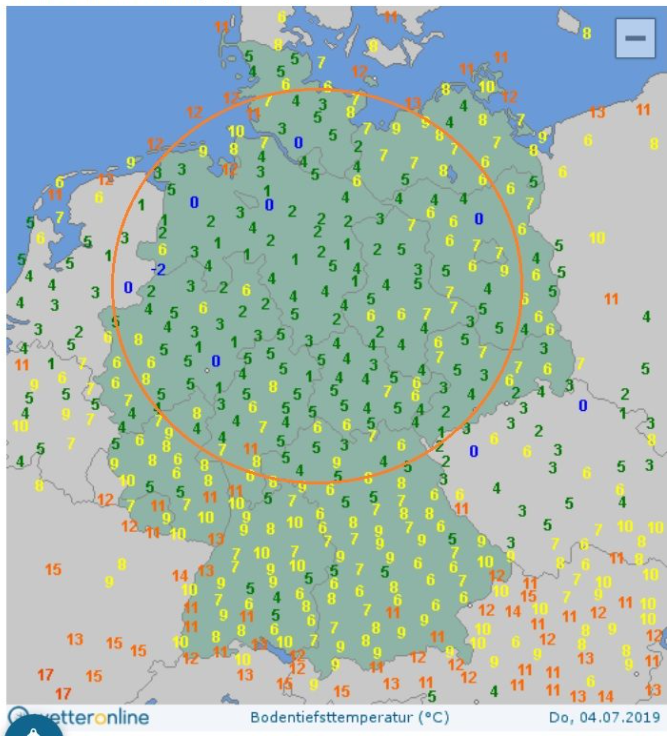
Icebox July: Parts of Central Europe saw ground surface frost yesterday morning. Source: Wetteronline.de
Yesterday morning ground frost hit parts of Belgium, Holland, Germany and the Czech Republic, as the above chart shows. Unsurprisingly, the media have been curiously silent about it.
Record Dutch July low
It has also been reported that a new all-time July low had been recorded in the Netherlands, according to one source here. The online NL Times here reported, “residents of Eastern Netherlands woke up to a frost covered landscape on Thursday” and that in Twente, “a minimum of -1.6 degrees Celsius was measured – a record low for July, according to Weerplaza.”
The cold has now gripped northern Europe for about a week now, as the mornings of July 3 and 4 saw “at times widespread surface frost in Germany” as well.
Surface frost over northern Germany on July 4th. Source: Wetteronline.de
Europe cold summer to persist
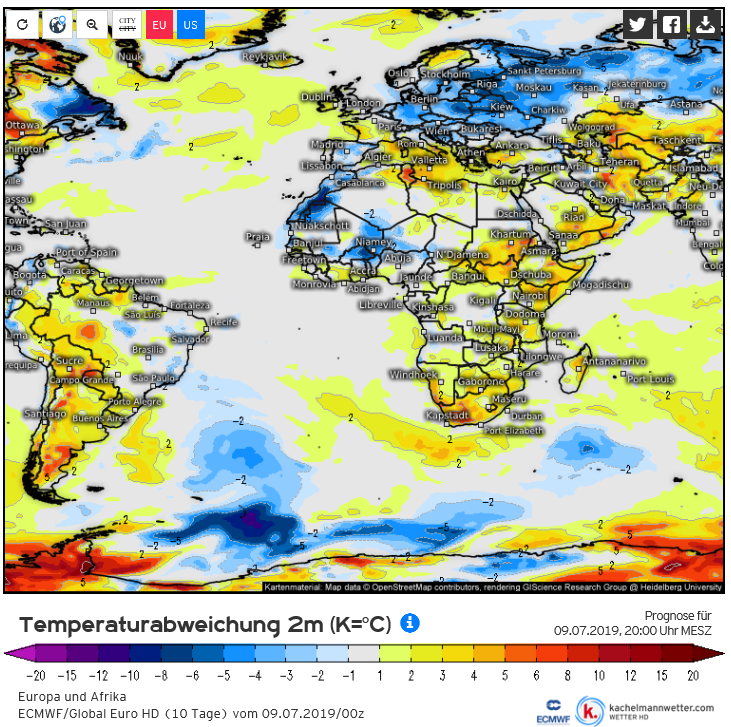
The cold is not expected to subside anytime soon. A recent GFS forecast shows it will likely persist across Northern Europe and most of northern Russia for another 10 days.
So don’t expect to see any global warming ambulance chasers to be found there. They were last sighted in Alaska, and may soon be headed to Iran or the “stans”.
Source: Kachelmannwetter.com.
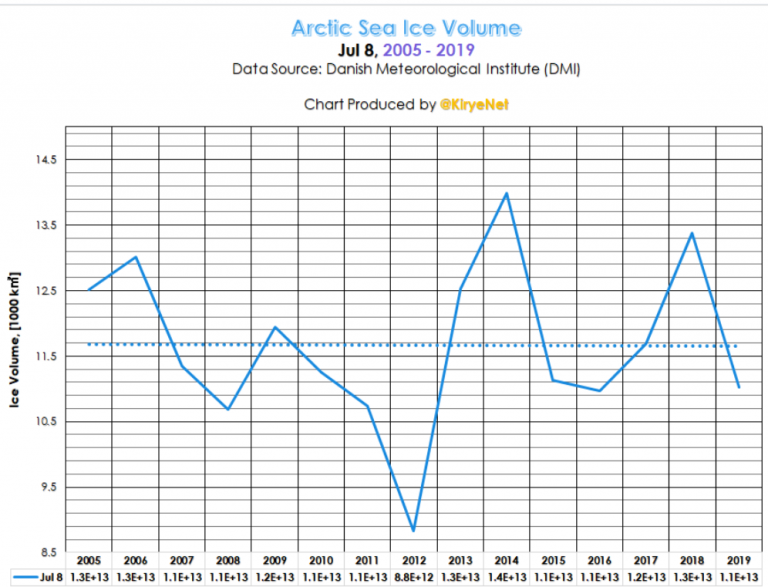
Early July Arctic ice volume on the rise!
Also early July Arctic sea ice has refused to melt further for 15 years now.
Chart by Kirye. Data source: DMI.
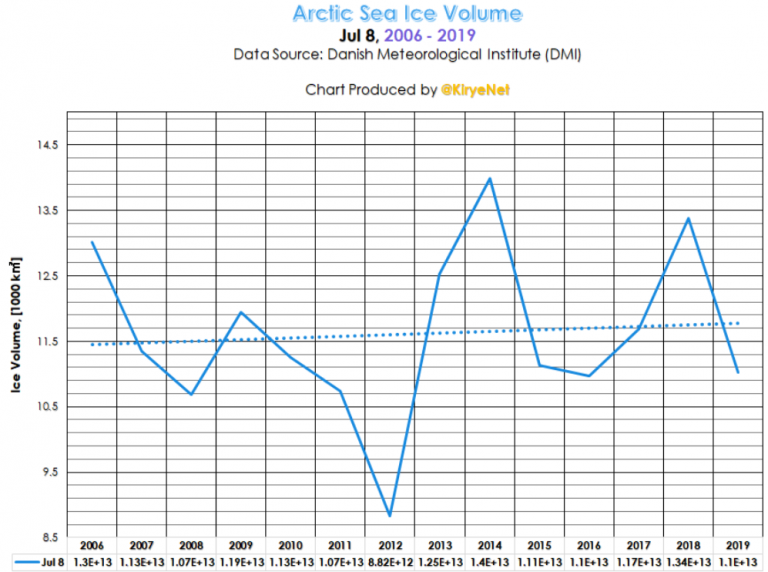
Japanese climate blogger Kirye plotted the data back to 2006, and we see an upward trend for July 8 Arctic sea ice volume:
Chart by Kirye. Data source: DMI.
Growing ice over past 10 years
The rising trend becomes even pronounced when we look at the last 10 years. This ice cold reality flies in the face of all the wild claims of a melting Arctic we often hear in the media.


Low temps ruin summer vacations and slow gardens to a crawl.
Below about 13°C some things will not set fruit.
Lots of folks will take note of this cold weather.
Thanks for the report.
Does it not occur to you that the unusually cold weather in a part of Europe, while other parts are extra hot, is itself a sign of instability brought on by climate change from man made action such as Deforestation and adding 39GT of CO2 to the system each year, which is causing weakening and distortion of the border between the polar and temperate zones? Only in the past few days France has had a warm spell likely 4 C warmer than comparable spells 100 years back, and which are five times more likely to occur.
Nope.
Paranoid hysterical fantasies aren’t my thing.
PS – it’s called “weather.” Happened before, and it’ll happen again.
Wasn’t there are meta study that showed how quickly people adjust to changing climates and judge weather as normal that wasn’t normal not long ago. It looks like Yonason is a victim of that effect (plus a bit of dunning-kruger of course).
Wasn’t there a study comparing AGW skeptics to moon landing “deniers?”
https://journals.sagepub.com/doi/abs/10.1177/0956797612457686
You know, “deniers” like these skeptics!
http://www.populartechnology.net/2010/06/nasa-astronauts-skeptical-of-man-made.html
Point – just because a warmist activist says something, doesn’t mean it isn’t true, …but yeah, it is a pretty safe bet that it probably isn’t.
What a weird reply, Yonason. A paper that says (Moon) conspiracy theorists are more likely to also be climate deniers/skeptics followed by an article with quotes from people who surely aren’t Moon conspiracy theorists, but still apparently climate skeptics.
And your point is something about “warmist activists”? Weird 😉
If anything this is generalization. So not only do conspiracy theorists more likely fall for the skeptics thing, even astronauts do.
Some observations on the Lewandowski loopiness – it’s as nutty as Cook’s “97% Consensus.”
And, yes, he is trying to paint AGW skeptics as the weirdos, by connecting them with obvious conspiracy theorists, despite SebH’s concrete thinking misinterpretation.
Here are two critiques of his paper, methods, and apparent intent.
“Understanding when people are and are not persuaded by science is an interesting and important area of research. But this curious case highlights the threat to scientific integrity that can stem from high moral missions. The notion that skeptics believed something so silly as the faking of the moon landing is yet another myth essentially concocted by the researchers.“
https://wattsupwiththat.com/2015/12/11/stephan-lewandowskys-moon-landing-paper-scathingly-criticized-by-team-of-psychologists-in-a-new-book/
Another link with useful information.
https://climateaudit.org/2012/09/08/lewandowsky-scam/
Note the date of the second critical link above is 09/2012, but the link I found to the Lewandowsky paper was from 03/2013. How could it be critiqued BEFORE it was published? Well, as I recall, Lewandowski had to rewrite it, because the original was un-accepted due to a lot of well deserved criticism. So, if the second isn’t as bad as the first, it’s not for the lack of wanting it to be.
Hypothesis – It’s the warmists who are the weirdos.
You should try, at least, to fact-check your claims :
1) No deforestation in Europe, it’s exactly the opposite since decades, and since weather events are local, there is no relation between weather events and deforestation :
https://www.planetoscope.com/forets/1218-croissance-de-la-foret-en-europe.html
2) And so much for the “unprecedented” heat wave event in France :
http://www.leparisien.fr/societe/en-1911-paris-suffoquait-deja-sous-la-canicule-29-06-2019-8106210.php
Why did you choose 10 years, why not show the whole trend since 1990? Are you afraid of what it shows.
Also I wanna see you post late September this year when sea ice hits record low. Your rising trend graph would look excellent at that time
@Pierre
I see you still haven’t fixed the the “contact” section to accept posts, so I’m putting this here,
Good video on the virtues of eating meat.
https://chiefio.wordpress.com/2019/07/06/eat-your-meat-heart-disease-in-paleo-farmers-and-egyptian-mummies/
More people are catching on!
I have a simple task for your Pierre. Download that ice volume data and calculate the trend for each day of the year for the last 10 years. Plot those 365 values and get an average. Do you think you will get a positive number (like you claim here = rising trend) or rather a negative number (= falling trend)?
If you do that you’ll find that the ice volume is indeed increasing between the middle of June and the end of August in those last 10 years. But it is decreasing on almost every other day of the year. The average over the whole year marks an ice volume loss.
Skeptics like to cherry pick, don’t you agree?
Seb: arctic sea ice extent and area have not been doing anything particularly spectacular for 10+ y (which you probably know). If you think there’s been some anomalous decline in arctic sea ice volume, please share it with us. Otherwise, get used to data not cooperating with pessimistic models and doomsday prognostications and enjoy the Holocene.
Kurt, this comment (and the blog post) was about ice volume, wasn’t it? But yeah, I know what skeptics think of the Arctic ice extent. They completely ignore that 2007/08 and 2012 are outliers. Reality is that the summer ice extent was pretty stable up on to the late 90s and then declined.
I know you mean the extent, but it’s not that difficult to actually read my comment above, right? Ice volume is declining, the data clearly shows this.
As for the extent:
http://woodfortrees.org/plot/nsidc-seaice-n/from:1980.6/every:12
Without those extremely low extent outliers it is an oscillation around a linear downward trend beginning in the late 90s. And you probably know it.
Again, the data does show it’s declining and yet Pierre and Kirye keep imagining that is not the case, by cherry picking from the data without looking at the whole set. A pretty common skeptic strategy.
The data is not cooperating with their version of reality.
@Kurt in Switzerland
While sea ice extent isn’t doing anything spectacular, neither is sea ice thickness. It seams that while thickness is below the avg, it’s still hugging the historical data (19 years worth) pretty closely, and possibly even increasing, though it’s hard to tell from that graph.
http://ocean.dmi.dk/arctic/icethickness/images/FullSize_CICE_combine_thick_SM_EN_20190711.png
I don’t see any impending catastrophic melting going on.
@Kurt in Switzerland
I’ve got their “anomalous decline” right here…
https://notalotofpeopleknowthat.files.wordpress.com/2018/09/image84.png
You just have to squint and tilt the paper the right way. //:o]
SOURCE:
https://notalotofpeopleknowthat.wordpress.com/2018/09/22/wadhams-wrong-again/
Ok, so you basically agree that Pierre is wrong by claiming
There is no rising trend. This claim flies in his face and no correction has been made 😉
“Ok, so you basically agree that Pierre is wrong…” – SebH
No.
Pierre is using DMI data, and Paul Homewood is using NSIDC. Both show a similar increase in ice extent from 2006 – 2018.
https://realclimatescience.com/2019/01/comparing-dmi-to-nsidc/
Bottom line, there appears to be an increase over the last decade. In any case, at the very least there isn’t any decrease. And that is essentially what Pierre’s article is saying.
Also, Pierre is plotting volume/extent while Homewood is plotting extent. But as I posted earlier, if one steps back and looks at the whole thing in context, it comes into better focus, IMO.
https://notrickszone.com/2019/07/09/ice-box-july-unusual-cold-surface-frost-sweep-across-central-europe-july-arctic-ice-volume-trend-now-increasing/comment-page-1/#comment-1301513
“Pierre is plotting volume/extent…” should have read “Pierre is plotting volume/thickness…”
Speaking of “cherry picking,” I wonder why warmists don’t like to reference arctic conditions prior to 1979.
Warmists are such scoundrels.
https://m.youtube.com/watch?v=RFsK_9JWbHs&feature=youtu.be
Are you trying to compare using only reliable satellite data with picking out the only dates in generally declining data that show an increase? Cute 😉
That’s the same as starting “hiatus” graphs or the Arctic ice extent in certain years to show whatever you want to show when every other starting point would show the exact opposite.
To help you identify what’s wrong with most climate contrarians papers and the seemingly contradicting science, there is a new paper analysing a few of your favorite papers 😉
https://www.theguardian.com/environment/climate-consensus-97-per-cent/2015/aug/25/heres-what-happens-when-you-try-to-replicate-climate-contrarian-papers
Maybe you’ll learn a few things about yourself.
The troll wants me to learn from the grauniad‘s warmist activist propagandist Dana Nuccitelli?
http://www.populartechnology.net/2013/07/dana-nuccitellis-paycheck-funded-by.html
hahahahaha – good one. tell me another.
See here for more on Nuccitelli and his pals.
http://www.populartechnology.net/2012/03/truth-about-skeptical-science.html
(Photo he posted of how he sees himself is in “update 2” there.)
With Lewandowsky, Cook and Nuccitelli as SebH’s sources of information, it’s no wonder he’s always wrong.
You’ve got to be kidding us, right? You are still hardcore into those beliefs, aren’t you? No substance, just ad homs and desperately trying to call everyone a troll? 😉
RE – SebH falsely accuses me of ad homs.
It is not an “ad hom” to point out that someone (Nuccitelli) who photoshops himself as a Nazi, has no high ground when it comes to accusing me of being a “denier.” (Nor has SebH, for that matter, by his support for Nuccitelli.)
It is not “ad hom” to criticize someone who falsely accuses skeptics of taking money from “big oil” when he (Nuccitelli) does himself.
It’s not “ad hom” to call someone a liar, who through his participation in a fraudulent study really is.
https://climatechangedispatch.com/97-articles-refuting-the-97-consensus/
SebH, John Cook and Dana Nuccitelli are the ones with no substance, only false accusations of others who don’t agree with them.
Remember, activists have no scruples. It is NOT an “ad hom” to say that if it is true, and directly related to his trustworthiness.
http://theclimatescepticsparty.blogspot.com/2015/07/crook-cooks-identity-fraud.html
Anyway, if the “97% Consensus” is a lie…
https://www.c3headlines.com/2014/09/why-do-97-of-climate-scientists-agree-that-co2-is-not-a-climate-control-knob.html
…why do you suppose Nuccitelli keeps pushing it?
HINT – He is NOT an honest person (or not very bright, or both).
After having pointed this out to SebH on numerous previous occasions, I would have expected him to have learned it by now.
I suggest you look up the definition of the ad hominem attack again.
Learn from a troll? Yeah right … you are stubborn as hell, that I give you. But it’s always ridiculous to converse with you with your fake arguments and conspiracy sources 😉
ALSO – Using only recent satellite data means rejecting the data we have prior to 1979.
https://realclimatescience.com/2015/09/starting-graphs-in-1979-world-class-fraud/
https://realclimatescience.com/2018/04/arctic-sea-ice-unchanged-from-60-years-ago/
If you reject the good data we have for the past just because it contradicts the fable you want people to believe, you are not an honest person.
Not at all and you’ve got to stop celebrating that Tony Heller figure as your personal savior in all things climate.
Speaking of being honest. Good data from the past:
http://research.bpcrc.osu.edu/geo/publications/polyak_etal_seaice_QSR_10.pdf (History of sea ice in the Arctic, Polyak et al 2009)
Have fun reading it and then ignoring it (probably)
” you’ve got to stop celebrating that Tony Heller figure as your personal savior in all things climate. – SebH
Show me where he’s wrong and I’ll stop referencing him. (SPOILER ALERT – your attempt here has failed.)
“…personal savior…” – writes SebH, the AGW zealot.
hahahahahaha – too funny.
“Speaking of being honest.” – SebH
Yes, lets do. Interesting paper that. If you examine it carefully, you will see that proxy data plotted in fig.12 in black supports Tony Heller. It shows that the max ice extent in the 1930’s is just as low as 2000. It rose from 1930’s into the 1970’s (when time begins for warmists), then fell again to 2000, quite consistent with what Heller writes.
The Red curve, however, contradicts. It is therefore important to see what the author referenced there has to say.
OK, here it is…
https://www.researchgate.net/publication/251439347_Stratigraphic_analysis_of_an_ice_core_from_the_Prince_of_Wales_Icefield_Ellesmere_Island_Arctic_Canada_using_digital_image_analysis_High-resolution_density_past_summer_warmth_reconstruction_and_melt_e
ABSTRACT:
In other words, it is not a reflection of the Arctic as a whole, but of a unique area with it’s own climate.
Now from the paper…
LAST PARAGRAPH OF CONCLUSIONS (my emphasis):
So, the red curve has nothing to do with CO2. The ice extent there is site specific, and dependent on local geographical conditions. No mention of CO2 or CARBON in that paper. That spin was imposed upon it by the author of the paper SebH posted.
I would be very interested if Kenneth Richard would weigh in on this, as I’m sure he will be able to do a much better disection than my superficial treatment.
While waiting for my response to the troll to come out of moderation…
https://notrickszone.com/2019/07/09/ice-box-july-unusual-cold-surface-frost-sweep-across-central-europe-july-arctic-ice-volume-trend-now-increasing/comment-page-1/#comment-1301496
…I’ll just post a couple of items from Ron Clutz and WUWT re the great Arctic melt-down that ain’t.
Ron shows how warmists distort the facts to make things look worse than they are.
https://rclutz.wordpress.com/2015/10/04/ice-house-of-mirrors/
WUWT does the same, though from a slightly different perspective.
https://wattsupwiththat.com/2018/09/24/analysis-suggests-arctic-sea-ice-is-more-stable-than-thought/
Oh please, this guy is constantly shown to be wrong. Last time I know of was the France heat wave where he pulled some fake old newspaper articles out of somewhere to claim it was even hotter in the past in France.
Please point these kind of things out next time Kenneth posts something about the Arctic (or you). It’s all site specific data before the satellite age. Why? Because that’s what we have before that. What do you think you guys are doing when you refer to an Arctic with more ice by pointing out that there was more ice at the northern coast of Ireland?
That’s basically my whole point. No reliable, “global” data before the satellite age means we can not be certain of what was going on there. But we are pretty much certain of what is going on nowaways (e.g. in the last decades)
And that my friend is what I tried to show in that first comment up there. Ice volume is actually declining despite Pierre claiming the contrary.
I don’t know why you are trying to defend this. It’s a faulty claim, it should be corrected.
P.S.: Why would CO2 need to be mentioned in a paper about ice extent?
Typical useless monkeydance and deflection. SebH hasn’t factually addressed any of the most important points I made, especially Polyak’s data in his figure 12, showing warming in the 30’s, cooling in the 70’s, and recent warming up to 2000. This is what Heller shows with the data he uses, and yet SebH says Heller has been shown to be wrong about that. He hasn’t. So SebH blathers on vaguely about generalities, instead of dealing with the data he himself has provided.
Interestingly, that cold 70’s ice peak, common to both Polyak’s and Hellers material, is what the warmists have erased with their data “adjustments.” Odd, isn’t it, that Heller’s and Polyak’s data agree, yet SebH insists Heller is wrong, and the warmists who deleted the “blip” are right?
As usual, SebH is a waste of time.
Yonason, conversing with you is really aggravating. Anyway, re-read what Polyak writes:
And further
So the black line in figure 12 is a highly localized reconstruction and the red curve is Arctic wide. Do you want to know why you got the wrong impression? Because you looked at the wrong paper. This is the Kinnard 2008 paper Polyak is referring to:
https://agupubs.onlinelibrary.wiley.com/doi/full/10.1029/2007GL032507
I hope you see clearer now and stop being a waste of time yourself by imagining stuff up.
Well, it seems I had the wrong paper. Score a technical for SebH.
He’s still wrong about Heller (as I’ve shown in the past as testified to by L. Motl and J. Curry), about the 97percenters, CO2, and basically everything else.
But credit where it’s due.
The tack I should have taken, had I not been rushing, would have been to see if anyone had looked at Kinnard’s work with a skeptic’s eye. If I had, I would have found this…
https://climateaudit.org/2011/12/05/kinnard-arctic-o18-series/
It deals with Kinnard’s work in 2011, which being more recent than 2008 will presumably be more complete.
While McIntyre doesn’t conclude there’s definitely anything wrong, he does identify several red flags. Hopefully there’ll be further analysis…checking…only his one post from 2 days previously. Also, nothing definitive, but also with some concerns.
https://climateaudit.org/2011/12/03/kinnard-and-the-darrigo-wilson-chronologies/
Oh, wait. I see where SebH got that Kinnard paper. David Appell was using it to try to bludgeon Kenneth Richard with back in 2016, here.
https://notrickszone.com/2016/11/28/there-has-been-no-significant-net-change-in-arctic-sea-ice-extent-in-the-last-80-years/#comment-1152131
Kenneth Richard’s responses to Appell’s comments are, as ever, enlightening. I particularly like this long view, as it were…
https://notrickszone.com/wp-content/uploads/2016/11/NTZ-Arctic-Sea-Ice-Late-Holocene-Human-Influence-768×261.jpg
Nothing to see there, really, except cyclical variation with very constant amplitude. Thank you, Kenneth.
So, as usual, SebH goes for a “gotchq” and only “missed it by THAT much.” (apologies to Don Adams)
https://www.youtube.com/watch?v=oPwrodxghrw
FINAL comment on Polyak. Even if his and Kinnard’s work were free of problems, his assertion that not only elevated CO2 is the cause of reduced sea ice, but human additions of CO2 are the primary culprit, are nothing but speculations. The do not stand on their own, nor are they proven by Polyak’s paper. It’s a claim in the category of “everybody knows that,” but no one knows of any work that categorically quantitatively substantiates it.
Weather is not climate. July 2019 was the warmest on record for global average. Please stop this shit its really stupid and you look ridiculous touting this nonsense. Stop showing cherry picked data. The climate alarmists are being proven right all along. Please read ipcc 1.5 deg report or 4th national assessment for the truth.
You are an ambulance chaser too.
Your complaint is silly and hypocritical as the Media is, since after screaming about a short heat wave, they go silent on the cold wave in a lot of the same areas, some of it a RECORD cold.
Warmists have become chasers for a hot day, the ultimate cherrypicking activity.
@Andy Cass
What part of “the IPCC are liars” don’t you understand, Andy?
https://www.climatedepot.com/2017/05/24/global-warming-is-not-about-the-science-un-admits-climate-change-policy-is-about-how-we-redistribute-the-worlds-wealth/
You want us to trust them? Seriously?
https://nofrakkingconsensus.com/2018/10/24/ipcc-where-dictators-overrule-scientists/
[…] Ice Box July: Unusual Cold, Surface Frost Sweep Across Central Europe! July Arctic Ice Volume Trend … […]
Another excellent post, Pierre, thank you.
The truth will out …
https://www.researchgate.net/publication/332245803_27_bullet_points_prove_global_warming_by_the_sun_not_CO2_by_a_GEOLOGIST_for_a_change
People, and especially the IPCC, should study geology.
I posted the Canadian government data on Twitter regarding a recent 21x increase in Northwest Passage sea ice.
All Northwest Passage cruises were cancelled in 2018 due to the increase.
https://twitter.com/SaferStone/status/1132780192890404865?s=19
@Dr Roger H
Some good ideas there, but I disagree about gas/deasel powered vehicles. Effective transportation is essential to modern civilization, and until we have an at least equally effective alternative, it would be folly to abandon what now works so well, especially since pollution from them has been so effectively minimized as to be virtually non-existent.
That’s why it’s called ‘Climate Change’ not global warming. Duh.
M. Simpson,
It’s called any darn thing that the idiots want to call it. It really doesn’t matter as there is NO evidence that it (climate changing due to increasing atmospheric CO2) is happening but it is more likely to happen (to the benefit of all nature) as the planet greens-up and the plants mediate the local weather.
So far the rise of about 1°C in the last 200 years (approximately) is well within normal natural variation. In the 200 years there is no evidence of unnatural weather variation. If you don’t believe this just go a read some weather history of the last 200 years, then judge current weather events to past weather events.
Human mediated climate change is insignificant compared to what nature can, and does, do.
BLAST FROM THE PAST
Be afraid. Be very afraid!
Not.
https://wattsupwiththat.com/2014/07/06/lying-with-statistics-the-national-climate-assessment-falsely-hypes-ice-loss-in-greenland-and-antarctica/
Kind of puts all that melting in perspective.