Charts by Kirye
Text by Pierre
The October, 2021 mean temperature data are in for Tokyo and its Hachijojima island out in the Pacific – no warming in 30 years!
All the private jet-flying climate doomsday loonies now meeting in Glasgow would all like to have us believe everything is getting hotter and the planet is about to blow up, and so us taxpayers need to use only 1/1000 instead of 1/100 the energy they guzzle as they practice their gross policy incompetence.
They also want us to cough up a lot more tax dollars for their nutty schemes. We really ought to be getting a much better deal for the trillions in tax dollars we’re paying annually. The job performance of our leaders has been crap since the Iron Curtain fell, we could easily and convincingly argue.
They’re supposed to be serving us, and not trying to put us in servitude. The claim they’re trying to serve us? It’s bullshit.
Tokyo
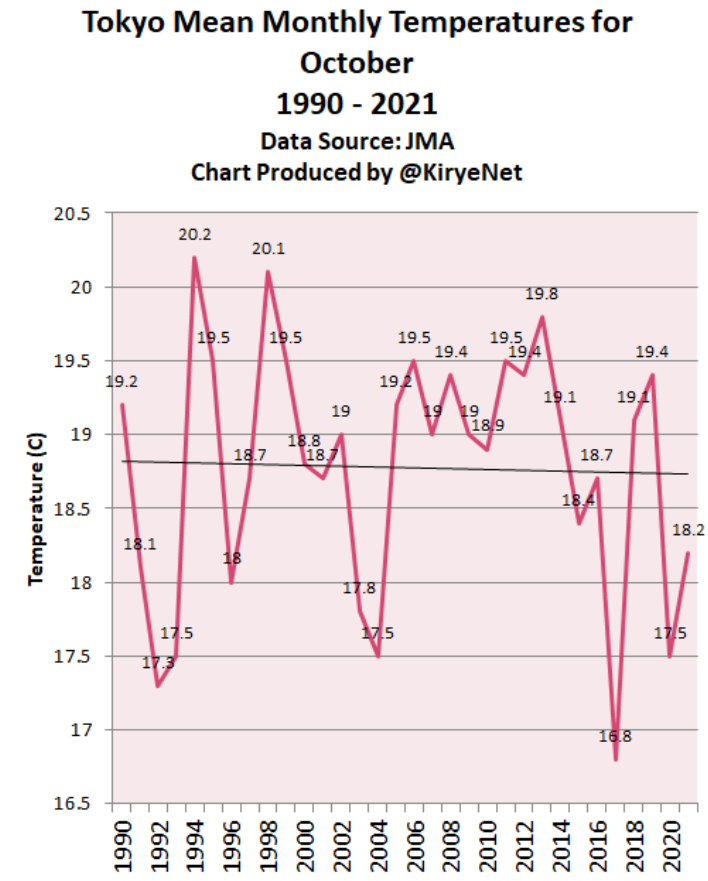
Here’s the latest plot of October mean temperatures for Tokyo since 1990.
Data: JMA.
Over the past 30 years, October temperature in Tokyo has been declining moderately. Not even the city’s massive urban heat island effect is able to keep autumn from starting earlier than previously.
Hachijojima
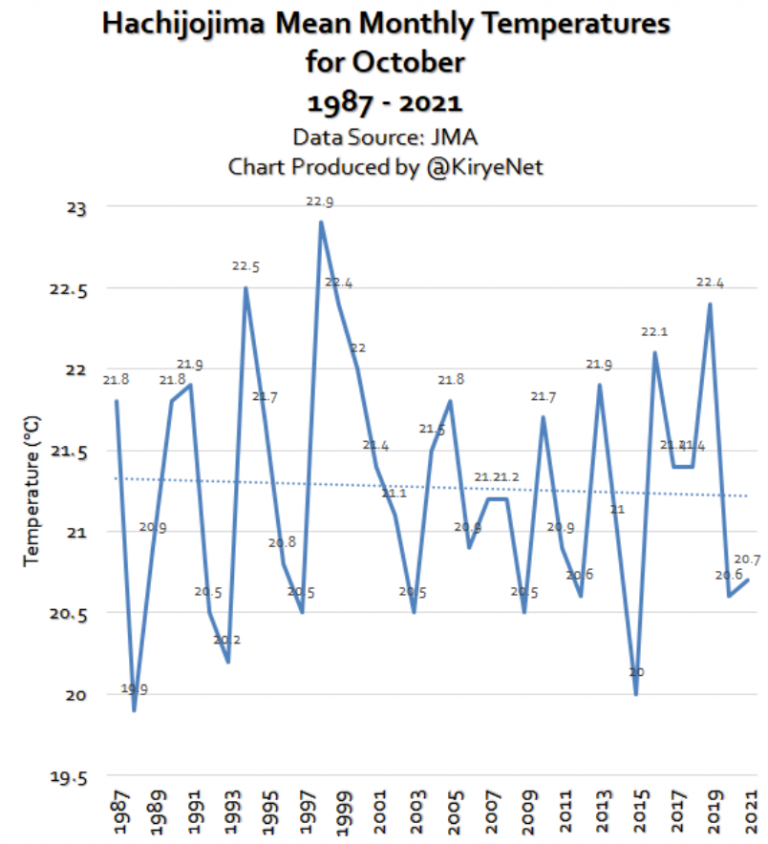
Moving away from the urban heat island of Tokyo and over to the relatively rural Pacific island of Hachijojima, some 275 km off the Japan mainland, we plot the latest October data going back to 1987:
Data: JMA
Here as well there has not been any warming for the month of October since 1987, according to the data from the Japan Meteorological Agency (JMA)
Sapporo
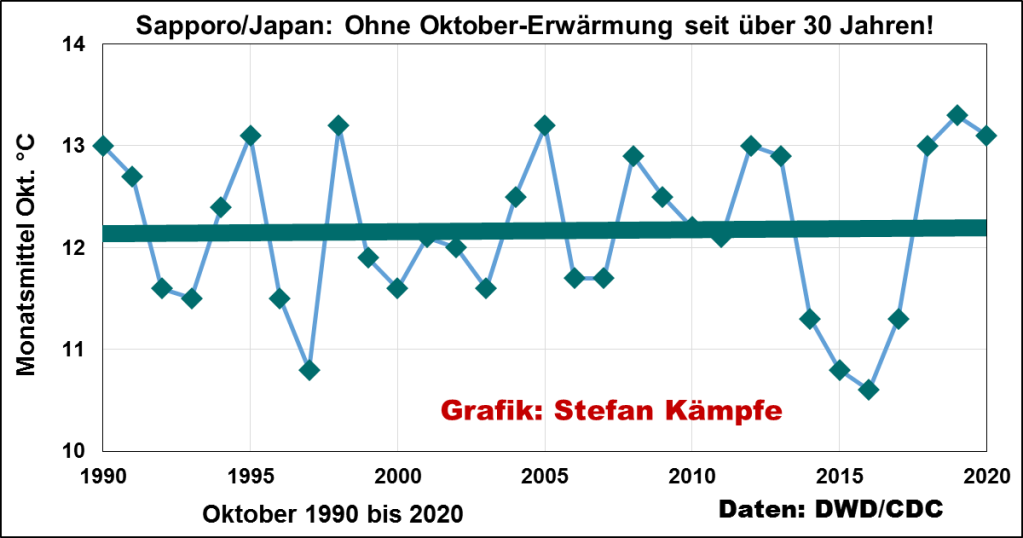
Over at the site of the European Institute for Climate and Energy (EIKE) in Germany, Stefan Kämpfe plotted the October data for Sapporo, Japan:
Data source: German DWD national weather service
Here we see there’s been no warming in October in 30 years. The data for October, 2021, are still pending.
Of course, there are many other places across the globe where the story is the same: Other than the usual natural variability, nothing unusual is happening climatically.


“Warming” and “Sapporo” do not go together.
Kudos to Kirye for yet another series of charts that refutes the popular opinion about changing temperatures.
I do have one concern about these types of graphs, although it especially applies to their use by catastrophists predicting the looming end of the world. My concern is about the fitting of linear trend lines to signals that are primarily periodic. Given that we know of many periodic variables that affect climate, and that even a cursory glance at plotted temperature records shows apparent periodic factors, would it not be more appropriate to first identify significant periodic components of a temperature series (using Fourier Analysis, for example), remove the prominent periodic signals from the data series, then analyse for trends in the residuum? Would that not give a more accurate indication of any potential man-made or other unidentified influences on long term temperature trends?
Time series not long enough for meaningful Fourier analysis. Linear fit is fine, any periodic signal approximates linear over a short enough time frame
[…] Related: @COP 26: Tokyo Hasn’t Seen Any Warming In October In 30 Years…No October Warming In Sapporo Eith… […]