Charts by Kirye
Text by Pierre
The November and fall, 2021, untampered mean temperature data are in for Tokyo and its Hachijojima island – no warming in decades!
Tokyo
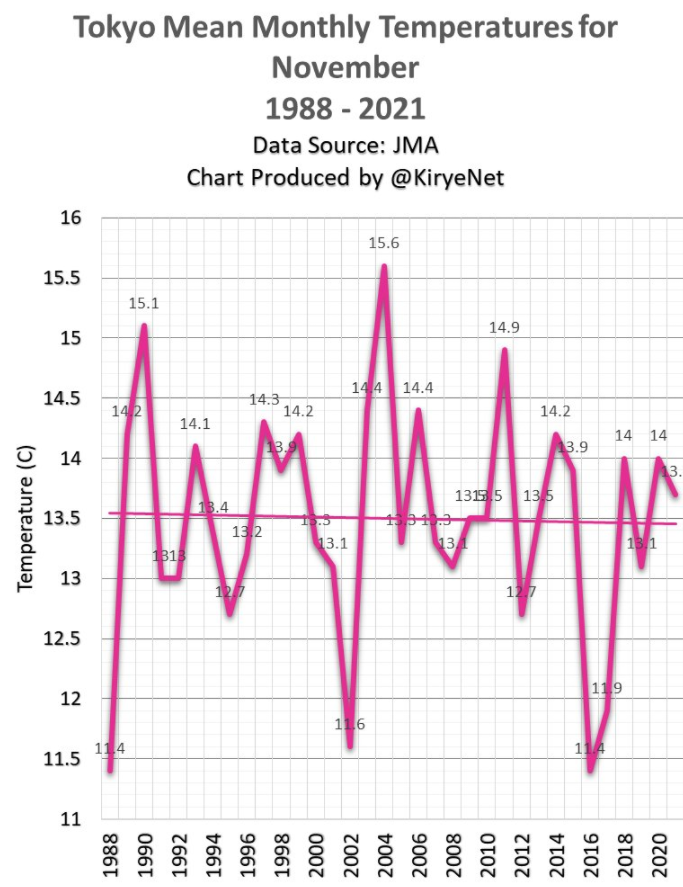
Here’s the latest plot of November mean temperatures for Tokyo since 1988:
Data: JMA.
Over the past 33 years, November mean temperatures in Tokyo have been declining slightly, though not significantly. At any rate, there’s been no warming!
Autumn in Tokyo
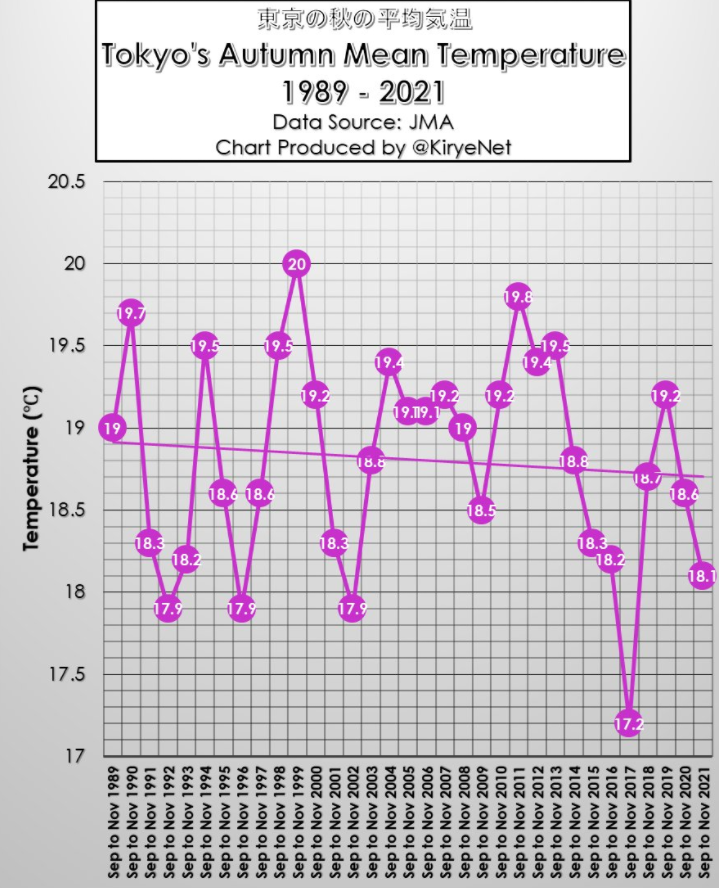
Next we look at the meteorological fall for Tokyo. Climate alarmism would have us believe that fall is getting warmer and thus squeezing out winter.
Data: JMA
But that’s not the case. To the contrary, it appears as if winter is squeezing out fall a bit. Fall in Tokyo has been cooling since 1989!
Hachijojima
Moving away from the urban heat island of Tokyo and over to the rural Pacific island of Hachijojima, some 275 km off the Japan mainland, we plot the latest November data going back to 1947:
Data: JMA
There’s been no warming in November on this rural island in almost 75 years!
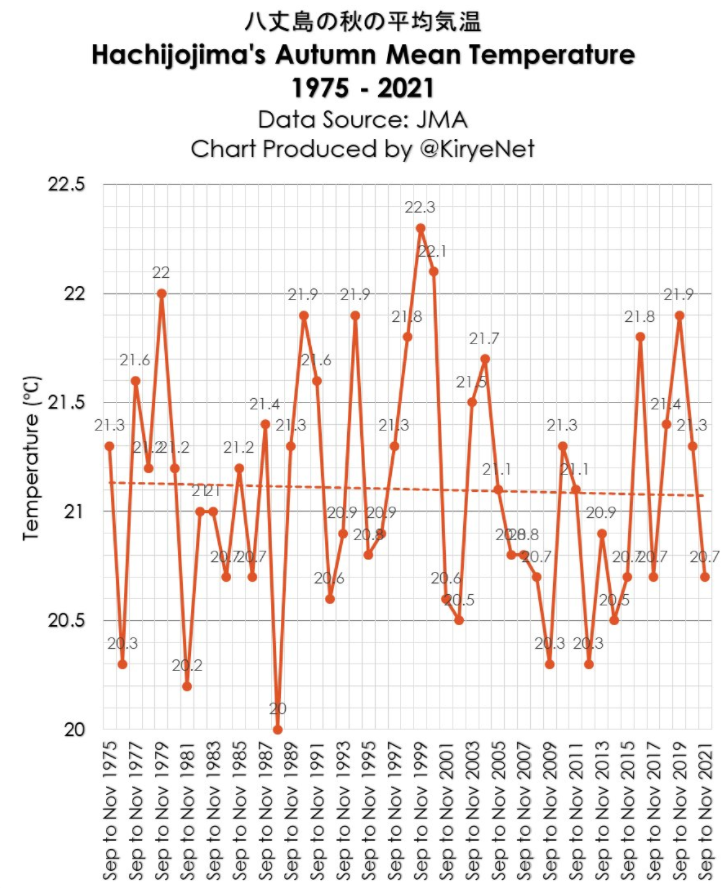
Next we look at autumn mean temperatures at Hachijojima:
Data: JMA
Here as well there has not been any warming in fall since 1975, according to the data from the Japan Meteorological Agency (JMA).
This is the story at many other places across the globe. Other than the usual natural variability, nothing unusual is happening climatically. Even if it was warming, that’s natural too. It wouldn’t mean man is behind it.
Don’t believe for once all the climate crisis nonsense. They only want you to be afraid so that they can control you. It’s all fraud.


Kirye, small point of order. For statistical reasons, I don’t think that a trend line created from a linear regression of the data (a method which is now overused unfortunately) carries much meaning. Also, as the second graph in particular seems to indicate, one very low (or high) outlier data point can drive the entire slope produced by a linear regression
The standard deviations are much bigger than the trend lines – can tell that by inspection without computing them for the moment (in Seattle right now on the way home today). These graphs seem to indeed show only natural variability occurring – that is, there is no trend, just statistical noise.
In your own words. There is no trend. Yhisnis what Kirye is saying.
So glad you are in agreement.
This is outrageous! Why isn’t the JMA supressing the raw data? They are letting the side down. We have to keep repeating that the planet is warming up rapidly and dangerously. Ignore those facts.
“It’s all fraud” is not quite correct.
The public facing term is “climate change” (global warming, climate crisis, etc.).
The underlying hidden intent is “control” (radical change, replacement of free markets, etc.).
So, rather than say, “It’s all fraud” (such as a Ponzi scheme), it should be more correctly stated as, “it’s all a ruse”.
Dear Larry, a ruse is the trick; a fraud is the mechanism to get there.
What makes this even more convincing is that the Urban Heat Island Effect should have resulted in some warming, so the cooling is most likely even more pronounced.
[…] Related: Climate Crisis AWOL: Untampered Japan Meteorological Agency Data Show No Warming In Tokyo In Decades… […]