See full report at Dr. Roy Spencer
As a follow-on to our paper submitted on a new method for calculating the multi-station average urban heat island (UHI) effect on air temperature, I’ve extended that initial U.S.-based study of summertime UHI effects to global land areas in all seasons and produced a global gridded dataset, currently covering the period 1800 to 2023 (every 10 years from 1800 to 1950, then yearly after 1950).
It is based upon over 13 million station-pair measurements of inter-station differences in GHCN station temperatures and population density over the period 1880-2023.
Since UHI effects on air temperature are mostly at night, the results I get using Tavg will overestimate the UHI effect on daily high temperatures and underestimate the effect on daily low temperatures.
As an example of what one can do with the data, here is a global plot of the difference in July UHI warming between 1800 and 2023, where I have averaged the 1/12 deg spatial resolution data to 1/2 deg resolution for ease of plotting in Excel (I do not have a GIS system):
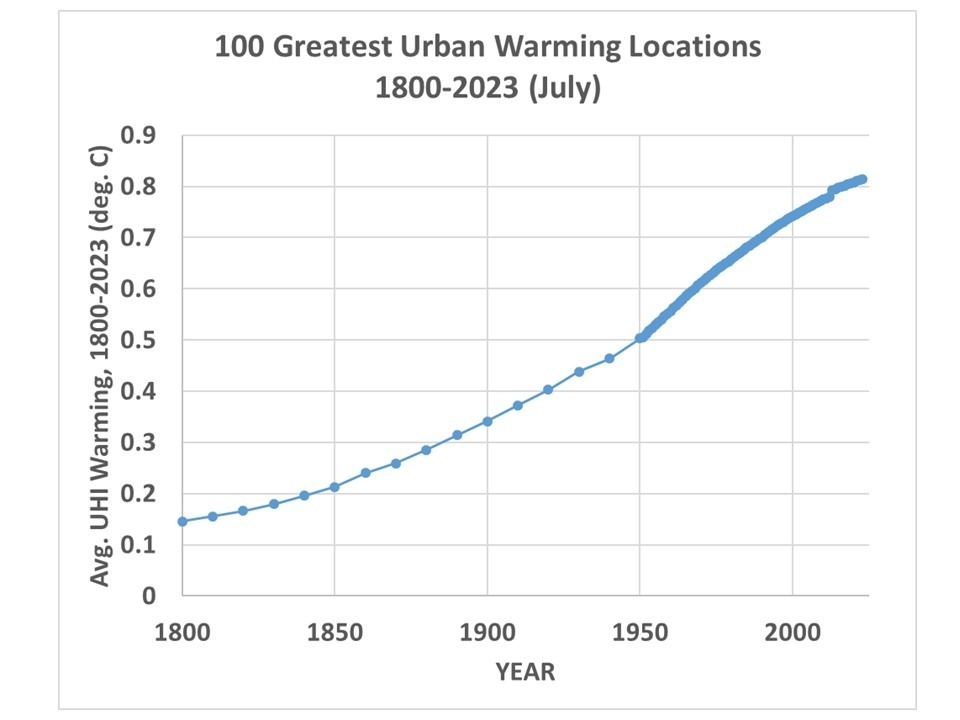
If I take the 100 locations with the largest amount of UHI warming between 1800 and 2023 and average their UHI temperatures together, I get the following:
Note that by 1800 there was 0.15 deg. C of average warming across these 100 cities since some of them are very old and already had large population densities by 1800. Also, these 100 “locations” are after averaging 1/12 deg. to 1/2 degree resolution, so each location is an average of 36 original resolution gridpoints. My point is that these are *large* heavily-urbanized locations, and the temperature signals would be stronger if I had used the 100 greatest UHI locations at original resolution.
Read entire article at Dr. Roy Spencer.


Recent Comments