==============================
How Much Global Warming?
By Ed Caryl
We are told over and over again that the globe has warmed by 0.8°C since 1880 or 1850. Lately we have seen article after paper after publication that states this number in Fahrenheit, 1.44°F, because that sounds larger. But is this number correct? What is it based on?
GISS and Google “way-back machine”
Recently, a file from GISS in Google’s “way-back” machine came to my attention. This file of global temperature dates from 1999, before James Hansen became more rabid in promoting global warming. Here is a plot of the 1999 data, along with the current file from GISS:
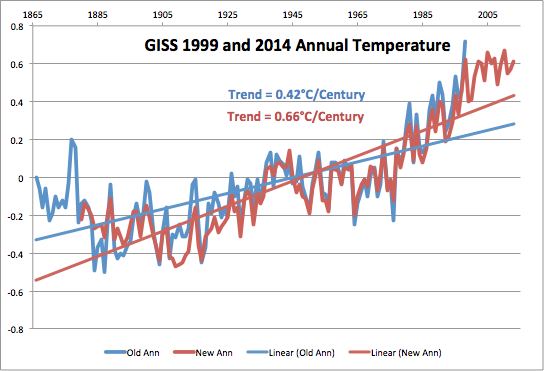
Figure 1 is a plot of global temperature as published by GISS is 1999 versus the current publication.
Note that GISS has removed the data from 1866 to 1880, placing the beginning of their published data closer to the bottom of the early 1900s cool period. This changes the trend from 0.42°C per century to 0.66°C per century, a 50+% increase in the trend. This alone changes the warming from 0.6°C from 1866 to the present, to 0.8°C from 1880 to the present, resulting in the higher trend. Here is a chart of the difference between the two files.
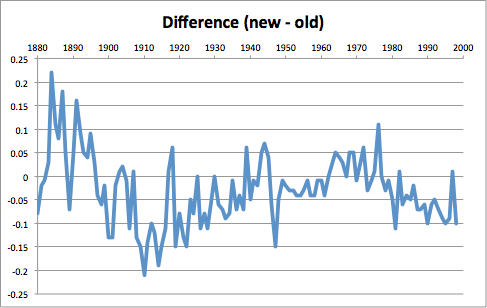
Figure 2 is a plot of the difference between the two plots in Figure 1.
In Figure 2 we can see that the cool period around 1910 was cooled further by 0.2 degrees, but the cool period around 1970 was warmed slightly. They also minimized the cool 1880s and ’90s by warming those years by 0.1 to 0.2°C. So what was the real global temperature from 1866 to the present? I took the 1999 file and spliced on the satellite data from UAH from 1979 to the present, using the period of overlap from 1979 to 1999 as a baseline, avoiding the recent GISS adjustments. The result is this: 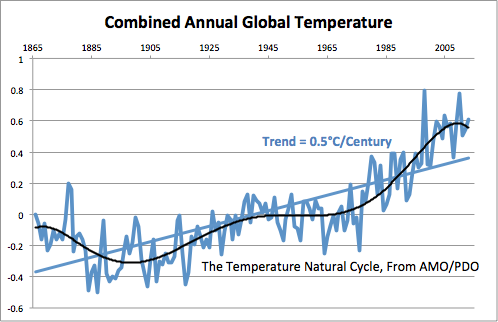
Figure 3 is a plot of GISS global temperature from 1999 with UAH satellite TLT global temperature spliced on from 1979.
The trend in Figure 3 is half a degree C per century, with a total rise since 1866 of about 0.6°C. Because of the year-to-year variation, and the sparse station data in the early years, both the trend and the total rise have errors that are in the neighborhood of ±0.3°C. So the bottom line is that the warming since the mid-19th century is about 0.6°C ±0.3°C, or somewhere between 0.3°C and 0.9°C. Much of that warming, about 0.4°C ±0.2°C has taken place since 1980. But some of that is due to the cyclic nature of temperature.
The cycle from 1866 to 1940 had an amplitude of about 0.3°C, which, if extended to the present, means that the present temperature is at the peak of a cycle, or 0.15°C too high. This puts the total rise between 0.15°C and 0.75°C, or from almost nothing to something less than has been stated, with a center at 0.45°C. The recent solar maximum has also inflated the temperature. In the next 30 years, decreasing ocean cyclic temperature and a waning solar input will likely reduce the global temperature by about 0.4°C ±0.2°C, either back to the 1990s or to the 1960s. If the latter, there will have been no warming in the last 160 years.


While ever you can produce no explanation for the net inflow of thermal energy required to raise the temperature of the Venus surface by 5 degrees during its sunlit hours (as per Hans Jelbring’s paper) then you have no understanding of planetary atmospheric and surface temperatures and the complete picture of all energy flows. I have explained what physics tells us in my book “Why It’s Not Carbon Dioxide After All.” You have not.
When I first started started looking at the issue of “global warming”, I was struck by a number of anomalies. First, was the efforts by proponents of AGW to cool the past, be it the most recent past through so-called “administrative” changes but also cool the well-recorded historical periods such as the Medieval Warm Period, the Roman Warm Period, the Minoan Warm Period and the Holocene Optimum. The second was the fervor with which they asserted how models both described the past and predicted the future. Yet every time we look at the real, raw data, skeptics ask the same question over and over again: What warming? We have been cooling for the past 7,000 years at a rate of .25 C per thousand years. This so-called warming is a mere blip in the grand scheme of things. Thank you for your research.
Pierre, please check your spam filter. I posted a comment yesterday and it hasn’t appeared yet.
Cheers
Sorry it hasn’t appeared – pls post again if it’s not too much trouble. Will make sure it gets approved.
It’s lost in the ozone again, Pierre. Your blog apparently doesn’t like GISS links. I emailed you my comment.
Cheers
Hi Ed and Pierre, many thanks for the link to the archived GISS data from 1999.
It looks like the 1999 GISS data from the archive is the dTs version, which is the dataset where GISS takes land-based data and extends it out over the oceans (no sea surface temperature data). That was based on the paper Hansen and Lebedeff (1987) “Global trends of measured surface air temperature”. See:
http://pubs.giss.nasa.gov/docs/1987/1987_Hansen_Lebedeff_1.pdf
They presented the 1987 version of that data in the paper. See their Table 1.
GISS still updates that dataset. Notice that they use the same nomenclature in the header as in the archive you linked:
http://data.giss.nasa.gov/gistemp/tabledata_v3/GLB.Ts.txt
The current GISS dTs data are accessible from their webpage here (under the heading of Means Based on Land-Surface Air Temperature Anomalies Only (Meteorological Station Data, dTs):
http://data.giss.nasa.gov/gistemp/
The current data that you presented in your post is their Land-Ocean Temperature Index, which includes sea surface temperature data. So you’re comparing apples and oranges. Your Figure 2 tipped me off to that. That curve is the difference between the GISS land-only dataset and their land+ocean dataset.
Rest assured, the current dTs data does have a noticeably higher warming rate than the 1999 version, a little more than 25% higher.
https://bobtisdale.files.wordpress.com/2014/10/giss-dts-1999-v-2014-versions.png
Thanks Bob.
The current land only data is not only higher, but it is also truncated at 1880. The total effect is to make the current trend about twice that of the old data, 0.87°C per century as opposed to 0.42° per century.