By Kenneth Richard on 12. January 2017
“It is generally accepted that the climate warms during periods of strong solar activity (e.g., the Medieval Warm Period) and cools during periods of low solar activity (e.g., the Little Ice Age).” — Lyu et al., 2016
Scientists are increasingly tuning out the claims that the Earth’s temperatures are predominantly shaped by anthropogenic CO2 emissions, or that future climate is destined to be alarmingly warm primarily due to the rise in trace atmospheric gases. Instead, solar scientists are continuing to advance our understanding of solar activity and its effect on the Earth system, and their results are progressively suggestive of robust correlations between solar variability and climate changes.
For example, in 2016 alone, there were at least 132 peer-reviewed scientific papers documenting a significant solar influence on climate. Among them there were 18 papers that directly connected centennial-scale periods of low solar activity (the Little Ice Age) with cooler climates, and periods of high solar activity (the Medieval Warm Period and the Modern Warm Period [20th Century]) with high solar activity levels. Another 10 papers warned of an impending solar minimum and concomitant cooling period in the coming decades.
And this trend of scientists linking climate changes to solar forcing mechanisms — and bypassing an anthropogenic explanation — continues to rage on in 2017.
A Seminal New Paper Unveils The ‘Cause Of Causes’ Of Climate Change
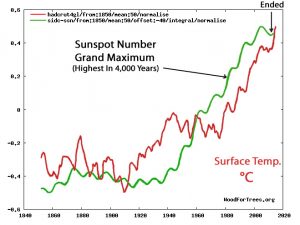
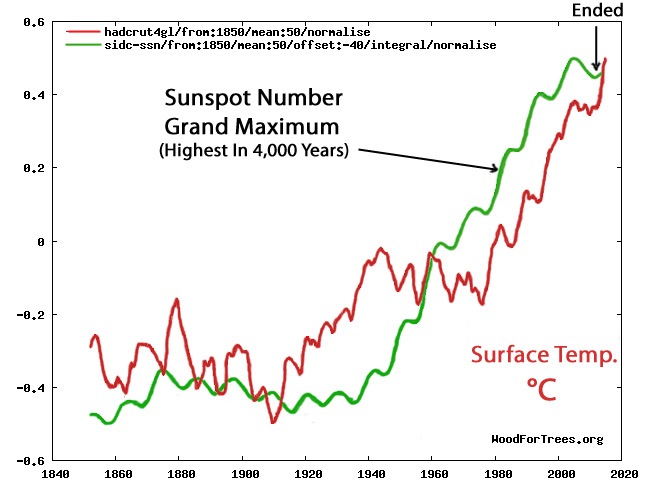
In their groundbreaking New Astronomy paper, Norwegian professors Harald Yndestad and Jan-Erik Solheim indicate that the modern (1940-2015) Grand Maximum of very high solar activity — the highest solar activity levels in 4,000 years — has just ended. Within 10 years, or by 2025, these scientists project the next solar minimum period (which will be similar in character to the late 18th Century’s Dalton Minimum) will exert its cooling effect on the Earth’s climate.
Yndestad and Solheim have been working together on this project for more than 2 years. Although Dr. Yndestad was “skeptical about the idea of sunspots as climate indicators” initially, the two discovered “for the first time” a strong long-term correlation between Total Solar Irradiance (TSI) and sunspots for periods of 84 and 210 years, confirming the “Cause of causes” of climate change. Details can be found in their illuminating new paper.
Summary
“Deterministic models based on the stationary periods confirm the results through a close relation to known long solar minima since 1000 A.D. and suggest a modern maximum period from 1940 to 2015. The model computes a new Dalton-type sunspot minimum from approximately 2025 to 2050 and a new Dalton-type period TSI minimum from approximately 2040 to 2065. … Periods with few sunspots are associated with low solar activity and cold climate periods. Periods with many sunspots are associated with high solar activity and warm climate periods.”
1940-2015 Grand Maximum Of Solar Activity, Highest In 4,000 Years, Just Ended
“Studies that employ cosmogenic isotope data and sunspot data indicate that we are currently leaving a grand activity maximum, which began in approximately 1940 and is now declining (Usoskin et al., 2003; Solanki et al., 2004; Abreu et al., 2008). Because grand maxima and minima occur on centennial or millennial timescales, they can only be investigated using proxy data, i.e., solar activity reconstructed from 10Be and 14C time-calibrated data. The conclusion is that the activity level of the Modern Maximum (1940–2000) is a relatively rare event, with the previous similarly high levels of solar activity observed 4 and 8 millennia ago (Usoskin et al., 2003). Nineteen grand maxima have been identified by Usoskin et al. (2007) in an 11,000-yr series.”
Solar Activity Minimum/Maximum Periods Linked To Colder/Warmer Climates
“Twenty-seven grand minima are identified with a total duration of 1900 years, or approximately 17% of the time during the past 11,500 years (Usoskin et al., 2007). An adjustment-free reconstruction of the solar activity over the last three millennia confirms four grand minima since the year 1000: Maunder (1640–1720), Spörer (1390–1550), Wolf (1270–1340) and Oort (1010–1070) (Usoskin et al., 2007). The Dalton minimum (1790–1820) does not fit the definition of a grand minimum; it is more likely a regular deep minimum that is observed once per century or an immediate state between the grand minimum and normal activity (Usoskin, 2013). Temperature reconstructions for the last millennium for the Northern Hemisphere (Ljungquist, 2010) show a medieval maximum temperature at approximately the year 1000 [Medieval Warm Period] and a cooling period starting at approximately 1350 [Little Ice Age], immediately after the Wolf minimum and lasting nearly 500 years, with the coldest period in what is referred to as the Little Ice Age (LIA) at the time of the Maunder minimum. A cold period was also observed during the time of the Dalton minimum. The Maunder and the Dalton minima are associated with less solar activity and colder climate periods. In this investigation, minimum solar activity periods may serve as a reference for the identified minimum irradiations in the TSI oscillations.”
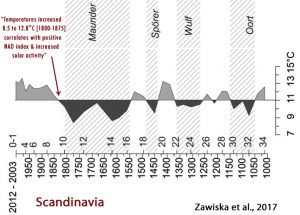
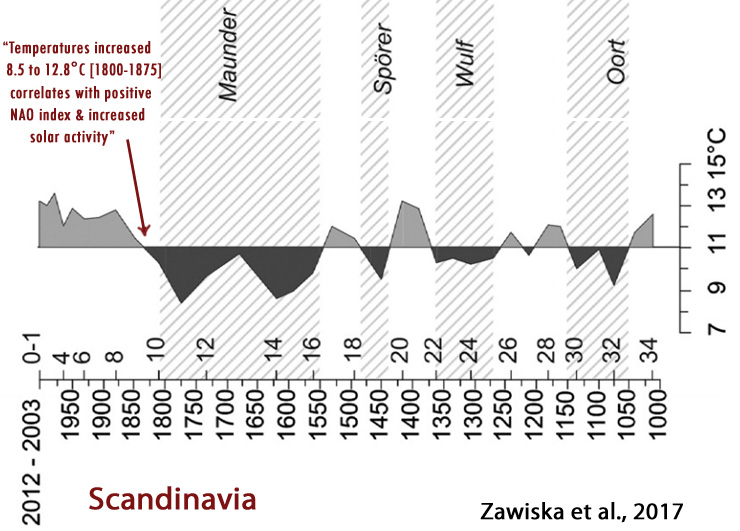
Other scientists have just published papers in peer-reviewed journals documenting a robust correlation between solar activity and surface temperatures in the paleoclimate record. Zawiska et al. (2017) have found that the amplitudes of the warming and cooling periods — modulated by changes in solar activity and the North Atlantic Oscillation (NAO) — during the last 1,000 years far exceeded the temperature changes that have occurred since about 1950, or since anthropogenic CO2 emissions began rising at an accelerating pace. For example, these scientists point out that within a matter of 100 years (1050-1150 to 1150-1250), summer temperatures rose from 9.2°C during a low solar activity period (Oort Minimum) to 12.0°C in concert with the subsequent rise in solar activity.
Zawiska and colleagues also point out that the rise in modern era temperatures began around 1800, not the 20th century. In fact, they find that temperatures rose by 4.3°C (from 8.5°C to 12.8°C) within 75 years starting at the beginning of the 19th century (+0.57°C per decade), and this warming “correlates with the positive NAO index and increased solar activity.” The authors further indicate that the warming in the 20th/21st centuries has been “less pronounced” by comparison.
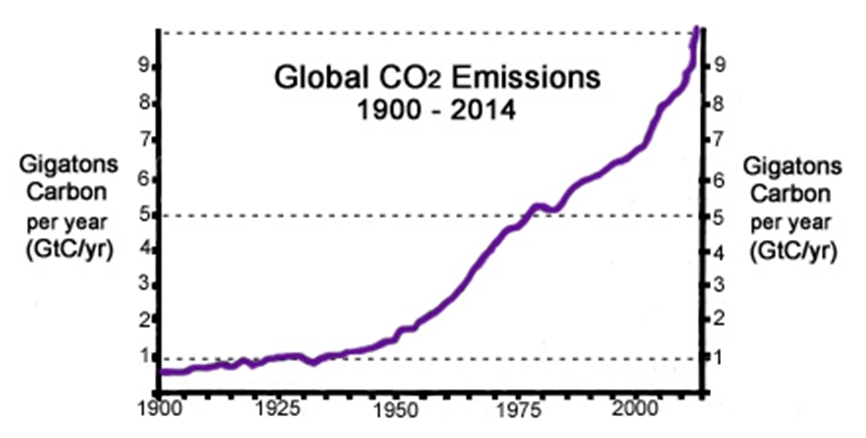
During the 19th century, of course, anthropogenic CO2 emissions rates were but a tiny fraction of what has been observed since the mid-20th century, strongly suggesting that temperature changes associated with natural variations in atmospheric/oceanic cycles (NAO) and solar activity far exceed the forcing strength of anthropogenic CO2 emissions.
Summary
“The chironomid-based temperature reconstruction from Lake Atnsjøen in Eastern Norway with mean resolution of 30 years provided evidence that large-scale processes, such as the NAO fluctuations and solar activity modified local climate, and subsequently affected lakes functioning. The three minor cooling periods were reconstructed in the first half of the Millennium: 1050–1150, 1270–1370, 1440–1470 CE, that coincide with solar activity minima: Oort, Wulf, and Spörer respectively. Furthermore, a two peaked cooling period in the second half of the Millennium was identified that coincided with the LIA. These changes co-occurred with the prevailing negative NAO index.”
Cold Periods (Temp. Average 9.2 °C) Correlate With Low Solar Activity, NAO
“At 1050–1150 CE the first of the short-term cooling periods of the last Millennium began and the mean July temperature in the Lake Atnsjøen region dropped to 9.2 °C. The beginning of this cooling coincided with the Oort solar activity minimum. The reconstructed climate deterioration agrees very well with temperatures revealed for Europe (PAGES 2k Consortium, 2013) and Finland (Luoto and Helama, 2010), and partly with tree-ring based temperature trends from Northern Sweden (Osborn and Briffa, 2006). … The climate cooling around 1100 CE has been observed also in Northern America, Russia and Central Asia (Osborn and Briffa, 2006; Wanner et al., 2008), but intrestingly not in Greenland (Osborn and Briffa, 2006). … The beginning of the 1270–1370 CE cooling coincide with Wulf solar activity minimum suggesting that the climate was responding to Sun activity. The climate cooling synchronous to this solar minimum had almost global range and it has been recorded from Europe, Arctic, North America and Antarctica (Osborn and Briffa, 2006; PAGES 2k Consortium, 2013) but again not in Greenland (Osborn and Briffa, 2006). … The beginning of the 1440–1470 CE cold period is synchronous to the pronounce negative NAO phase (Trouet et al., 2009). … Maunder solar minimum caused a very deep negative NAO index phase (Shindell et al., 2001), which consecutively lead to significant drop in the reconstructed temperature.”
Warm Periods (Temp. Average 12°C) Correlate With High Solar Activity, NAO
“According to presented reconstruction, climate shifted towards warmer conditions during 1150–1250 CE, as mean July temperature raised to 12 °C. Studies from Finland and Sweden also indicate short climate warming around 1200 CE (Luoto and Helama, 2010; Osborn and Briffa, 2006) … The above described time interval 1000–1250 CE coincides with the MCA [Medieval Climate Anomaly] that occurred around 950–1250 CE and was regarded as a generally warmer and drier period (Mann et al., 2009).
The temperature reconstruction from Lake Atnsjøen indicates that recent and ongoing climate warming began already in 1800 CE following the LIA. Temperatures increased very fast, from 8.5 to 12.8 °C during the first 75 years, but in the 20th century the increase became less pronounced.
The warming at the beginning of 19th century in the region of Lake Atnsjøen coincides with a reconstruction from Southern Finland (Luoto, 2013), and a record from Northern Sweden (Osborn and Briffa, 2006). Its onset correlates with the positive NAO index and increased solar activity.”
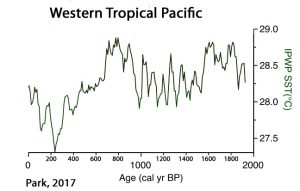
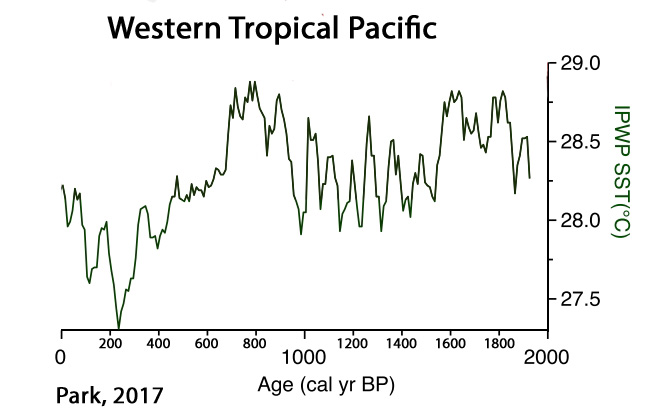
Another scientist just published a paper in the journal Palaeogeography, Palaeoclimatology, Palaeoecology that also concludes solar activity drove variations in the East Asian Monsoon (EAM), El Niño Southern Oscillation (ENSO), and the centennial-scale cooling periods corresponding to the Oort, Wolf, Spörer, and Maunder sunspot minimums.
In his graph of Western Tropical Pacific sea surface temperatures (SSTs), notice how Park (2017) also documents a dramatic warming event occurred beginning about 1800, with the SST warming rate and amplitude far exceeding that which has occurred in recent decades, once again demonstrating the lack of correlation between anthropogenic CO2 emissions and surface temperatures relative to natural variation.
“Late Holocene climate change in coastal East Asia was likely driven by ENSO variation. Our tree pollen index of warmness (TPIW) shows important late Holocene cold events associated with low sunspot periods such as Oort, Wolf, Spörer, and Maunder Minimum. Comparisons among standard Z-scores of filtered TPIW, ΔTSI, and other paleoclimate records from central and northeastern China, off the coast of northern Japan, southern Philippines, and Peru all demonstrate significant relationships [between solar activity and climate]. This suggests that solar activity drove Holocene variations in both East Asian Monsoon (EAM) and El Niño Southern Oscillation (ENSO). In particular, the latter seems to have predominantly controlled the coastal climate of East Asia to the extent that the influence of precession was nearly muted during the late Holocene.”
The year has just begun, and, in addition to the 3 papers introduced above, there have already been several other 2017 scientific papers published in scientific journals documenting a robust correlation between solar activity and climate changes. With the rapidly growing body of evidence that has been accumulating within the last few years, it can no longer be said that it is “settled” science that the Sun and its modulation of natural atmospheric/oceanic oscillations (NAO, ENSO, PDO, AMO) has only a negligible influence on climate. The claim that we human beings predominantly drive climate changes with our CO2 emissions is increasingly being challenged, if not categorically undermined, in the peer-reviewed scientific literature.
“[A]t least six centennial droughts occurred at about 7300, 6300, 5500, 3400, 2500 and 500 cal yr BP. Our findings are generally consistent with other records from the ISM [Indian Summer Monsoon] region, and suggest that the monsoon intensity is primarily controlled by solar irradiance on a centennial time scale. This external forcing may have been amplified by cooling events in the North Atlantic and by ENSO activity in the eastern tropical Pacific, which shifted the ITCZ further southwards. The inconsistency between local rainfall amount in the southeastern margin of the QTP and ISM intensity may also have been the result of the effect of solar activity on the local hydrological cycle on the periphery of the plateau.”
“The results indicate that the climate of the Medieval Climate Anomaly (MCA, AD 900–1300) was similar to that of the Current Warm Period (CWP, AD 1850–present), which contradicts previous studies. … As for the Little Ice Age (LIA, AD 1550–1850), the results from this study, together with previous data from the Makassar Strait, indicate a cold and wet period compared with the CWP and the MCA in the western Pacific. The cold LIA period agrees with the timing of the Maunder sunspot minimum and is therefore associated with low solar activity.”
“Western Mediterranean Holocene record of abrupt hydro-climatic changes … Imprints of North Atlantic meltwater discharges, NAO and solar forcing …Early Holocene winter rain minima are in phase with cooling events and millennial-scale meltwater discharges in the sub-polar North Atlantic. … [A] significant hydro-climatic shift at the end of the African Humid Period (∼5 ka) indicates a change in climate forcing mechanisms. The Late Holocene climate variability in the Middle Atlas features a multi-centennial-scale NAO-type pattern, with Atlantic cooling and Western Mediterranean winter rain maxima generally associated with solar minima.”
“An increase in atmospheric moisture for the warm period of the year (May–September) since 1890s, and mean annual temperatures since the 1950s was identified. During the same time period, there was a marked increase in amplitude of the annual variations for temperature and precipitation. … These fluctuations are consistent with 10–12-years Schwabe–Wolf, 22-years Hale, and the 32–36-years Bruckner Solar Cycles. There was an additional relationship found between high-frequency (short-period) climate fluctuations, lasting for about three years, and 70–90-years fluctuations of the moisture regime in the study region corresponding to longer cycles.”
Posted in Cooling/Temperature, Solar, Solar Sciences |


Some 8-10 years ago, before I jumped into the argument, I looked up either the first or second IPCC report and found something to the effect that they Expected a ‘slight cooling period’ to begin around the 2030s.
I’m pretty sure that expectation has not shown up in subsequent reports, and I can no longer find my way back to it in those first two reports.
And despite anything sod will attempt to claim, YES, it *was* in at least one of those reports and I did read it. I suspect it went away when the hockey schtick showed up, because if anything a cooling period would contradict claims of rapid, unstoppable temperature rise.
Citation to your claim?
Hmp. Well I know I said some things in the past that might have put me on moderation, but pretty sure that past is long dead. Can I come off that list please?
There’s no list. It just happens with Pierre’s wordpress settings. Happens to me as well, on and off.
Heck I get comments turning up out of moderation that I’ve long forgotten I made. But then my memory is not what it was…
So ClimateOtter, just keep patient.
[…] Scientists Find Climate’s ‚Cause Of Causes’…Highest Solar Activity In 4000 Years… […]
Kenneth,
I think you may also interested in the paper
“A connection from Arctic stratospheric ozone to El Niño-Southern oscillation” by Fei Xie1, Jianping Li1.
available (free) at http://iopscience.iop.org/article/10.1088/1748-9326/11/12/124026/meta
Basically they model the El Nino/La Nina very accurately using solar data!
Yes, it’s been added to the 2017 collection, which already exceeds 40 papers.
it seems like temperatures rose after solar activity rose in the early 20th century warming period according to that chart plus the solar minimum of 2008/2009 was the deepest since 1913 and cycle 204 is the weakest in a 100 years I do not think solar activity is higher now than in the early 20th century.
They knew this 14 years ago!
https://www.nasa.gov/centers/goddard/news/topstory/2003/0313irradiance.html
What is the trick here? it is hidden in plain sight:
“#Time series (sidc-ssn) from 1749.05 to 2015.47
#Selected data from 1850
#Averaged with 50-sample running mean
#Offset by -40
#Integral (cumulative) generated
#Normalised to -0.5..0.5”
http://www.woodfortrees.org/data/hadcrut4gl/from:1850/mean:50/normalise/plot/sidc-ssn/from:1850/mean:50/offset:-40/integral/normalise
This is curve fitting at its best.
So this is your “rebuttal” to the scientific papers above that affirm climate change is robustly correlated with solar activity?
“So this is your “rebuttal” to the scientific papers above that affirm climate change is robustly correlated with solar activity?2
No. That is my reply to the graph you added to the top of your post.
It is curve fitting at its best.
Look what a minor change does to it:
http://www.woodfortrees.org/plot/hadcrut4gl/from:1850/mean:50/normalise/plot/sidc-ssn/from:1850/mean:50/offset:-80/integral/normalise
I can actually give that graph nearly every form by just changing the offset. But you can surely explain to me, what physical mechanic is making “offset -40” the one and only real one!
I am really curious!
Solanki et al., 2004
https://www.ncdc.noaa.gov/paleo/pubs/solanki2004/fig3a.jpg
Vieira et al., 2011
http://www.aanda.org/articles/aa/full_html/2011/07/aa15843-10/F5.html
Usoskin et al., 2004
http://www.aanda.org/articles/aa/full/2004/02/aah4688/img35.gif
Zharkova et al., 2015
https://www.ncbi.nlm.nih.gov/pmc/articles/PMC4625153/
“The longest direct observation of solar activity is the 400-year sunspot-number series, which depicts a dramatic contrast between the almost spotless Maunder and Dalton minima, and the period of very high activity in the most recent 5 cycles [1950s – 2000s], prior to cycle 24. … The records show that solar activity in the current cycle 24 is much lower than in the previous three cycles 21–23 revealing more than a two-year minimum period between cycles 23 and 24. This reduced activity in cycle 24 was very surprising because the previous five cycles were extremely active and sunspot productive forming the Modern Maximum.”
Usoskin et al., 2014
http://www.aanda.org/articles/aa/pdf/2014/02/aa23391-14.pdf
“[T]he modern Grand maximum (which occurred during solar cycles 19–23, i.e., 1950–2009) was a rare or even unique event, in both magnitude and duration, in the past three millennia. Except for these extreme cases, our reconstruction otherwise reveals that solar activity is well confined within a relatively narrow range.”
http://www.nature.com/nature/journal/v431/n7012/full/nature02995.html
“[T]he level of solar activity during the past 70 years is exceptional, and the previous period of equally high activity occurred more than 8,000 years ago. We find that during the past 11,400 years the Sun spent only of the order of 10% of the time at a similarly high level of magnetic activity and almost all of the earlier high-activity periods were shorter than the present episode.”
http://cc.oulu.fi/~usoskin/personal/lrsp-2008-3Color.pdf
“The sun spends about 70% of its time at moderate magnetic activity levels, about 15 – 20% of its time in a grand minimum and about 10 – 15% in a grand maximum. Modern solar activity corresponds to a grand maximum. …. The modern level of solar activity (after the 1940s) is very high, corresponding to a grand maximum”.
http://faculty.fgcu.edu/twimberley/EnviroPol/EnviroPhilo/SolVar.pdf
“The Sun is the most important energy source for the Earth. Since the incoming solar radiation is not equally distributed and peaks at low latitudes the climate system is continuously transporting energy towards the polar regions. Any variability in the Sun -Earth system may ultimately cause a climate change. … After removing the effect of the changing geomagnetic field on the Be10 production rate, a 9000-year long record of solar modulation was obtained. Comparison with paleoclimatic data provides strong evidence for a causal relationship between solar variability and climate change.”
http://www.researchgate.net/profile/Daniel_Nordemann/publication/226333495_Reconstruction_of_Wolf_Sunspot_Numbers_on_the_Basis_of_Spectral_Characteristics_and_Estimates_of_Associated_Radio_Flux_and_Solar_Wind_Parameters_for_the_Last_Millennium/links/0deec518cf2a6f1ac8000000.pdf
“[I]n the last 1000 years solar activity displayed a Great Medieval Maximum, 1100 – 1250 AD, followed by a period of lower solar activity until the start of the 20th century. … The Oort, Wolf, Spörer, Maunder, and Dalton Minimums have been identified, as have the Medieval Maximum and the so-called Modern Maximum, starting near 1900.”
http://link.springer.com/article/10.1007/s11434-010-4177-1#page-1
“It is seen that a very active period that began in 1920, the so-called ‘current grand solar maximum’, will probably end during 2011-2027 … The current grand solar maximum started in 1920 and lasted for eight 11-year solar cycles.”
http://eae.sagepub.com/content/25/8/1455.short
“Here we show that the cumulative influence of the unusually elevated solar activity in the 64 years 1941-2005, as calculated using the time-integral of sunspot number anomalies (with a proxy factor) might have been a primary cause of the global warming observed through 2001.”
http://onlinelibrary.wiley.com/doi/10.1111/bor.12130/abstract
“We explored the sources and characteristics of each pigment, reconstructed an 800-year record of ultraviolet radiation (UVR) and total incoming light intensity, and identified the possible factors that may have influenced historical UVR changes in this region. The results indicated at least four UVR peaks during the past 800 years, corresponding to c. AD 1950–2000, 1720–1790, 1560–1630 and 1350–1480, with the intensity from the most recent [1950-2000] sediments being the highest.”
Yndestad and Solheim, 2017
https://www.researchgate.net/profile/Harald_Yndestad/publication/307894966_The_Influence_of_Solar_System_Oscillation_on_the_Variability_of_the_Total_Solar_Irradiance/links/57d2bd7508ae6399a38d9449.pdf
“The activity level of the Modern Maximum (1940–2000) is a relatively rare event, with the previous similarly high levels of solar activity observed 4 and 8 millennia ago“
The STUPIDITY of using an offset of -80 defies explanation even for someone as moronic as sop.
Since there is no warming from 1850 to 1920, it makes sense that the average sunspot number is approximately the “hold steady” value, so the off-set used should be the average of the sunspot number from 1850 to 1920..
Which is 42. Offset should be approx -42
http://www.woodfortrees.org/plot/hadcrut4gl/from:1850/mean:50/normalise/plot/sidc-ssn/from:1850/mean:50/offset:-42/integral/normalise
using an offset of -80 is just pure ANTI-SCIENCE and a blatant attempt of DENIAL of nature solar forcing.
Just like we have come to expect from sop… it lives in a wasteland of WILFUL DENIAL of nature and science.
The trick is the real hockey stick!
You’re averaging, then you’re integrating? What’s the purpose of that? Do you want to estimate the effect of temperature on an ice mass?
“You’re averaging, then you’re integrating? What’s the purpose of that? ”
Not me. It is the graph at the top of this discussion!
http://www.woodfortrees.org/plot/hadcrut4gl/from:1850/mean:50/normalise/plot/sidc-ssn/from:1850/mean:50/offset:-40/integral/normalise
The non-warming period from 1850 to 1920 indicates that the sunspot number for zero temperature trend is the average SSN from 1850-1920, which is 42
…so the offset of -40 when looking at solar warming/cooling is about right.
Only a MORONIC IDIOT would use an offset of -80.
That would indicate a total and ABSOLUTE IGNORANCE of anything mathematical…
But, it is sop, so that is to be expected.
Oh! I didn’t notice averaging is on one time series and integrating on the other! Sorry! I was not able to get a plot displayed when I made that comment, just got a list of numbers. Works now so I see what you’re trying to do there.
Sod-the-science-denier rejecting peer reviewed science papers due to his religion. Sweet.
““#Time series (sidc-ssn) from 1749.05 to 2015.47”
You are truly a Moron, sop….. Hadcrut only starts in 1850
Given that there is a pause for the last 18 years, the following temperature raw data from around the world up to about 14 year ago probably isn’t going to change much.
https://www.john-daly.com/stations/stations.htm
There is NO global warming, at least not without fraudulently “adjusting” the data.
BBC radio had a piece today about how Icelandic clams have revealed water temperature changes over the last 1000 years, mentioning previous heresies that solar effects can be seen, and that over 1000 AD to 1800 the sea changes came first, the atmosphere followed. Has the BBC changed its spots? … no way, they reassured us that the CO2 warming signal is still clearly evident in the last 200 years. They also explained why those darned sceptics have become so distrustful of experts, apparently its because by explaining science certain people think they know enough to be able to reject what they are being told, something known to all religions … never explain it, or it will collapse.
Meanwhile the sun is blank!
by http://spaceweather.com/
SUNSPOTS VANISH, SPACE WEATHER CONTINUES: So far in 2017, the big story in space weather is sunspots–or rather, the lack thereof. The sun has been blank more than 90% of the time. Only one very tiny spot observed for a few hours on Jan. 3rd interrupted a string of spotless days from New Years through Jan.11th. Devoid of dark cores, yesterday’s sun is typical of the year so far.
The last time the sun produced a similar string of spotless days was May of 2010, almost 7 years ago. That was near the end of the previous deep Solar Minimum. The current stretch is a sign that Solar Minimum is coming again. Sunspot numbers rise and fall with an ~11-year period, slowly oscillating between Solar Max and Solar Min. In 2017, the pendulum is swinging toward the bottom.
And another worthy view of our solar system
http://www.landscheidt.info/?q=node/280 and all those complex cycles.
That’s my preferred source. I think he’s a lot more objective than NASA, and others.
Actually, believe it or not, today there was FINALLY some proof of climate change!
For years, the warmists have been postulating the appearance of “climate refugees,” who would head north due to increasingly hot weather.
Today, the San Diego Chargers announced that they are going to be relocating to Los Angeles – about a 2.5 – 3 hour’s drive *north* up I-5.
They’re obviously climate refugees.
If that doesn’t prove that climate change is real, I don’t know what will! 🙂
BTW, the first attempt at a new team logo is hideous:
http://b.fssta.com/uploads/2017/01/c1-653wukaals-f-2.vadapt.767.high.0.jpg
That must be due to climate change as well!
And don’t forget the Colts moved from Baltimore to Indy. That was back in ’84, so climate change has obviously been going on for a long time, and athletes are far more attuned to it than anyone else.
p.2. that’s all the way from 39.2904° N to 39.7684° N.
How’s that for sensitivity?!
Sunspot numbers directly contradict temperature record.
http://www.woodfortrees.org/plot/hadcrut4gl/from:1850/mean:50/normalise/plot/sidc-ssn/from:1850/mean:50/offset:-80/integral/normalise
No correlation what so ever!
http://www.woodfortrees.org/plot/sidc-ssn/from:1800
That graph also has zero correlation to temperature increase!
you need to add a couple of tricks to produce a correlation!
Trying to PRETEND, even in your own feeble mind, that there is not a LARGE increase on sunspot numbers/solar activity over the latter half of last century is really one of the most PATHETIC attempts at DENIAL I have ever seen… even you do, sop.
The mathematical stupidity to produce what you produce, can only be put down to you being one of the most ignorant or internally corrupt people on the planet.
I should have proofed better
“even you do, sop ” …
change to
… even from you, sop.
Offset change, back to REALITY, hey sop
http://www.woodfortrees.org/plot/hadcrut4gl/from:1850/mean:50/normalise/plot/sidc-ssn/from:1850/mean:50/offset:-30/integral/normalise
So why is it that solar scientists keep documenting solar activity hockey sticks, and they say that the Modern Grand Maximum (1950-2009) is the highest for thousands of years?
Solanki et al., 2004
https://www.ncdc.noaa.gov/paleo/pubs/solanki2004/fig3a.jpg
Vieira et al., 2011
http://www.aanda.org/articles/aa/full_html/2011/07/aa15843-10/F5.html
Usoskin et al., 2004
http://www.aanda.org/articles/aa/full/2004/02/aah4688/img35.gif
Zharkova et al., 2015
https://www.ncbi.nlm.nih.gov/pmc/articles/PMC4625153/
“The longest direct observation of solar activity is the 400-year sunspot-number series, which depicts a dramatic contrast between the almost spotless Maunder and Dalton minima, and the period of very high activity in the most recent 5 cycles [1950s – 2000s], prior to cycle 24. … The records show that solar activity in the current cycle 24 is much lower than in the previous three cycles 21–23 revealing more than a two-year minimum period between cycles 23 and 24. This reduced activity in cycle 24 was very surprising because the previous five cycles were extremely active and sunspot productive forming the Modern Maximum.”
Usoskin et al., 2014
http://www.aanda.org/articles/aa/pdf/2014/02/aa23391-14.pdf
“[T]he modern Grand maximum (which occurred during solar cycles 19–23, i.e., 1950–2009) was a rare or even unique event, in both magnitude and duration, in the past three millennia. Except for these extreme cases, our reconstruction otherwise reveals that solar activity is well confined within a relatively narrow range.”
http://www.nature.com/nature/journal/v431/n7012/full/nature02995.html
“[T]he level of solar activity during the past 70 years is exceptional, and the previous period of equally high activity occurred more than 8,000 years ago. We find that during the past 11,400 years the Sun spent only of the order of 10% of the time at a similarly high level of magnetic activity and almost all of the earlier high-activity periods were shorter than the present episode.”
http://cc.oulu.fi/~usoskin/personal/lrsp-2008-3Color.pdf
“The sun spends about 70% of its time at moderate magnetic activity levels, about 15 – 20% of its time in a grand minimum and about 10 – 15% in a grand maximum. Modern solar activity corresponds to a grand maximum. …. The modern level of solar activity (after the 1940s) is very high, corresponding to a grand maximum”.
http://faculty.fgcu.edu/twimberley/EnviroPol/EnviroPhilo/SolVar.pdf
“The Sun is the most important energy source for the Earth. Since the incoming solar radiation is not equally distributed and peaks at low latitudes the climate system is continuously transporting energy towards the polar regions. Any variability in the Sun -Earth system may ultimately cause a climate change. … After removing the effect of the changing geomagnetic field on the Be10 production rate, a 9000-year long record of solar modulation was obtained. Comparison with paleoclimatic data provides strong evidence for a causal relationship between solar variability and climate change.”
http://www.researchgate.net/profile/Daniel_Nordemann/publication/226333495_Reconstruction_of_Wolf_Sunspot_Numbers_on_the_Basis_of_Spectral_Characteristics_and_Estimates_of_Associated_Radio_Flux_and_Solar_Wind_Parameters_for_the_Last_Millennium/links/0deec518cf2a6f1ac8000000.pdf
“[I]n the last 1000 years solar activity displayed a Great Medieval Maximum, 1100 – 1250 AD, followed by a period of lower solar activity until the start of the 20th century. … The Oort, Wolf, Spörer, Maunder, and Dalton Minimums have been identified, as have the Medieval Maximum and the so-called Modern Maximum, starting near 1900.”
http://link.springer.com/article/10.1007/s11434-010-4177-1#page-1
“It is seen that a very active period that began in 1920, the so-called ‘current grand solar maximum’, will probably end during 2011-2027 … The current grand solar maximum started in 1920 and lasted for eight 11-year solar cycles.”
http://eae.sagepub.com/content/25/8/1455.short
“Here we show that the cumulative influence of the unusually elevated solar activity in the 64 years 1941-2005, as calculated using the time-integral of sunspot number anomalies (with a proxy factor) might have been a primary cause of the global warming observed through 2001.”
http://onlinelibrary.wiley.com/doi/10.1111/bor.12130/abstract
“We explored the sources and characteristics of each pigment, reconstructed an 800-year record of ultraviolet radiation (UVR) and total incoming light intensity, and identified the possible factors that may have influenced historical UVR changes in this region. The results indicated at least four UVR peaks during the past 800 years, corresponding to c. AD 1950–2000, 1720–1790, 1560–1630 and 1350–1480, with the intensity from the most recent [1950-2000] sediments being the highest.”
Yndestad and Solheim, 2017
https://www.researchgate.net/profile/Harald_Yndestad/publication/307894966_The_Influence_of_Solar_System_Oscillation_on_the_Variability_of_the_Total_Solar_Irradiance/links/57d2bd7508ae6399a38d9449.pdf
“The activity level of the Modern Maximum (1940–2000) is a relatively rare event, with the previous similarly high levels of solar activity observed 4 and 8 millennia ago“
Hi Kenneth,
Has any one done any studies on the changes in UV frequency during solar cycles?
The UV frequency apparently makes quite a difference to penetration into seawater.
Might be worth investigating both aspects, and somehow, you seem to have time that I don’t have. 🙂
ps.. Thanks HEAPS for the MASSIVE amount of research you have been doing. 🙂
really sop,
That graph is the height of statistical JUNK
Normalise it so the whole first part is below zero, then integrate so you show a decrease
PATHETIC attempt, using absolutely MORONIC mathematical procedures..
But its all you have, isn’t it sop.
Statistical malpractice.
let’s change the off-set shall we.
Just to show everybody the totally PATHETIC SCAM that sop is trying on.
http://www.woodfortrees.org/plot/hadcrut4gl/from:1850/mean:50/normalise/plot/sidc-ssn/from:1850/mean:50/offset:-30/integral/normalise
Since there is no warming from 1850 to 1920, it makes sense that the average sunspot number is approximately the “hold steady” value, so the off-set used should be the average of the sunspot number from 1850 to 1920..
Which is 42.
http://www.woodfortrees.org/plot/hadcrut4gl/from:1850/mean:50/normalise/plot/sidc-ssn/from:1850/mean:50/offset:-42/integral/normalise
using an offset of 80 is just pure soppy nonsense.
I will repeat my simple question: Why is an offset of -30 or -40 “true” and gives a good graph (one that seems to explain temperature changes), while other offset numbers (the ones given by me) are bad (as they produce very little correlation)?
I am really curious and ready to learn!
I have explained it 3 or 4 times!!
The first half of the temperature series shows basically zero warming.. Average sunspot number 42 ish
That shows that around that average number is the zero warming number.. ie peaks mostly below 90 on average
So if you are above that average, like you are over ALL of the second half of last century, you should get warming up to another equilibrium temperature, barring other influences.
The average from 1938-2001 was 75.. that is nearly DOUBLE the earlier average
Andy, please stop feeding the thread-hijacker
His/her/its CRAP cannot be left unanswered, if not for the vain hope of actually educating it, but for any other readers.
If you leave its CRAP sitting on the walkway.. the unsuspecting will tread in it.
100% agree.
While there are some other minor forcings that we may or may not have found yet, it is very obvious that Solar activity is a major player.
On the other hand, there is absolutely nothing to indicate that CO2 has any warming effect what-so-ever.
The ABSOLUTELY BENFICIAL rise in aCO2 being purely from natural ocean warming with a little help from humans burning sequestered carbon deposits.
What’s interesting is that with the right weighting of SS Integral , AMo and OD, you can get very close to HAdcrut or GISS Temperature series
https://s19.postimg.org/6loeewmlv/AMOSSI_etc.png
Still not correct, of course, (because its Had, Giss, therefore junk temperatures)
If however, you take the weighted (0.5, 1,1) 3 cycle average of sunspots and delay it somewhat, as per David Evans’s theory, you end up with a nearly flat trend from 1979 to 2015, which, discounting El Ninos, is a very close match to the satellite temperature series.
Still have a bit of investigation to do with the data, but with a bit of natural AMO and PDO to give the 1940’s peak then cooling to 1970, a pretty close match to reality should be possible. These are all KNOWN, PROVEN factors influencing temperatures, unlike CO2 which is proven to have no effect whatsoever.
should be PDO not OD. !! DOH!
[…] a reconstruction of solar activity (Total Solar Irradiance, or TSI) for 1700-2013. As explained here, the 20th Century contained the so-called Modern Grand Maximum of very high solar […]
“Within 10 years, or by 2025, these scientists project the next solar minimum period (which will be similar in character to the late 18th Century’s Dalton Minimum) will exert its cooling effect on the Earth’s climate.”
Any (small) solar cooling (~ -0.1 K/(W/m2)) will be easily swamped by man’s emissions of GHGs:
“On the effect of a new grand minimum of solar activity on the future climate on Earth,” G. Fuelner and S. Rahmstorf, Geo Res Lett vol. 37, L05707 2010.
http://www.pik-potsdam.de/~stefan/Publications/Journals/feulner_rahmstorf_2010.pdf
“Increased greenhouse gases enhance regional climate response to a Maunder Minimum,” Song et al, Geo Res Lett vol. 37, L01703 (2010) http://www-cirrus.ucsd.edu/~zhang/PDFs/Song_et_al-2010.pdf
“What influence will future solar activity changes over the 21st century have on projected global near-surface temperature changes?” Gareth S. Jones, et al, JGR v 117, D05103 (2012) doi:10.1029/2011JD017013, 2012.
http://www.leif.org/EOS/2011JD017013.pdf
If that’s true, why are scientists continuing to find that ocean temperatures still much colder than they’ve been for most of the last 10,000 years even with the dramatic rise in atmospheric CO2 in the last 100+ years? When will this dramatic warmth from “man’s emissions of GHG’s” actually start to affect temperatures beyond the range of natural variability?
https://notrickszone.com/2016/12/01/new-paper-human-climate-forcing-below-detection-deep-oceans-warm-by-2c-within-200-years-100-naturally/
What about the other areas of the ocean not covered by this paper?
Rosenthal et al., 2017: “[W]e assume that our records represent the World Ocean and thus are comparable in volume with the current estimates (Levitus et al., 2012).”
What is the science behind their assumption? The World ocean is much bigger than the N Pacific + Antarctic Current, obviously.
As indicated in the article itself, their new paper (2017) covers more than just the “N Pacific + Antarctic Current”. They insist in the paper their coverage is comparably as “global” as Levitus et al. (2012).
Why aren’t you answering the underlying question rather than getting so caught up with these coverage tangents, David? Is it because you know you don’t have a good answer as to why today’s ocean temperatures are still much colder than they’ve been for nearly all of the last 10,000 years despite today’s high CO2 levels?
Why was the Pacific Ocean so much warmer than now during the Medieval Warm Period, David (Rosenthal et al., 2013, 2017)? What caused that warmth, since CO2 levels were in the 270 ppm range? Answer the question.
“….ocean temperatures still much colder than they’ve been for most of the last 10,000 years”
That is *not* what this paper says.
It’s about the “North Pacific and Antarctic intermediate waters.”
Last time I looked, there was much more ocean than that.
https://notrickszone.com/2016/12/12/another-new-paper-reveals-no-discernible-human-or-co2-influence-on-global-ocean-temperatures-climate/
Rosenthal et al. (2017) (above link) has even more graphs (several are shown above) of ocean heat content that show today’s ocean temperatures are still much colder than for most of the last 10,000 years, and that past warming and cooling periods occurred without any significant change in CO2 concentrations. They also claim that the scope of their coverage is global:
“[W]e assume that our records represent the World Ocean and thus are comparable in volume with the current estimates (Levitus et al., 2012).”
So again I ask you, David, if human CO2 emissions are going to prevent natural variability/solar activity from affecting climate changes to any significant degree, as you believe, why hasn’t this phenomenon of CO2 emissions heating the oceans happened yet? Why are today’s ocean temperatures still much colder than nearly all of the last 10,000 years? After all, CO2 concentrations are much higher than they were when ocean heat content was significantly higher, and CO2 emissions were flat. So why do you believe what you do?
Rosenthal et al are for the North Pacific and Antactica.
To make global conclusions, one needs global data.
So what global data are you using to make your conclusions?
Rosenthal et al. (2017) covers the N. and S. and Equatorial Pacific, the Atlantic, and the Indian oceans, and the authors themselves write this:
“To obtain a first order comparison, we assume that our records represent the World Ocean and thus are comparable in volume with the current estimates (Levitus et al., 2012).”
I am not the one claiming that Rosenthal et al. (2017) represents the global ocean. The authors of the paper are the ones making that claim. I don’t agree with them either that their data is – or could be – a global representation.
Again, try to focus on the actual question here rather than getting sidetracked trying to figure out why Rosenthal et al. (2017) claim their coverage is for the “World Ocean”. Why were the Pacific and Atlantic Oceans so much warmer than they are now back when CO2 levels were in the 260s and 270s ppm…since you believe CO2 concentrations are the primary determinant of (regional) ocean heat?
“So why do you believe what you do?”
I don’t believe Appell does believe half the crap he comes out with.
Who is paying you to LIE, rotten-appell?
Kenneth Richard wrote:
“Rosenthal et al. (2017) covers the N. and S. and Equatorial Pacific, the Atlantic, and the Indian oceans”
That’s not true. Here’s what their abstract says:
“Here we review proxy records of intermediate water temperatures from sediment cores in the equatorial Pacific and northeastern Atlantic Oceans, spanning 10,000 years beyond the instrumental record.”
http://www.sciencedirect.com/science/article/pii/S0277379116304802
No Indian Ocean.
Equatorial Pacific Ocean.
Just the northeastern Atlantic.
No Arctic Ocean.
What happened to the Antarctic data they had in 2013?
David, I have accessed the full paper, not just the abstract. In it, there are OHC references for:
“South Atlantic and SW Pacific”
“North Pacific Intermediate Water (NPIW)”
“eastern equatorial Pacific”
“Southern Ocean”
“Subantarctic Mode Water (SAMW)”
“equatorial and subtropical South Pacific”
“western equatorial Pacific”
“Eastern North Atlantic Central Waters (ENACW)”
“Antarctic Intermediate Water (AAIW)”
“North Atlantic and North Pacific”
“Indonesion Throughflow (ITF), which flows into the Indian Ocean”
“Indonesian Intermediate Water”
“Equatorial Atlantic”
Again, I am not the one making the claim that the data here represents the global ocean. The authors of the paper write that.
Obviously this is nothing more than a diversionary tactic. You don’t want to answer the actual question I keep asking, and you keep pretending this question isn’t being asked: Why were the above oceanic regions all warmer than now for most of the last 10,000 years when CO2 concentrations were in the 260s ppm while they were so much warmer? How many more times must I ask this question, and how many more times will you continue to avoid it by pointing out that the Rosenthal papers don’t represent the global oceans — a point I have already told you I agree with?
“Who is paying you to LIE, rotten-appell?” – AndyG55
Whatever they’re paying him, he isn’t worth it.
Kenneth wrote:
“Why were the above oceanic regions all warmer than now for most of the last 10,000 years when CO2 concentrations were in the 260s ppm while they were so much warmer?”
Surely you don’t think that atmospheric CO2 is the only factor that can influence climate.
Right??
“Surely you don’t think that atmospheric CO2 is the only factor that can influence climate. Right??”
Correct. So what caused Pacific Ocean heat content to rise and fall at rates and amplitudes that far exceed the rates and amplitudes of the last few centuries, as indicated here:
https://notrickszone.com/wp-content/uploads/2016/11/Holocene-Cooling-Pacific-Heat-Content-Rosenthal13-copy.jpg
What was/were the mechanism(s), David, if you acknowledge it wasn’t CO2?
Kenneth, I noticed how you tried to slip in “Pacific Ocean” there, when the data only pertain to the Northern and equatorial Pacific Ocean.
There is insufficiente data to say where that heat came from. Perhaps it was heat exchange with the Atlantic and/or Indian Ocean and/or southern Pacific Ocean.
For a climate change earlier, Stott et al Science (2007) say
“Deep-sea temperatures warmed by ∼2°C between 19 and 17 thousand years before the present (ky B.P.), leading the rise in atmospheric CO2 and tropical–surface-ocean warming by ∼1000 years. The cause of this deglacial deep-water warming does not lie within the tropics, nor can its early onset between 19 and 17 ky B.P. be attributed to CO2 forcing. Increasing austral-spring insolation combined with sea-ice albedo feedbacks appear to be the key factors responsible for this warming.”
http://science.sciencemag.org/content/318/5849/435
Your notion that all change must be due to CO2 is ridiculous, and naive.
Do you think the Sun and variations in albedo might have contributed to heat changes in oceans? If so, how much?
Um, David, that isn’t my “notion.” I have never written anything of the kind. I do not share your beliefs. I would appreciate it if you would refrain from making up “notions” and then claiming I have written them.
Kenneth Richard 17. January 2017 at 5:22 AM | Permalink
“Surely you don’t think that atmospheric CO2 is the only factor that can influence climate. Right??”
Kenneth says:
“So what caused Pacific Ocean heat content to rise and fall at rates and amplitudes that far exceed the rates and amplitudes of the last few centuries, as indicated here”
I’d have to study this issue to understand it in more detail. Probably not likely.
But your apparent notion that any other warming any other place any other time means CO2 isn’t a strong greenhouse gas causing most of today’s warming is absolutely ridiculous.
We know very well what CO2’s radiative forcing is.
Something that happened 10 or 20 kya doesn’t change the molecular properties of CO2. Of course.
Yes, I understand that you are “probably not likely” to understand why OHC naturally rises and falls at magnitudes and rates that far exceed the modern period’s changes. That would require you to consider that OHC changes might be far more influenced by factors other than 0.000001 fluctuations in atmospheric CO2. Don’t investigate, just keep on believin’.
We “know” what the models say it is. CO2’s radiative forcing influence on OHC has never been observed. Nor has it ever been subjected to a scientific experiment. But that’s what your version of climate “science” is based upon.
“Surely you don’t think that atmospheric CO2 is the only factor that can influence climate.”
roflmao..
Its been proven to you over and over and over again.
CO2 has NO influence on climate except by data adjustments to meet the anti-CO2 scam.
There is absolutely NO CO2 signal in real temperature data or real sea level data, or anywhere else.
NONE WHAT SO EVER !!
Kenneth R wrote:
“CO2’s radiative forcing influence on OHC has never been observed.”
Is there a reason to think it’s different than on land?
“Observational determination of surface radiative forcing by CO2 from 2000 to 2010,” D. R. Feldman et al, Nature 519, 339–343 (19 March 2015)
http://www.nature.com/nature/journal/v519/n7543/full/nature14240.html
The heat capacity of the ocean is 1,100 times greater than the heat capacity of the air. Do you consider that’s a substantive difference?
Again, the rotten appell uses the Feldman paper he knows PROVES NOTHING.
They started at the bottom of an El Nino, and ended at the top of a La Nina, and pretend to have found a tiny increase that would come purely from the temperature increase.
The result is MEANINGLESS, and he KNOWS it.
But he MUST keep up with his blatant misinformation, because misinformation is all he has.
Not only that, but during the period that Feldman et al. (2015) use to claim CO2 forcing caused warming (2000-2010), global temperatures cooled:
http://www.woodfortrees.org/plot/rss/from:2000/to:2010/plot/rss/from:2000/to:2010/trend
And anyway, according to the Feldman paper, the +0.000022 (22 ppm) increase in atmospheric CO2 concentration during 2000-2010 elicited a RF value of 0.2 W m-2 during those 10 years. According to Stephens et al. (2012), the radiative imbalance for the same 2000-2010 period was estimated to be +0.6 W m-2 (with an uncertainty of 17 W m-2, which is more than 10 times greater than the assumed forcing for both the radiative imbalance and the estimate of forcing attributed to CO2). A radiative imbalance of 0.6 W m-2 over 2000-2010 means that CO2 only caused 33% (0.2 of 0.6 W m-2) of the radiative forcing for that period. That means that something other than CO2 was the predominant radiative forcing (0.4 W-2). What was it, David?
I wonder if the so-called scientists did some partial time period checks (like a proper scientist would have)
2000-2008 might have been interesting.
Also why did they take FIVE whole years to publish such an “important” paper.??
It would have sailed through pal-review.
Did it take that long to statistically tease out the tiny amount they say they found ?
Or did the test data actually finish in say 2012?
https://s19.postimg.org/6nqtliulv/Feldman_oops.png
And that error margin is truly something wondrous to behold. 🙂
The big question is WHY/HOW did this paper ever get published with such a meaningless result !!!!
Kenneth Richard wrote:
“Not only that, but during the period that Feldman et al. (2015) use to claim CO2 forcing caused warming (2000-2010), global temperatures cooled”
1) I doubt it.
2) Do you really honestly not understanding the irrelevance of your claim?
Kenneth, if you do not understand that, at least, you are simply note qualified to preach about climate, and I’m just going to ignore you.
Because that is really a dumb statement.
That’s about as likely to happen as your claim that you’re “done” here, that you will no longer post here…that lasted about 10 days. Do you consider yourself a man of your word, David?
Kenneth, according to NOAA data, the decade ending 12/2010 was +0.20 C warming than the 10 years (120 months) before.
NOAA data:
http://www.ncdc.noaa.gov/monitoring-references/faq/anomalies.php
David, NOAA makes up temperature data. This is what their “coverage” looks like: http://www.ncdc.noaa.gov/sotc/service/global/map-land-sfc-mntp/201509.gif
The gray and white areas have no thermometers. No data. 80% of the globe (at least) has no temperature data available. So, instead of using actual measurements, NOAA just makes it up. They use “in-filling” based upon computer models rooted in their own biases. The MetOffice/HadCRUT do the same thing. In fact, ClimateGate showed that they admit they just make up sea surface temperatures for most of the SH.
In contrast, as Dr. Spencer explains, the satellite temperature dataset coverage extends to “every cubic inch of the lower atmosphere” on a daily basis.
“[T]hermometers cannot measure global averages — only satellites can. The satellite instruments measure nearly every cubic kilometer – hell, every cubic inch — of the lower atmosphere on a daily basis. You can travel hundreds if not thousands of kilometers without finding a thermometer nearby.”
We know you prefer made-up data that suits your beliefs and biases to actual physical measurements, David. That’s why you prefer what NOAA puts out, and you ignore satellite data. Because, as mentioned above (and sourced with a link to actual RSS data), between 2000-2010, global temperatures cooled:
http://www.woodfortrees.org/plot/rss/from:2000/to:2010/plot/rss/from:2000/to:2010/trend/plot/uah6/from:2000/to:2010/plot/uah6/from:2000/to:2010/trend
For your convenience, I included both the RSS and UAH temperature data for the 2000-2010 cooling trend.
According to the Feldman et al. (2015) paper, modeled CO2 forcing was 0.2 W m-2 for 2000-2010, when satellite data show that global temperatures cooled. So CO2 had no effect on global temperatures during that period. Why do you think that is, David?
And according to Stephens et al. (2012), the radiation balance for the globe was 0.6 W m-2 for 2000-2010 (with an uncertainty of 17 W m-2). So assuming you agree with that “settled science”, what caused the other +0.4 W m-2 of radiative forcing for those 10 years…when the temperatures cooled? Can you answer these questions?
“according to NOAA data’
There is NO SUCH thing as NOAA data.
There is only NOAA fabrication
you KNOW that.. so that makes you a DECEITFUL LYING PIECE OF ****!!