 First a note:
If you haven’t already picked up a copy of the The Politically Incorrect Guide to Climate Change, please do get your hands on one.
According to its author Marc Morano, people have been snatching them up and a third printing has started. The book even made the Amazon top 100 best selling books for awhile.
It also ranked first in a number of categories. In his book, NoTricksZone gets mentioned 4 times and even took up one full page at one spot!
So now on to today’s post…
Less heat days near Tokyo
As in Germany, a heat day in Japan is defined as one reaching 30°C or higher.
And according to the manmade CO2 theory, global temperatures are supposed to be rising rapidly and hence we should be seeing many more “heat days” than say 50 or 100 years ago.
Yet Japanese blogger Kirye presents data over Hachijo Island, out to sea east of Tokyo, a location shielded from the urban heat island effect, which tell us that more heat days is not the case at all:
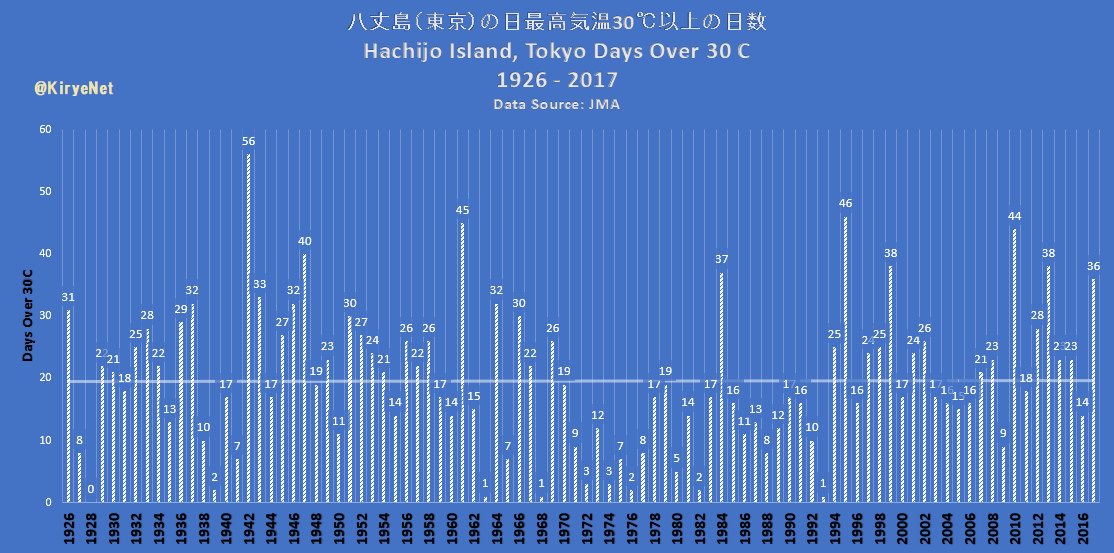
On Hachijo Island, Tokyo, the number of days over 30℃ has not trended since 1926. Source: www.data.jma.go.jp/
Examining the above chart, we see that the number of “heat days” since 2000 is a bit below that of the period from 1940 to 1960. Note the cool 1970 to 1990 period, which likely can be explained by natural oceanic oscillations.
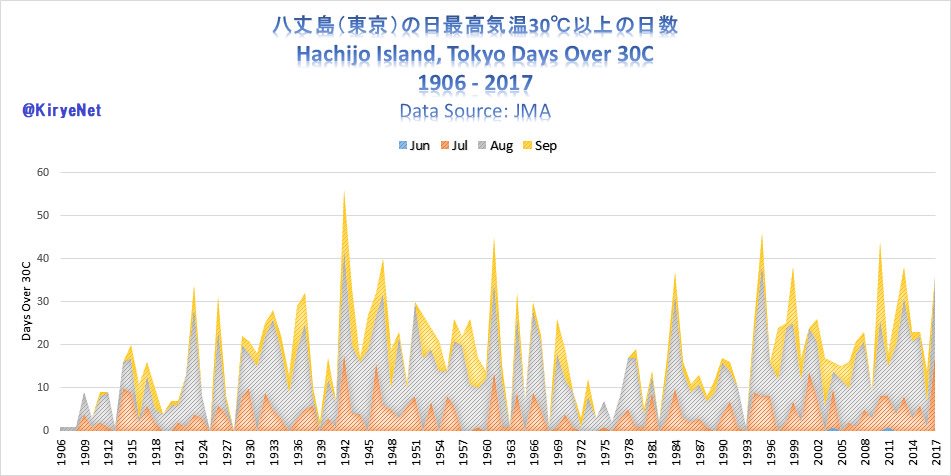
Another chart Kirye provides at Twitter breaks it down in more detail:
 Source: www.data.jma.go.jp/
Kirye writes, when looking at the past 111 years, the trend in Hachijo Island’s number of days over 30℃ from 1906 to 2017 “denies the anthropogenic global warming hypothesis” and that it does not support the myth of a widespread man-made climate change.
No trend in the city of Tokyo
Also the last 24 years in the city Tokyo show no trend, and even a declining trend since 2010:
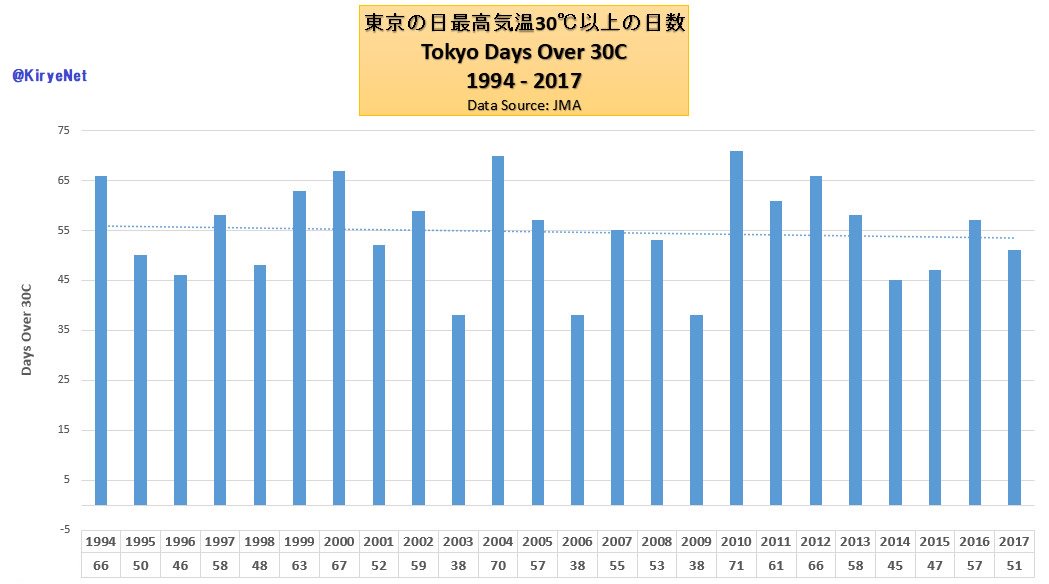
Data source: Japanese Meteorological Agency (JMA)
What follows is the month-by-month breakdown, May to October:
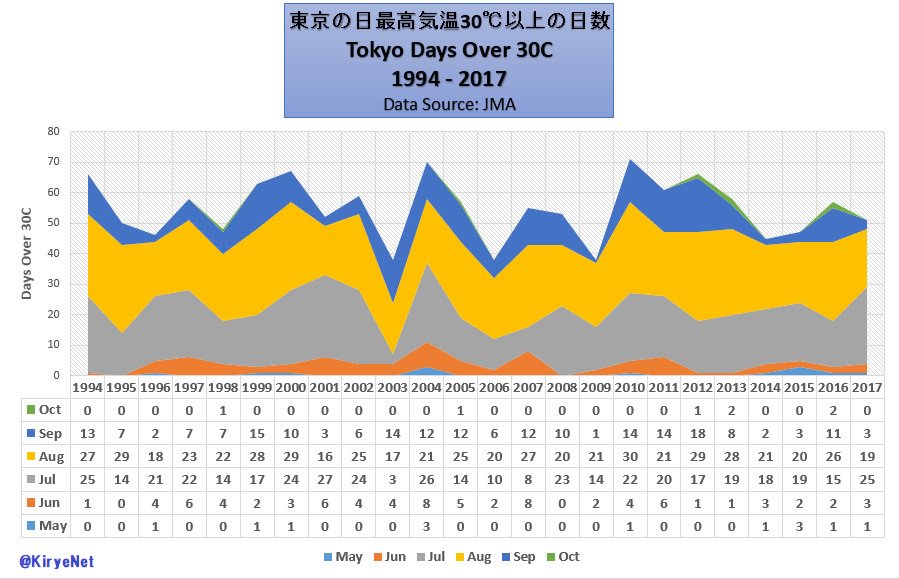
Data Source: www.data.jma.go.jp/
Urban heat island
Kirye also presents here a comparison of the Tokyo and Hachijo Island temperature course over the past 111 years. Note urban Tokyo has risen while the island off the coast has risen only very slightly:
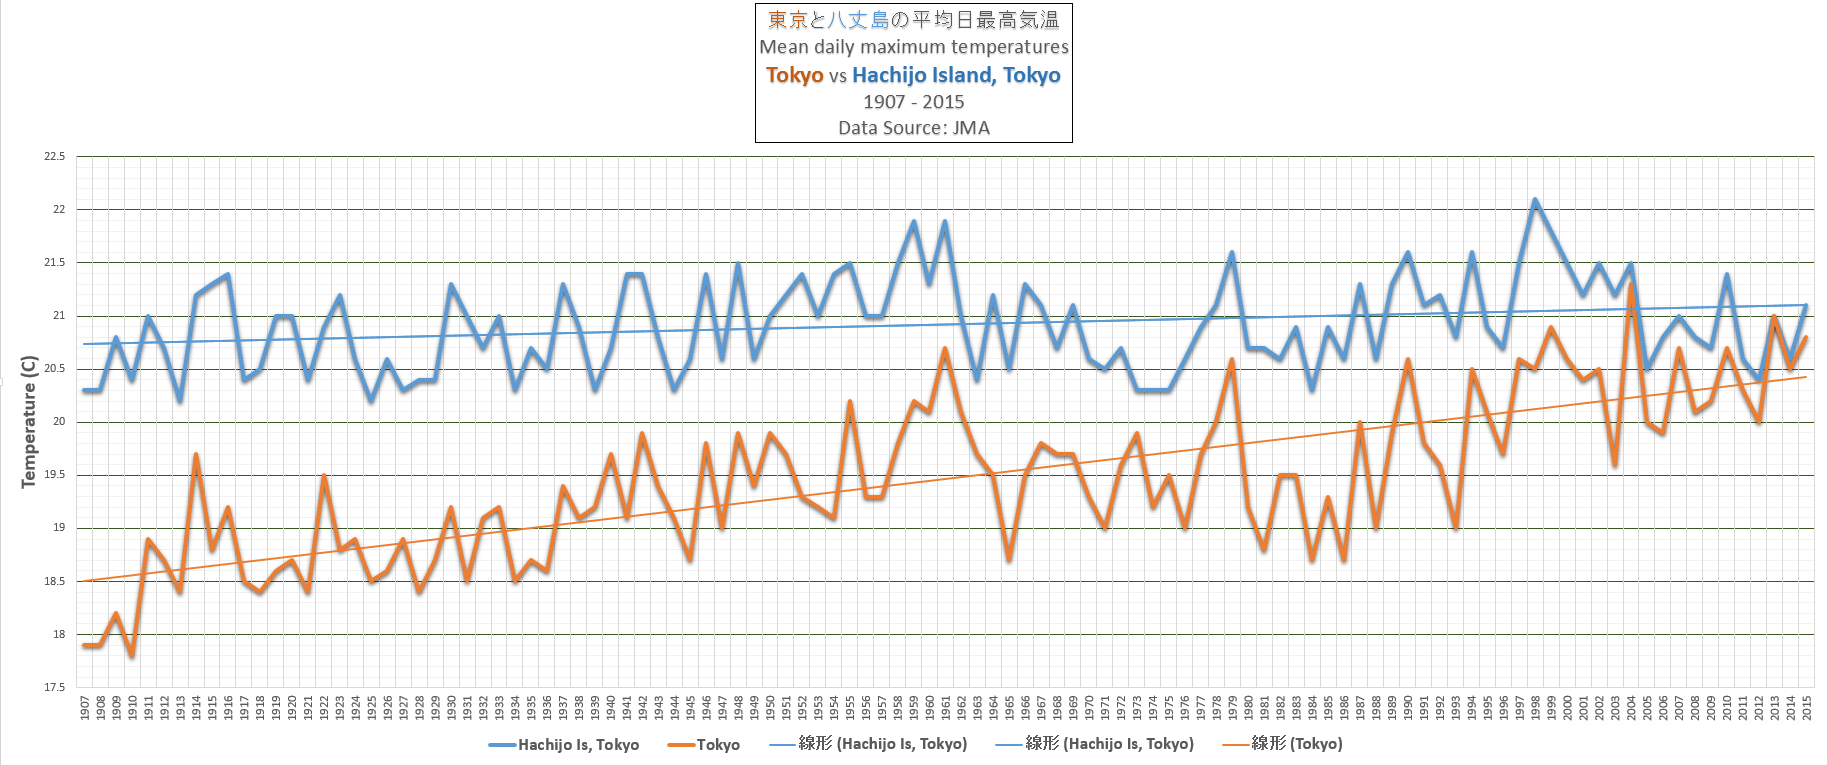
Data source: JMA
Urban heat island effect? Kirye notes:
The mean daily maximum temperatures for Tokyo and Hachijo Island differed by more than 2C with the early trend during the period from 1907 to 2015, but temperature difference of close to 0.7C with the trend in the latter period.”


Well, well we see a stable climate within 0.2 – 0.3 degrees Celcius. What else would you expect from a chaotic system which is controlled from the molecular level up by an overwhelming number of negative feedbacks. Just measure the temperature in your own backyard before and after a rain shower.
Totally OT, oebele,
but in my work with the International College, I see lots of names, (mainly middle east, but some others) and I like trying to figure out where the name originates. Yours looks like an African name, but I can’t place which county.
Am I even remotely close ??
(If you don’t mind me asking, of course)
Ocean Cool Island effect?
“The contribution of urban effects on recent temperature trends in Japan was analysed using data at 561 stations for 27 years (March 1979–February 2006). Stations were categorized according to the population density of surrounding few kilometres. There is a warming trend of 0.3–0.4 °C/decade even for stations with low population density (<100 people per square kilometre), indicating that the recent temperature increase is largely contributed by background climatic change. On the other hand, anomalous warming trend is detected for stations with larger population density. Even for only weakly populated sites with population density of 100–300/km2, there is an anomalous trend of 0.03–0.05 °C/decade. This fact suggests that urban warming is detectable not only at large cities but also at slightly urbanized sites in Japan."
Detection of urban warming in recent temperature trends in Japan
DOI: 10.1002/joc.1822
0.2-0.3C/decade is in perfect agreement with the IPCC figure for Northern Hemisphere warming over land.
Trend at Japanese non-urban stations 0.3-0.4C/decade. Actually higher than the average for NH temperatures over land.
https://doi.org/10.1002/joc.1822
Of that their own data
http://www.data.jma.go.jp/cpdinfo/temp/list/mon_jpn.html
Shows only 0.12ºC/decade of beneficial warming, mainly in two steps, one in 1958 and one in 1990
Of => Odd
Thanks for pointing at Japan more often in the last months. They do have a Meteorological Agency too, and low and behold … look at their annual global average temperature graph:
http://ds.data.jma.go.jp/tcc/tcc/products/gwp/temp/ann_wld.html
They must be in on this conspiracy that adjusts all temperature so it looks like Earth is warming and the 1940s weren’t as warm as today, right?
Japan since 1998
https://s19.postimg.org/s9bwikr0z/Japan_post_1998.png
slight step between 1990 and 1998, like most places in SE Asia.
Japan 1950 – 1990.
Remember, this is the era when Japan was developing into a MAJOR manufacturing country
https://s19.postimg.org/6kzq5cxdf/japan1950-1990.png
Even seb could not fabricate a CO2 warming signature out of that.
Even more HILARIOUS is that seb doesn’t know that the Japanese met get their global data straight from the much corrupted NCDC.
And goodness knows where the Berks get their data from.. mostly their input is a load of inconsistent garbage that they then form into any fabrication they like.
Interesting choice of periods to show in graphs, AndyG55. Why not post a full graph from 1898 up until today? That full graph even lends itself to do a polynomial fit, but otherwise clearly shows a 0.12°C per decade increase.
Two small step-like changes.
ZERO warming during the build-up of Japanese industrial might.
ZERO warming the last 20 years
So certainly NOTHING to do with warming from CO2
A 2 year can be taught to use a straight edge, seb. 😉
You need to look deeper, and become less “unaware”
And http://berkeleyearth.lbl.gov/regions/japan … Japan is warming.
10-year smoothing makes the recent 20 years look like warming, when in fact it hasn’t really warmed in 25 years.
Same strategy as with the sea ice extent in the Arctic? Stable since 2006/2007, right? 😉
“Stable since 2006/2007, right”
That’s what the data says.
No smoothing needed.
And still FAR more Arctic sea ice than at any time before the COLD ANOMALY known as the Little Ice Age.
“Japan is warming.”
NOPE.
https://s19.postimg.org/s9bwikr0z/Japan_post_1998.png
slight jump around 1990.. cause ? but NOT CO2
And during the massive development of Japanese industry..
https://s19.postimg.org/6kzq5cxdf/japan1950-1990.png
Berkeley can be basically ignored.
They use all the garbage data they can find and mash it into whatever final product they want. Its like the lowest quality offal sausage you can get.
If that’s your style of food.. good luck to you.
Apologies for the duplicates; they looked like they were noshows.
Yep, happens occasionally.
Just gone..
Seb,
How can this be? How can the world be warming up? NoTricksZone has collected literally hundreds of graphs from all around the globe showing no warming.
Please explain.
“has collected literally hundreds of graphs from all around the globe showing no warming.”
Do you obviously accept the FACT than MANY places are not warming.. small step.
The only places experiencing any warming are those affected by El Nino and ocean effects.
Neither of which has ANYTHING to do with atmospheric CO2 or any other human influence.
Its warming because the LIA was a VERY COLD ANOMALY..
.. In fact, the COLDEST period in 10,000 years.
And THANK GOODNESS for that warming.
Most people in the world live where it is WARM rather than COLD, or use LOTS of fossil fuel powered heating in winter.
Like I bet you do. I doubt you are posting from Siberia.
Let’s all hope the coming cooling is not too deep.
“Do you obviously accept the FACT than MANY places are not warming.. small step.”
Of course. It is clearly the case, the obvious one being the Southern Ocean and Antarctica, a region which seems to be cooling, an outcome at odds with model projections.
But this is something of a Straw Man. As energy accumulates in the climate system due to the enhanced greenhouse effect, the distribution of heat is changing, ocean currents and wind patterns are rearranging themselves. As the globe warms on average there will be localised regions that show no warming or even cooling. The NTZ approach is to scan the literature for proxy reconstructions from a region or locality that shows little or no warming, carefully extract a graph (sometimes one out of several where the others show warming), then post the graph with a caption ‘No Warming in ‘ ‘. So a single island is used to indicate ‘No warming in the West Pacific’, a small wood to indicate ‘No warming in Pakistan’ and so on. By posting a long list of these the reader is invited to join the dots and conclude ‘No warming anywhere’.
But it ain’t so.
The only places experiencing any warming are those affected by El Nino and ocean effects.
Neither of which has ANYTHING to do with atmospheric CO2 or any other human influence.
GET OVER IT !!
The other point is that calling it GLOBAL warming is a massive misnomer.
It just AIN’T so.
Thankfully there was some NATURAL warming out of the coldest period in 10,000 years, ie the LIA,
Probably to a peak around 1940, (we will never know, the data has become too corrupted)
Then cooling to the COLDEST period in 100 or so years, around the late 1970s
then just those El Nino events.
ZERO human or CO2 signature except in data corruption.
No, our presentation is more nuanced. We note that some regions have warmed in the last decades or the last century or so, and that, in general, modern temperatures are warmer than they were during the Little Ice Age. This is very fortunate. The LIA was the coolest period in the last 10,000 years. But modern temperatures are neither unprecedented or even unusual in the context of the last several thousand years. They don’t even fall outside the range of natural variability enough for an anthropogenic signal to be detectable. For example, do you see any anthropogenic fingerprint in this graph of Greenland temperature and sea ice during 1600-2010?
https://notrickszone.com/wp-content/uploads/2017/06/Holocene-Cooling-Greenland-SW-Kryk-2017.jpg
Or how about this one:
https://notrickszone.com/wp-content/uploads/2018/01/Holocene-Arctic-Sea-Ice-Iceland-North-Perner-2018.jpg
Notice that the unusual period is not the present, but the extent of the sea ice advance (the hockey stick) during the LIA.
https://notrickszone.com/2018/01/01/150-non-global-warming-graphs-from-2017-pummel-claims-of-unusual-modern-warmth/
I noticed you are employing a new strategy, Kenneth. Additionally to claiming that modern warming is not special, you began to claim that the special part is the LIA and we should be glad that temperature returned to warmer levels (presumably all by itself).
Someday you’ll hopefully notice that explaining things with “happened all by itself” when one can clearly recognize one major difference with path “natural” warmings, is a bit strange. Seeing it this way requires ignoring lots of evidence or worse, calling it fake.
P.S.: Please stop posting drift ice graphs of Northern Ireland as if they were Arctic sea ice trend graphs.
Do you disagree that the Little Ice Age cooling was induced by a combination of low solar activity (which increases cloud cover and leads to dimming) and centennial-scale high volcanic activity? Do you disagree that we have enjoyed a Modern Grand Maximum of solar activity since the early 20th century, which just recently ended? Do you disagree that we have enjoyed a period with much less volcanic activity than occurred during the LIA, meaning that more solar heat was absorbed by the Earth system within the last century? Do you think these factors have anything to do with the modern warming we’ve enjoyed in many regions of the Earth (with some exceptions, as not all regions have warmed)?
It’s not Northern Ireland. It’s Northern Iceland, which is in the Arctic circle. Other regions in the Arctic show the same trajectory (LIA Hockey Stick):
https://notrickszone.com/wp-content/uploads/2017/11/Holocene-Arctic-Sea-Ice-Chukchi-Sea-Yamamoto-2017.jpg
As does Iceland in general:
https://notrickszone.com/wp-content/uploads/2016/11/Arctic-Sea-Ice-Iceland-Since-MWP-1975-copy.jpg
Why do you have such a problem with seeing that the Little Ice Age and its low solar activity and high volcanic activity is the exception to the rule, and that we have merely returned to more “normal” levels of solar and volcanic activity within the last century?
STILL denying that the LIA was the coldest period in 10,000 years.
There is NOTHING to show that human CO2 causes warming.
Seems you are also ignorant about the two main places for Arctic sea ice expansion.
Above Iceland
and the Chukchi Sea
Both have the same pattern and show that Arctic sea ice is in the TOP 10% of Holocene sea ice extents, just a small amount down from the COLDEST period in 10,000 years, and the similar extreme extents of the late 1970s , the COLDEST period in 100 years.
““Objects that radiate less than they receive get warmer.”. ”
UNTRUE.
You seem to be “unaware” of the way gases operate to thermalise and equilibrate their energy to the gases around them
You seem to have never heard the word, “conduction”.
The list of things you are “unaware” of is getting incredibly long, seb, and you seem to have zero inclination to do anything about it.
Do you think these factors are exclusively the cause for the modern warming even in the last decades when the Sun weakened?
Autocorrect.
I have a problem with people ignoring the human influence. Don’t turn that around and claim that I (or others opposing you) would be ignoring natural factors.
What are you trying to say here?
The sentence in itself is absolutely correct. There is no mention of other ways to lose energy and so and object that radiates less than it receives gets warmer. Basic stuff, right?
You possibly interpret this differently and think the surface is the object being talked about and that object is surrounded by gas. Is that correct? Then let me extent that quote: “objects that lose less energy than they receive get warmer”.
Or are you implying that for every reduction in the net radiative flux conduction jumps in? Something like that? Is that similar to your claim that increased backradiation would only cause and even higher increase in evaporation and thus actually cools? 😉
Way to go with that kneecap thing …
The absorbed surface solar radiation from the reduction in cloud cover was still positive in recent decades, SebastianH, in line with the high solar activity.
http://www.atmos-chem-phys.net/13/8505/2013/acp-13-8505-2013.html
“[T]here has been a global net decrease in 340 nm cloud plus aerosol reflectivity [1979-2011]. … Applying a 3.6% cloud reflectivity perturbation to the shortwave energy balance partitioning given by Trenberth et al. (2009) corresponds to an increase of 2.7 W m−2 of solar energy reaching the Earth’s surface and an increase of 1.4% or 2.3 W m−2 absorbed by the surface.”
—
https://www.atmos-chem-phys.net/12/9581/2012/acp-12-9581-2012.html
“The Earth’s climate is driven by surface incident solar radiation (Rs). Direct measurements have shown that Rs has undergone significant decadal variations. … By merging direct measurements collected by Global Energy Budget Archive with those derived from SunDu [sunshine duration], we obtained a good coverage of Rs [surface incident solar radiation] over the Northern Hemisphere. From this data, the average increase of Rs [surface incident solar radiation] from 1982 to 2008 is estimated to be 0.87 W m−2 per decade [2.3 W/m-2 total]”
—
That’s likely changing soon, though.
—
https://link.springer.com/article/10.3103/S1062873817020411
“One of the most important problems facing humanity is finding the physical mechanism responsible for global climate change, particularly global warming on the Earth. … Summation of these periodicities for the future (after 2015) allows us to forecast the next few decades. The solid heavy line in Fig. 1 shows that cooling (a drop in ΔT values) is expected in the next few decades.”
“We can see there is a connection between values ΔТ [temperature] and N [charged particle flux]: with an increase in cosmic ray flux N, the values of changes of global temperature decrease. This link is expressed by the relation ΔT = –0.0838N + 4.307 (see the dashed line in Fig. 2), where the ΔT values are given in °C, and the N values (in particle/min units) are related to the charged particle flux measured at an altitude of 1.3 km. The correlation coefficient of the line with the experimental data is r = –0.62 ± 0.08.”
“Our results could be connected with the mechanism of charged particle fluxes influencing the Earth’s climate; it includes, first of all, the effect charged particles have on the accelerated formation of centers of water vapor condensation, and thus on the increase in global cloud cover. The total cloud cover is directly connected with the global temperature of the near surface air layer.”
“There is no mention of other ways to lose energy”
So you admit that your statement was totally incorrect. Thanks. Nice attempt at back-peddling.
Or do you DENY that conduction and convection exist, always, and especially in the atmosphere.? Basic stuff..
The rest of your post is a load of incoherent nonsense.
You are now sinking in your own mire of “unaware”
“It’s not Northern Ireland.”
Ireland temperature was also similar to now in the 1940s
https://s19.postimg.org/5if59yngz/Ireland_AMO_article.jpg
And still with the “unawareness” that evaporation cools.. WOW !!!
Good, another “short term” prediction that can be easily checked.
What will you do when temperatures and heat content continue to increase? Will you finally become a skeptic of your own views?
@AndyG55:
First, not my statement, second, read again …
The object is Earth in this scenario. AFAIK there is no conduction of convection towards space. Those are entirely internal processes.
I don’t really get what is going on with you these days … all these misinterpretations and transparent attempts at trolling. Why are you doing this?
Poor seb, trying to DENY that you back-peddled to take into account my correction to your original ERROR.
[Snip] ADMIT to your errors.
“The object is Earth in this scenario. AFAIK there is no conduction of convection towards space”
say what ??? no conduction or convection ???
This is a new FANTASY of yours is it.
Convection and conduction control the lower atmosphere….. and in the case of convection, it is ALWAYS net toward space.
And if you are talking TOA, then more radiative gases mean more radiative outflow.
“I don’t really get what is going on “
Yes , we have noticed that many times.
You seem to be admitting that evaporation causes cooling, and that LWR causes evaporation… WELL DONE
another tiny step forward.. what comes next I wonder 😉
“all these misinterpretations and transparent attempts at trolling.”
so STOP DOING IT. seb
You know that is your ONLY reason for being here.
Your only accomplishment.
Philip, would you like to explain the “enhanced greenhouse effect” to a layman like me?
I see you introduced it into your comment but I’m not sure what it is, as compared for example with an “unenhanced” greenhouse effect or whether there is any reason to be concerned about it or what it does
““enhanced greenhouse effect””
Plants grow better. !!
“Philip, would you like to explain the “enhanced greenhouse effect” to a layman like me?”
Simples. Greenhouse gases, by definition, make the atmosphere less transparent to long wave radiation, reducing the rate at which the planet radiates heat to space.
Human activities have increased the concentration of GHGs – in the case of CO2, it varied in a range approx 180-300ppm for hundreds of thousands of years. It is now over 400ppm, a rise of >40% since preindustrial times.
So the natural greenhouse effect has been enhanced, introducing a radiative imbalance. Objects that radiate less than they receive get warmer.
“Philip, would you like to explain the “enhanced greenhouse effect” to a layman like me?”
Philip, the heat flux almost always goes in one direction, as the “the atmosphere doesn’t warm until the oceans do.” The atmosphere accounts for less than 1% of heat changes in the climate system. And, according to the IPCC, the oceans only warmed at of “about 0.015°C per decade” in the 0-700 m layer during 1971-2010.
—
http://www.researchgate.net/publication/223950477_Measurements_of_the_oceanic_thermal_skin_effect
“There is a strong diurnal [sunshine] component to the magnitude of these temperature gradients, as well as a dependence on cloudcover, which modulates the insolation, and wind speed, which influences the turbulent mixing. The surface skin layer of the ocean, much less than 1 mm thick, is nearly always cooler than the underlying water because the heat flux is nearly always from the ocean to the atmosphere“
—
http://onlinelibrary.wiley.com/doi/10.1029/1999GL011133/pdf
“Skin SST is typically 0.1 -0.5 K cooler than the immediate sub-surface water, although considerable variation in the skin-bulk difference has been observed (e.g. Donlon et al., 1999). This temperature difference is due to the vertical heat flux through the thermal boundary layer in the top millimeter of the ocean; net surface heat flux is almost always from ocean to atmosphere, resulting in a cool ocean skin.”
—
http://www.sciencedirect.com/science/article/pii/0004698184901185
“The current eager acceptance of oceanic thermal lag as the ‘explanation’ as to why CO2 warming remains undetected, reemphasizes that the atmosphere cannot warm until the oceans do.”
—
So before CO2 concentration changes can heat up the atmosphere, they must first heat up the 0-4000 m deep ocean. Problematically, we have no physical measurements from real-world experiments that show how much heating or cooling is generated in water bodies by changing the CO2 concentration by + or – a part per million (0.000001). It’s a model-based, hypothetical conceptualization that CO2 heats ups and cools down water when its concentration changes.
Even RealClimate and SkepticalScience acknowledge that the heat from greenhouse gases/IR cannot penetrate past the micro-meter thin “skin” layer and into the ocean, whereas direct solar heating of surface waters extend 10s of meters into the ocean, and the amount of direct solar heating of the oceans’ surface waters is predominantly [“much greater”] determined by changes in cloud cover:
—
SkS: “Sunlight penetrating the surface of the oceans is responsible for warming of the surface layers. … Greenhouse gases, such as carbon dioxide, trap heat in the atmosphere and direct part of this back toward the surface. This heat cannot penetrate into the ocean itself, but it does warm the cool skin layer [“0.1 to 1 mm thick on average”], and the level of this warming ultimately controls the temperature gradient in the [skin] layer. …. It should be pointed out here, that the amount of change in downward heat radiation from changes in cloud cover in the experiment, are far greater than the gradual change in warming provided by human greenhouse gas emissions.”
—
RC: “Of course the range of net infrared forcing caused by changing cloud conditions (~100W/m2) is much greater than that caused by increasing levels of greenhouse gases (e.g. doubling pre-industrial CO2 levels will increase the net forcing by ~4W/m2)”
—
Considering clouds are far more dominant than CO2 in determining how much or how little solar radiation is absorbed by the oceans, and that we’ve had a net reduction in cloud cover since the 1980s, which has caused a radiative imbalance of about +2 W m-2 to +3 W m-2 since 1979…
—
http://www.atmos-chem-phys.net/13/8505/2013/acp-13-8505-2013.html
“[T]here has been a global net decrease in 340 nm cloud plus aerosol reflectivity [1979-2011]. … Applying a 3.6% cloud reflectivity perturbation to the shortwave energy balance partitioning given by Trenberth et al. (2009) corresponds to an increase of 2.7 W m−2 of solar energy reaching the Earth’s surface and an increase of 1.4% or 2.3 W m−2 absorbed by the surface.”
—
https://www.atmos-chem-phys.net/12/9581/2012/acp-12-9581-2012.html
“The Earth’s climate is driven by surface incident solar radiation (Rs). Direct measurements have shown that Rs has undergone significant decadal variations. … By merging direct measurements collected by Global Energy Budget Archive with those derived from SunDu [sunshine duration], we obtained a good coverage of Rs [surface incident solar radiation] over the Northern Hemisphere. From this data, the average increase of Rs [surface incident solar radiation] from 1982 to 2008 is estimated to be 0.87 W m−2 per decade [2.3 W/m-2 total]”
—
…why do you nonetheless believe that CO2 concentration changes, and not cloud cover/absorbed solar radiation changes, are the predominant determinants of ocean temperature changes?
“reducing the rate at which the planet radiates heat to space.”
WRONG !!
You seem not to know that “radiative” gases radiate at the top of the atmosphere. More radiative gases means more radiative outflow.
In the lower atmosphere radiative absorption is thermalise to the rest of the atmosphere and dealt with by convection.
There is no “radiative imbalance” nor any “warming” from atmospheric CO2.
Its a model/agenda driven FALLACY.
Ceres OLR matches UAH temperatures very well except for lags at EL Nino etc.
https://s19.postimg.org/abyowhh0z/CERESv_UAH.png
OLR increases with surface temperature
https://s19.postimg.org/ilfnghzeb/Outgoing-long-wave-radiation-NOAA.jpg
“it varied in a range approx 180-300ppm “
Just around plant life subsistence levels. Thank goodness for the small contribution by humans.
I bet you have contributed your fair share as well, phlip.
It has been shown by actual measurement that DWLWR only penetrates a fraction of a mm into water.
It has also been shown experimentally that it causes evaporation and that evaporation pulls energy from the surface mm or so, causing that top mm or so of water to actually COOL by some 0.3C.
But everybody knows that evaporation causes cooling, don’t they!
There is NO mechanism by which changes in atmospheric CO2 can cause any change in ocean temperature.
Real greenhouses will add 1000 ppm or more of Carbon Dioxide into the structure to provide plant food. Below about 200 ppm plants do not do well, and at about 150 ppm they likely will die.
An enhanced greenhouse will provide the optimum amount of CO2 and other nutrients for the growth of the plants.
The structure itself will also be heated when necessary, usually via gas or some other source.
The carbon dioxide therein, while in much higher concentration than Earth’s atmosphere is currently or likely to be any time soon, does not keep the plants from freezing.
Warmth, carbon dioxide, and plants are all good.
Impressive replies to a simple explanation of what the greenhouse effect is …
Kenneth:
How is this a reply to “more CO2 makes the atmosphere less transparent to longwave radiation” (the part you emphasized in your quote)? The OP didn’t write that CO2 warms the atmosphere, he wrote “Objects that radiate less than they receive get warmer.”. Do you disagree with this or not?
Then comes our beloved AndyG55 with the usual “there is no xyz”, “models”, “everything fake”, “plants love it” topped with a “smooth” insult.
And apparently it’s still a thing to argue against DWLWR penetrating the surface of the oceans. He even goes so far as to claim that all that energy just causes more evaporation and this even overcompensates the increase in backradiation, causing cooling of the oceans/surface. Just wow!
And last but not least, John F. Hultquist comes up with a unrelated “real greenhouses” story.
I suppose none of you accepts that a mechanism called greenhouse effect exists, right?
All what energy? Not from CO2 that is for sure. CO2 doesn’t warm anything, as you well know.
You are still totally unable to provide any empirical proof the enhanced atmospheric CO2 causes anything but enhanced plant growth.
You have yet to provide any proof of the greenhouse effect.
” “Objects that radiate less than they receive get warmer.”. “
Seem seb remains “unaware” that gases share their energy by collisional conduction at time magnitudes faster than re-emittance.
” it’s still a thing to argue against DWLWR penetrating the surface of the oceans”
WOW, He still hasn’t done any basic research on penetration of radiation into water yet, either.
Also thinks that evaporation doesn’t cool objects, and doesn’t know about “latent” heat etc.. weird
Quite bizarre, seeing this all KNOWN basic physics taught in junior high..
Its not that this basic physics hasn’t been explained to him many times.
He just CHOOSES to ignore basic physics because it gets in the way of his non-thinking, anti-science, AGW belief system..
“John F. Hultquist comes up with a unrelated “real greenhouses””
The only sort of “real greenhouse”
The atmosphere certainly isn’t one.
I have to provide? How about you read the scientific literature and understand the concept of radiative heat transfers?
Your replies are indeed “chopping at the kneecaps” … of skepticism.
Oh dear….
seb ADMITS he is unable to find or produce any science proving CO2 warming.
Wants someone else to help him search.
ADMITS he hasn’t heard the word “conduction” and is “unaware” of how gases equalise their temperature.
basic physic, seb… do try some day.
go at em, black knight, so far you only have a flesh wound. 😉
““more CO2 makes the atmosphere less transparent to longwave radiation” “
So you are saying that more atmospheric CO2 blocks this mythical “back-radiation”, is that correct?
So, because of the increased atmospheric CO2, the tiny fraction of a thin spectrum of low-power DWLWR that may survive after the CO2 has thermalised its energy to the remaining 99.96% of the atmosphere, is unable to reach the surface.
That would explain why there is ZERO empirical proof of atmospheric CO2 causing warming of anything, wouldn’t it.
Nice try AndyG55, master of the strawman argument …
Probably your most EMPTY response to date.
Stick to the ZERO-science, seb.
Its what you do.
“How can the world be warming up?”
Through data adjustment mainly.
Some regions of the world are warming…
https://notrickszone.com/wp-content/uploads/2017/04/Northern-Hemisphere-1990-2015-Cooling-and-Warming-Kretschmer-2017.jpg
Some regions of the world are cooling…
https://notrickszone.com/wp-content/uploads/2018/02/Northern-Hemisphere-1990-2015-Cooling-Regional-Kretschmer-2017.jpg
https://notrickszone.com/wp-content/uploads/2018/01/Southern-Ocean-Cooling-1979-to-2013-Purich-2018.jpg
Overall, nothing unusual is happening or has been happening that falls outside the range of natural variability.
I don’t know … maybe I’ve seen too much what goes on at this blog and know what’s going on here 😉
Obviously, in their bubble there is nothing wrong or unusual and it’s hubris to think mankind can manipulate the climate or something like that. It’s always the same three arguments though:
1) there is no warming
2) ok, there is warming but it wasn’t mankind
3) ok, it was us, but it’s all beneficial
P.S.: When I started here I read Kenneth’s list of papers and found many contradictions to what he tries to claim with listing those. Was ignored and insulted all the time. I don’t do that anymore since it is a waste of time. Kenneth is clearly cherry picking what he likes and ignores what he doesn’t like. If those lists show anything, then that there devoted humans exist who spent way too much time trying to paint an unreal picture of the state of the world …
Only warming is from El Nino and ocean effects, which CANNOT be affected by CO2.
Oceans CANNOT be warmed by CO2.
Places that are not affected by El Ninos and ocean effects are not warming.
TIMES that are unaffected by El Ninos and ocean effects are not warming.
You have not found any contradictions, you have found things you were ignorant of. You were unable to counter with any real science.
” devoted humans exist who spent way too much time trying to paint an unreal picture of the state of the world “
They are called PAID CLIMATE ALARMISTS, seb
“Was ignored “
Sorry, didn’t we give you enough attention ??
Basically, nothing you rant about has any scientific merit whatsoever. Its just AGW religious mantra.
This sounds a lot like your made-up claim that you could “only find” data for CO2 increases causing “more desertification” because you were opposed to considering the large body of evidence that the Earth is greening. In other words, SebastianH, we don’t believe you.
SebastianH: “[C]an you please point to the satellite data that shows what you claim [the Earth is greening] is true? I can only find data for increasing desertification.”
I specifically remember going through the papers and not one of the first few I read through matched up with the view you were trying to portrait. I posted about this and got the usual “skeptics to outsiders treatment” …
So you read “a few” papers out of 500 and decided that was enough.
I remember you commenting about things you were obviously “unaware” of, or which assaulted you hard held AGW religious belief, but offering zero science as rebuttal.
I don’t suppose anyone would start a list with the least important papers at the end. If the first ones don’t match the claim, the likelihood is big that the rest won’t match either. And did not get disappointed. As Philip Clarke also found out, your claim rarely matches a paper’s content. And on top of that, you seem to be confused about what the greenhouse effect is supposed to be (among other things).
In essence, those lists are impressive, but they are not painting the picture you like to paint. It’s only a more sophisticated way (than AndyG55’s tirades) to push the theory that all of climate science is wrong, faking it, etc …
Please identify these two papers at the top of a list (which one? — 1,150 papers since 2016) that don’t “match the claim”. There is a high likelihood that your version of what “the claim” is doesn’t match up with the actually stated claims for what these papers are/do represent (see below). Given your history of just making up claims of your own and attributing them to others with whom you disagree, I would certainly welcome you to pick out these two papers you are referring to so that we can see if your claims here measure up. Start with the list for 2017:
Papers 2017 (1)
————————————————————————————-
Below is what I write about what the papers on the list do. Let’s see if you can support your claim above.
https://notrickszone.com/2018/01/04/485-scientific-papers-published-in-2017-support-a-skeptical-position-on-climate-alarm/
The papers in this compilation support these four main skeptical positions — categorized here as N(1) – N(4) — which question climate alarm.
N(1) Natural mechanisms play well more than a negligible role (as claimed by the IPCC) in the net changes in the climate system, which includes temperature variations, precipitation patterns, weather events, etc., and the influence of increased CO2 concentrations on climatic changes are less pronounced than currently imagined.
N(2) The warming/sea levels/glacier and sea ice retreat/hurricane and drought intensities…experienced during the modern era are neither unprecedented or remarkable, nor do they fall outside the range of natural variability, as clearly shown in the first 150 graphs (from 2017) on this list.
N(3) The computer climate models are not reliable or consistently accurate, and projections of future climate states are little more than speculation as the uncertainty and error ranges are enormous in a non-linear climate system.
N(4) Current emissions-mitigation policies, especially related to the advocacy for renewables, are often ineffective and even harmful to the environment, whereas elevated CO2 and a warmer climate provide unheralded benefits to the biosphere (i.e., a greener planet and enhanced crop yields).
In sharp contrast to the above, the corresponding “consensus” positions that these papers do not support are:
A(1) Close to or over 100% (110%) of the warming since 1950 has been caused by increases in anthropogenic CO2 emissions, leaving natural attribution at something close to 0%.
A(2) Modern warming, glacier and sea ice recession, sea level rise, drought and hurricane intensities…are all occurring at unprecedentedly high and rapid rates, and the effects are globally synchronous (not just regional)…and thus dangerous consequences to the global biosphere and human civilizations loom in the near future as a consequence of anthropogenic influences.
A(3) The climate models are reliable and accurate, and the scientific understanding of the effects of both natural forcing factors (solar activity, clouds, water vapor, etc.) and CO2 concentration changes on climate is “settled enough“, which means that “the time for debate has ended“.
A(4) The proposed solutions to mitigate the dangerous consequences described in N(4) – namely, wind and solar expansion – are safe, effective, and environmentally-friendly.
To reiterate, the 485 papers compiled in 2017 support the N(1)-N(4) positions, and they undermine or at least do not support the “consensus” A(1)-A(4) positions. The papers do not do more than that. Expectations that these papers should do more than support skeptical positions and undermine “consensus” positions to “count” are deemed unreasonable in this context.
Ed Bo, whom you cite, has stated that the climate sensitivity is less than 1.2 C for CO2 doubling, that natural forcing “easily” causes climate changes of similar size as those attributed to CO2 forcing, that warming is more beneficial than harmful, that CO2 mitigation policies are more harmful than the alleged climate change, and that politics drive the suppression of emphasis on the benefits of CO2 increases (greening). And this is the person you are citing to demonstrate that I don’t understand how the CO2 greenhouse is supposed to work? Does Ed Bo understand the CO2 GHE, SebastianH? If so, why does he not agree with you about the climate’s sensitivity to CO2 concentration changes (or much of anything else)?
https://notrickszone.com/2017/09/25/another-new-paper-dismantles-the-co2-greenhouse-effect-thought-experiment/comment-page-1/#comment-1231079
“For the record, I believe the most likely climate sensitivity to increased CO2 concentrations is most likely somewhat below the lower bound of the published mainstream sensitivity estimates [below 1.2 C for CO2 doubling]. I do believe that the climate “establishment” has paid far too little attention to possible natural sources of variation, which I think (as I have said) could easily cause changes of similar size.”
“I think such warming — most likely greatest where it is coldest — will be more beneficial than harmful, and that even where and when harmful, steps taken to counteract it will likely be worse than the harm. And I think the benefits of CO2 fertilization to agricultural productivity are being ignored for political reasons.”
Two? And sorry I can’t find that particular post, but does it really matter? I found lots of other posts with comments of mine and other commenters who don’t buy what is being sold here … they get the usual amount of insulting replies with zero content treatment.
It’s a waste of time, just as it was back then … but I’ll see what I can do if the weather becomes bad again (need more of that global cooling thing that you guys are talking about, now that it is warm and sunny).
This was not about Ed Bo and whether or not I agree with him in all things. This was about you. Above you write “Given your history of just making up claims of your own and attributing them to others with whom you disagree” … that’s an accurate description of your own, not me or anyone who dares to disagree with you.
Of course it matters. If you’re going to concoct the narrative that the first few papers on these lists did not match up with what I claimed about them, and so you stopped reading and rejected all ~500 of them, then surely you can at least read those first few papers again and support your concocted narrative. That you are avoiding doing so just goes to affirm that, once again, you are just making stuff up. If you can’t support what you write, then you’ll need to retract it.
This is quite the irony coming from you.
I would certainly welcome you to pick out these two papers you are referring to so that we can see if your claims here measure up. Start with the list for 2017:
SebastianH, you claimed you read the first few papers from one of the long lists of 500 papers (2016 and 2017). What would it take for you to look at the first few papers from these two lists again to actually support your claim? Less than a minute, probably. I’ll even make it easy for you and provide links. Support your claim that these papers do not “match up” with what I wrote that they do/represent. Obviously, you can’t. This demonstrates that, once again, you are just making up false claims and hoping that others won’t check into what you write. But why should anyone believe you if you make claims you can’t support?
Skeptic Papers 2016 (1)
Skeptic Papers 2016 (2)
Skeptic Papers 2016 (3)
Skeptic Papers 2017 (1)
Skeptic Papers 2017 (2)
Skeptic Papers 2018 (1)
Skeptic Papers 2018 (2)
Do you agree with him about the CO2 greenhouse effect contributing less than 1.2 C to global temperatures upon doubling? If not, do you think that he doesn’t understand how the CO2 greenhouse effect is supposed to work?
” you seem to be confused about what the greenhouse effect is supposed to be “
roflmao
Accusing people of not understand your anti-science fantasy.
Quite bizarre !
“theory that all of climate science is wrong”
Yet you can’t even support the most BASIC fallacy of climate so-called science with anything resembling real science.
And neither you or Philp were able to provide anything but AGW mantra to support your case.
Shot down at every turn.
And yes seb, we do know how the greenhouse effect is “supposed” to work.
And it is a load of anti-science nonsense contrary to any measurements or science.
That is what is so laughable.
I don’t think so. They way you guys try to argue against it, is pretty telling.
You have NO argument.
You are unable to describe your “greenhouse effect” is supposed to be with any backing of rational science or physics.
[snip]
You are unable to show any evidence at all that atmospheric CO2 causes ANYTHING but enhanced plant growth.
For more than 1,000 years, emperors, aristocrats, governors and monks have chronicled the flowering of Japan’s famed cherry trees in the city of Kyoto. But bloom dates have shifted radically earlier in recent decades, a sure sign that the region’s climate is warming and warming fast.
Yasuyuki Aono, a professor of environmental sciences at Osaka Prefecture University, has assembled a data set that compiles blossom-flowering dates in Kyoto all the way back to 800 A.D. It shows a sudden and remarkable change in the past 150 to 200 years.
From roughly 800 to 1850, the blossom flowering time was fairly stable. While the bloom dates bounced around quite a bit from year to year during April, the long-term average hovered between April 10 and April 17 (the 100th to 107th day of the year).
But from 1850 to present day, the flowering has surged toward earlier dates at the rate of about one week per century. Consider that in 1850, the average flowering date was around April 17; now, it’s closer to April 6.
Cherry (Blossom) Picking.
https://www.washingtonpost.com/news/capital-weather-gang/wp/2017/04/04/japans-cherry-blossoms-signal-warmest-climate-in-over-1000-years/
ROFLMAO.
Still DENYING the LIA as the COLDEST period in 10,000 years.
Go and live in Siberia if you think the LIA was normal or desirable.
But you prefer somewhere much warmer, don’t you.
The full bloom period of cherry blossoms has remained constant since 1997 in Kyoto.
In that city, it has not been a warming trend since 1997.
https://twitter.com/KiryeNet/status/983096732366942208
Yep, Not much warming in the last 20 years in Japan.
https://s19.postimg.org/s9bwikr0z/Japan_post_1998.png
I guess the Japanese are rather careful with their weather stations, and keep them in proper condition.
Would that be the case, Kirye?
However, Japan’s stations also are affected by urban heat islands like other countries.
“Only three stations are reliable in Japan”, Ph.D. Junsei kondo said.
(He investigated about stations throughout Japan. http://www.asahi-net.or.jp/~rk7j-kndu/)
““Only three stations are reliable in Japan””
Thanks Kirye 🙂
And yet still no warming of the last 20 years.
ps,
Despite the difference in data density between 800-1000 affecting the curve. (quite an interesting statistical ploy, intended or not)…
… You can clearly see the tail-end of the warmer period leading down into the freeze of the LIA.
Thanks for that 🙂
ps, notice its a Zeke plot.
Almost certainly intentional deception.
Looks like a Matzo plot to me.
https://w3.chabad.org/media/images/73/fpYx735972.jpg
Of course, after Passover, everything looks like Matzo.
The claim here is that bloom time for multiple species gets earlier in N and W, but in S it’s later.
https://19january2017snapshot.epa.gov/climate-indicators/climate-change-indicators-leaf-and-bloom-dates_.html
From their graph it looks like they’re pushing the envelop on the statistics, given the wide spread (something they note),
Tony Heller has more here.
https://realclimatescience.com/wp-content/uploads/2018/04/chart-5.png
and more detail here (data apparently unadjusted).
https://realclimatescience.com/2018/03/experts-cherry-blossom-peak-bloom-over/
And then there’s the Chinese flowering trees.
http://www.mdpi.com/sustainability/sustainability-09-01127/article_deploy/html/images/sustainability-09-01127-g001.png
Despite hand-wringing in the paper, there’s no evidence of recent significant changes proclaimed by warmists.
Tony Heller, another cherry (blossom) picker? Why not use the full graph?
https://imgur.com/a/Ex7Qs [So blossoms have been coming earlier over past 30 years? -PG]
Do you DENY that in the NH, the late 1970’s was the COLDEST period in 100 or so years ???
CLIMATE CHANGE DENIAL is your thing, isn’t it seb.
Grape harvest too, as you can see, the late 1970s was the LATEST harvest and COLDEST period since 1880 in Portugal.
https://s19.postimg.org/y51hjpf9f/Portugal_grapes.jpg
And anywhere around the Arctic, 1960s, 70s was coldest since at least 1900.
Just DENY the data seb.
Its what you do.
oops, link
https://s19.postimg.org/vws4z68s3/arctic_temp.png
Philip Clarke
So glad to see that the climate changes.
So what?
I did say “if you feed, they breed”.
DNFTT
Its actually a sign that Pierre and Kenneth are HURTING the AGW meme really badly. When you are over the target, you expect to draw flak.
The mindless AGW apologists are making ZERO progress, because they keep getting cut down at every post.
That is what we need to do.
Keep chopping them at the kneecaps.
Show that they basically have only ANTI-science to support their brain-washed AGW religion.
Keep putting the slight and highly beneficial warming since the LIA into perspective by continually pointing out the FACT that the LIA was the ANOMALY… the COLDEST period in 10,000 years
THANK GOODNESS it has warmed a bit !!!
Note that NOT ONE of the AGW apostles has DENIED that they CHOOSE to live in a warmer climate than Siberia, and use copious fossil fuelled heating in winter even in their warmer climate regions.
Highlight their monumental hypocrisy and wilful DENIAL and ignorance of NATURAL climate change, for all to see.
AndyG55,
Of course they can not deal with natural variations, that would be too much like hard work, sorting out *all* the variables, working out all the interactions and feedbacks, and get all the timing correct. Oh, that would be a real piece of research. Something the cAGW advocates can not stomach, as it all appears to be so messy, so natural.
Heck their answer’s a bunch of computer GIGO models, models that can not get humidity, clouds, and precipitation type correct for any length of time.
Yep, as I look around at ‘settled’ science of climate change, I note new discoveries of natural phenomena that alters how the assessment of how the climate operates and how those GIGO models do not adequately account for this planet’s basic chemical recycling; e.g. https://www.eurekalert.org/pub_releases/2018-04/uoc–nso032918.php
Where they say —
Funny that that our atmosphere is mostly nitrogen but cAGW advocates are fixated on a minor rare gas — CO2. How much have all the other gas and particulate constituents of the atmosphere changed over the last 200 years or more? How has humidity change over the last 200 years at each level of the atmosphere? No opinions required bring measurement records.
Haha, I seriously laughed out loud 😉
How is this ok, moderator?
And this?
Well AndyG55 … you do a very good job of highlighting the true (mental) state of the skeptic scene. Thank you for that and keep up the good work.
Seem I really hit a nerve, hey. 🙂
Do you DENY that you don’t choose to live in Siberia
Do you DENY that you warm your basement in winter using mostly fossil fuel power?
Do you DENY that the LIA was the COLDEST period in 10,000 years?
Do you DENY that in the NH, the late 1970s was the coldest period in 80 or so years?
Do you continue to DENY that enhanced atmospheric CO2 enhanced plant growth??
Do you continue to DENY that the atmosphere has a thermal gradient caused by gravity?
DENIAL seems to be your only attribute.
You have made ZERO progress since you have been here seb, because you have NOTHING to offer in the way of rational scientific discussion.
And here i thought the word “denial” is now banned on this blog …
If you think so … your M-O is getting boring.
So, seb is again totally unable to counter one single thing posted.
Its getting very boring waiting for him to produce some sort of real science to support his CO2 warming fantasy. !
“I seriously laughed out loud”
Giggled inanely, more like it. !!
I repeat…
“Note that NOT ONE of the AGW apostles has DENIED that they CHOOSE to live in a warmer climate than Siberia, and use copious fossil fuelled heating in winter even in their warmer climate regions.”
It is noted that you evaded this point. 😉
We have all been waiting a LONG, LONG time for you to produce empirical proof that enhanced atmospheric CO2 does ANYTHING except enhance plant growth.
An oldie but goodie on low CO2 levels…
https://notrickszone.com/2013/05/17/atmospheric-co2-concentrations-at-400-ppm-are-still-dangerously-low-for-life-on-earth/
Back from the days when comments were a little more polite and intelligent.
Another point of evasion by the warmist trolls is that cold kills, as it has done yet again this year.
https://www.dailystar.co.uk/news/latest-news/694368/flu-winter-death-cold-fatalities
Anyone who advocates cooling a world that is already too cold is NOT a good person.