As the current solar cycle nears an end, it will go down as the weakest in close to 200 years. And as inhabitants of the northern hemisphere dig themselves out of an especially icy and snowy winter and Arctic sea ice rebounds, it may all be in part linked to low solar activity as many scientific studies have long suggested.
=================================================
The Sun in March 2018
By Frank Bosse and Prof. Fritz Vahrenholt
(Translated /edited by P Gosselin)
In March our supplier of energy was more inactive than in the previous months. The sunspot number was only 2,5, which is only 8% of what is normal for this month into the average cycle (month 112).
A sunspot was detected only on 6 of 31 days.

Figure 1: The current solar cycle no. 24 (red) compared to the mean of the previous 23 recorded solar cycles (blue) and the similar solar cycle no. 5 (black).
An observation made on April 10, 2018, allowed us to say that at approximately 30° southern heliospheric latitude the SDO solar research satellite saw a tiny spot (it was too small to be officially counted as a sunspot) that certainly belonged to the next approaching solar cycle no. 25.
Sunspots are magnetic phenomena. The thermally conveyed plasma at the sun’s outer layer generates electric currents. Each of these currents produces a magnetic field. Depending on the direction of the current, the magnetic field is polarized and changes on the sun with each change of cycle.
The SDO instrument is able to determine the polarity of the magnetic field for each sunspot, and provided this image:

Figure 2: A magnetic image of the sun with the tiny spot showing the magnetic field polarity of solar cycle no. 25. Source. All spots of the still ongoing solar cycle no. 24 have opposite polarity: white section to the right and black to the left. The colors of the tiny cycle 25 spots are reversed.
Is that the end of cycle 24, some 20 months before the expected month no. 132?
Certainly not. And solar cycle 25 has yet to begin as more spots with the same SC 24 signature are still in the pipeline. Moreover solar cycle 24 could resemble the end of solar cycle 5, see Figure 1. In the months during a minimum, spots can appear that belong to the next cycle, as there is a transition phase where spots of both cycles appear.
The solar minimum has started
It can still take quite some time before the next cycle makes its debut. Whether the current solar cycle turns out to be both an especially weak one and a short one is still unknown. Historically weak solar cycles have lasted longer than strong ones, It is difficult to say if solar cycle 24 will be an exception. We’ll keep you up-to-date!
Next is a comparison of the deviation from the mean (112 months into the cycle) of all the solar cycles recorded thus far since the 18th century:

Figure 3: Comparison of the previous 24 solar cycles recorded since the 18th century. The current solar cycle no. 24 is the weakest in almost 200 years. Only two other cycles were weaker.
For estimating the strength of the upcoming cycle 25, we regularly cast a look at the sun’s polar fields. The current data are suggesting that solar cycle 25 will be similar to the current solar cycle 24. Thus we have to anticipate that the solar activity will not be retuning to normal levels until at least 2031 – the year solar cycle 25 should end.
The good news is that it is highly improbable the sun will enter a Grand Minimum, such as the one that occurred from 1645 – 1715, the period known as the Little Ice Age.
===========================
As solar activity wanes, Arctic sea ice surprises
It is well known that frigid phases on the planet are associated with low solar activity. A number of papers, for example, have linked the Little Ice Age of the 17th century to the low solar activity of the Maunder Minimum. Other published papers link cold winters in Europe to low solar activity as well.
Now it’s sure: solar cycle 24 will go down as the weakest in close to 200 years. Thus all the news of massive snow and ice this winter over the northern hemisphere don’t come as a surprise for many scientists.
“Melt season hasn’t started yet”
Arctic sea ice has in fact stabilized over the past 10 years. For example Japanese skeptic blogger Kirye of KiryeNet tweeted here: “From the standpoint of Arctic sea ice volume, the melt season hasn’t started yet.”
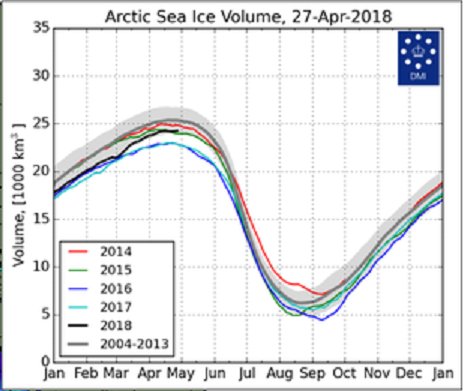
Source: Danish Meteorological Institute (DMI), via Kirye.
At Twitter Kirye posted an excellent GIF animation to compare Arctic sea ice thickness over the past 10 years:
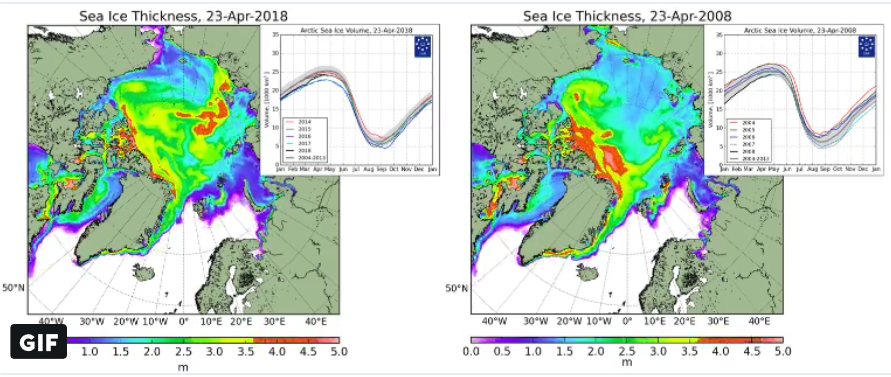
Image sources: Danish Meteorological Institute (DMI), via Kirye.
Though a bit below normal, clearly the Arctic ice appears to be rebounding, thus confirming a likely link to solar activity, as has been suggested by numerous scientific publications thus far.
Should solar cycle 25 turn out to be a weak one, then we’ll need to worry more about more cold icy winters over the next coming years. And expect embarrassed alarmist global warming scientists to blame it on the “The Atlantic overturning“.


The Antarctica sea ice extent is lower, is the thickness increasing there?
It will interesting to see if the increased Arctic thickness will allow greater extent to occur by providing stability.
Regards
http://www.nature.com/news/robot-reveals-surprisingly-thick-antarctic-sea-ice-1.16397
Previous observations of the thickness of Antarctic sea ice produced a mean draught — the depth between the waterline and the bottom of the ice sheet — of around 1 metre; the new work gives a mean draught of over 3 metres. And a previous maximum recorded ice-sheet thickness of 10 metres has now been increased to 16 metres.
http://www.nature.com/ngeo/journal/v8/n1/full/ngeo2299.html
Here we present three-dimensional (3D) floe-scale maps of sea-ice draft for ten floes, compiled from two springtime expeditions by an autonomous underwater vehicle to the near-coastal regions of the Weddell, Bellingshausen, and Wilkes Land sectors of Antarctica. Mean drafts range from 1.4 to 5.5 m, with maxima up to 16 m. We also find that, on average, 76% of the ice volume is deformed [thick] ice. Our surveys indicate that the floes are much thicker and more deformed than reported by most drilling and ship-based measurements of Antarctic sea ice. We suggest that thick ice in the near-coastal and interior pack may be under-represented in existing in situ assessments of Antarctic sea ice and hence, on average, Antarctic sea ice may be thicker than previously thought.
Thank you
[…] Full post […]
The first sunspots of cycle 25 have appeared apparently.
Check out the comments of lsvalgaard at this post at WUWT
https://wattsupwiththat.com/2018/04/11/solar-activity-crashes-the-sun-looks-like-a-cueball/
I had always thought that one cycle ended when another began but apparently there is overlap. The polarity of the sunspot identifying it as the first observed of a new cycle even before the minimum of the current has been reached. Very confusing to this layman.
Time will tell. Personally, I’m not impressed with Svalgaard. Here’s just one of several reasons.
http://www.landscheidt.info/?q=node/216
Leif’s conduct in the comment section in the below link is another example.
http://joannenova.com.au/2014/07/more-strange-adventures-in-tsi-data-the-miracle-of-900-fabricated-fraudulent-days/
I fully understand. Leif can be abrasive and overbearing. However, since a rocky start between us years ago, he has over the years taken the time to answer some questions from this layman and many others and I have appreciated it. The accumulation of knowledge takes interaction with all kinds and Leif has knowledge that he has shared with me and others. However that does not mean that I look upon him as the ultimate authority on all things solar as some do. He is however one authority from which I have learned.
This layman has no stakes in the experts game on the sciences of astronomy, climate, weather, statistics, etc, etc. I just seek the truth and wish to quash those who are obviously disingenuous or do their best to obscure the facts as we know them because it does not fit the Anthropological Climate Change meme. When you get down to it the real problem is Anthropological Science Change.
Are you absolutely sure about that? Nobody is obscuring facts, but some guys seem to be very selective about what they see as facts and what they call fake. Are you?
” Nobody is obscuring facts,”
Except you, who does his best to twist them into a fantasy based pretzel.
Ultimate FAILURE always, though
You can’t face the facts.
SebastianH 30. April 2018 at 2:30 AM | Permalink
I just seek the truth and wish to quash those who are obviously disingenuous or do their best to obscure the facts as we know them because it does not fit the Anthropological Climate Change meme.
Are you absolutely sure about that? Nobody is obscuring facts, but some guys seem to be very selective about what they see as facts and what they call fake. Are you?”
Why would I take the opinion of anyone seriously which doesn’t even know current events as related to the climate wars? It’s all over the news that Scott Pruitt is ending the use of “Secret Science” at the EPA!
http://thehill.com/blogs/floor-action/house/236132-house-passes-bill-to-prevent-epa-secret-science
So Seb you prove beyond any reasonable doubt that your the exact kind that needs to be quashed.
Thanks for highlighting how wrong skeptics can be, I guess.
Another TOTALLY EMPTY post from seb.
Remain UNAWARE of everything…
…its all you have.
From your link “with a special emphasis on Uranus” … I’m sorry, that’s a cheap one. But you keep posting these links to these hilarious websites … what can one do but laugh? 😉
Poor seb, actual science is beyond you, isn’t it.
All one can do is LAUGH at your posts.
Seb might could try and start to understand!
No, I don’t think he has that capability.
Understanding of anything to do with science, physic, maths etc beyond junior high level seems to be basically beyond him.
[…] Full post […]
Speaking of the Atlantic Overturning, it may simply be a Chinese Whisper. Who has firmly verified this assumed climate/weather phenomenon? Just posing the question.
https://rmets.onlinelibrary.wiley.com/doi/epdf/10.1256/qj.01.128
Is the Gulf Stream responsible for Europe’s mild winters?
It is widely believed by scientists and lay people alike that the transport of warm water north in the Gulf Stream and North Atlantic Drift, and its release to the atmos-phere, is a major reason why western Europe’s winters are so much milder (as much as 15–20 degC) than those of eastern North America (Fig. 1). The idea appears to have
been popularized by M. F. Maury in his book The physical geography of the sea and its meteorology (1855) which went through many printings in the United States and the British Isles and was translated into three languages. In the book Maury says:
[…] Continue Reading […]
http://lasp.colorado.edu/data/sorce/total_solar_irradiance_plots/images/tim_level3_tsi_24hour_640x480.png
and
http://lasp.colorado.edu/data/sorce/total_solar_irradiance_plots/images/tim_level3_tsi_24hour_3month_640x480.png
From
http://lasp.colorado.edu/home/sorce/data/tsi-data/
And about 1.5 W/m² increase in TSI from 2009 until 2015 and the decrease by the same amount until now, does not at all explain a warming (and cooling like this):
http://www.woodfortrees.org/plot/gistemp/from:2004/to:2019/plot/uah6/from:2004/to:2019/offset:0.43
(an increase of the anomaly by around half a degree) and
https://www.nodc.noaa.gov/OC5/3M_HEAT_CONTENT/heat_content2000m.png
(an increase of the ocean heat content by over 5*10^22 J with no decrease)
I mean, to achieve an increase of the OHC of that magnitude we would need to experience a permanent 1.5 W/m² TSI increase. 11 straight years of a TSI 1.5 W/m² above “normal” would do it. So did that happen? Not at all … therefore it is not the Sun. The variations, yes. The general increase in temperature/heat content, no.
I’ll guess we’ll see in the coming years.
Could, would, may … nothing definitive? Weren’t you complaining about this language recently? Anyway, “may” is a good cue. Looking forward to your May Kowatsch posting. Is the warm April now a sign that the ice age will not be coming in the next few years? 😉
Please study GHCN-M v4 from NOAA. The warming trend is gone…
Please elaborate.
Here
http://cfys.nu/graphs/GHCNM%2020180413.png
I have used a 5 degree grid. Main difference from v3.3.0 is a much larger station set.
Note that GHCN-M v4 is still in beta. The newest documentation is from autumn 2016. Since then data is updated updated daily.
If you want to check the data it is available here ftp://ftp.ncdc.noaa.gov/pub/data/ghcn/v4
Weird graph, I’ll check it out. But to get to your original claim, I see no “warming trend is gone” in that graph.
If you look more carefully you will note that beginning of 1900 shows much warmer than now hence the warming trend since then is gone. Same math on v3.3.0 gives a completely different result.
And that’s the weird part compared to version 3.
Agree!
If you test the math please let me know.
I will have more in next thread.
This might be a duplicate
http://cfys.nu/graphs/GHCNM%2020180413.png
First test failed…
I have use a 5 degree grid for the graph above.
NOAA GHCN-M v4 has been updated daily since autumn 2016. It is still in beta though. Data and dokumentation is available here: ftp://ftp.ncdc.noaa.gov/pub/data/ghcn/v4
Did you miss this one, Seb?
http://lasp.colorado.edu/home/sorce/files/2011/09/TIM_TSI_Reconstruction-1.png.
Looks like a downward trend may have started.
(Yes, may, might, could have — all those words that the warmistas use to persuade us that catastrophe is just round the corner can also be used to convince people that it isn’t. Not you, of course. You know so much better!)
A downward “trend” by 0.2 W/m2? We are certainly starting to have little ice age again …
When this
https://bobtisdale.files.wordpress.com/2013/03/28-noaa_upper_ocean_heat_content.png
….changes to the NOAA farce, its obvious where a fair amount of OHC is coming from.
And it you think its from the 700-2000m depth, then that PROVES its not CO2 or any other human warming.
And as we all already KNOW, it can’t have come from DWLWIR of any sort, because that is fully absorbed in just a few microns of the ocean surface, and the energy flux at that section is upwards such that DWLWIR has no way of heating the oceans. If it does anything at all, it would increase evaporation which leads to a cooling of the ocean skin.
You have become aware be now, that evaporation COOLS the surface, haven’t you seb??
If not, then go and talk to a dog about it, they apparently know more than you do.
I see you are STILL depending on the El Nino transients.. yet again PROVING that there is ZERO human cause of the slight but beneficial warming.
Or are you going to FANTASISE that CO2 causes El Ninos and deep ocean warming??
Huh? A graph from 2013? How about a more current version? Do you think it “changed” from your old one?
https://www.nodc.noaa.gov/OC5/3M_HEAT_CONTENT/heat_content55-07.png
https://www.nodc.noaa.gov/OC5/3M_HEAT_CONTENT/heat_content700m2000myr.png
And no, it doesn’t prove that it’s not CO2.
Would you please be so kind and stop assuming that “we all know”? You obviously don’t know how heat transfer works or rather have a very interesting fantasy of how it works. Decrease the upward flux and you have a heat content buildup. It’s that simple.
Come on … why do you have to be like that? First you claim that it doesn’t penetrate deep enough (seemingly assuming that the backradiation is some sort of additional energy input or something like that), then you claim whatever is absorbed actually would lead to cooling? You probably have an experiment in mind that would show us how this might work? Care to enlighten us?
*yawn* man, this is getting old …
“Do you think it “changed” from your old one?”
Sorry you are INCAPABLE of seeing the “adjustments” to ARGO data.
Everything else before that is TINY for a start, and MODELLED from VERY SPARSE data
“And no, it doesn’t prove that it’s not CO2. “
Yes it does.
DWLWIR from CO2 cannot possibly warm down to 2000 m. It barely penetrates a fraction of a mm.. Were you UNAWARE of that FACT, seb.????
WILFUL and DELIBERATE UNAWARENESS seems to be all you have to keep the AGW FARCE going in your mind.
“Would you please be so kind and stop assuming that “we all know”? “
Yep, its very obvious that YOU DON’T KNOW. !!
Its called WILFUIL IGNORANCE, and you own it. !!
“why do you have to be like that? “
Poor seb STILL doesn’t understand basic evaporation
You have a MASSIVE FAILURE TO LEARN. !!
“man, this is getting old … “
Yep, but NON-CO2 El Ninos is ALL YOU HAVE.
You are TOTALLY EMPTY of anything else.
We have given up expecting you to produce empirical evidence that enhanced atmospheric CO2 does anything more than enhance plant growth.
“Decrease the upward flux and you have a heat content buildup. It’s that simple.”
Evaporation INCREASES the upward flux in the ocean, seb
Do try basic scientific comprehension at some stage in your brain-hosed existence, instead of imagining things that just DON’T happen.
Neither does sunlight penetrate this far down. So what is your point?
Never witnessed a traffic jam or the backwater (is that the correct word?) behind a dam?
Great non-answer. So what is the experiment that proves that a body of water (and/or its surface) actually cools when you irradiate it with longwave infrared?
I am sure you can easily show us that this increase is greater than the decrease from a radiative imbalance. Waiting …
Again with the totally irrelevant analogies when you know you don’t know what you are talking about. No traffic jam, seb.
Sunlight and especially UV penetrate far into the ocean. DWLWIR doesn’t even penetrate the surface.
You still haven’t figured out that EVAPORATION COOLS the surface. So yes, you don’t understand. Try harder.
There is NO increase in radiative imbalance because that can possibly counter convection, you are fantasising…. as always.
Why are you evading my simple request?
You are saying the evaporation at the surface increases when the backradiation (downwelling infrared radiation) increases because it only penetrates the skin layer. You are saying that this increase in evaporation actually cools the surface.
So where is the experiment confirming this? Where is your explanation how this could possibly work? Should be simple, right?
http://onlinelibrary.wiley.com/doi/10.1111/j.2153-3490.1963.tb01399.x/pdf
“While short-wave radiation will warm both surface and subsurface layers, long-wave radiation will cause a cooling of the surface depending on the temperature and humidity of the air. … Differences between surface and subsurface water-temperature are caused by evaporation, long-wave radiation and exchange of sensible heat. The relative importance of these three components is discussed, especially with aid of observations under neutral conditions. Evaporation as well as back radiation contributes to a cooling of the surface of 0.1 to 0.2 centigrade under neutral conditions, while under diabatic conditions greater surface temperature deviations are caused by heat exchange.”
—–
https://www.arm.gov/publications/proceedings/conf07/extended_abs/minnett_pj.pdf
Located at the upper limit of the molecular boundary layer, the skin temperature is generally a few tenths of a degree cooler than the temperature a few millimeters below it because of heat loss by sensible and latent heat fluxes as well as outgoing longwave radiative fluxes
—–
fvcom.smast.umassd.edu/Courses/MAR555/Suppl_Reading/Fairall_etal_1006.pdf
“The cool skin represents a few tenths of a kelvin cooling by radiative and turbulent fluxes in the upper millimeter of the ocean”
Pretty obvious where any recent heating has come from, isn’t it seb
https://s19.postimg.cc/bjxzgv5c3/TIM_TSI_Reconstructionheating.png
All that absorbed solar energy making gradually its way down to 2000m.
And surly you aren’t UNAWARE enough to think TSI is the only solar variable during times of high solar output.
Surly you haven’t got any empirical evidence that its anything to do with human CO2
Have got any empirical evidence that it’s the Sun? The tiny increase in that reconstruction graph would be not nearly enough to explain the warming.
For a few years per cycle up to 0.4 W/m2 difference. The average increase over that period per m2 Earth surface is smaller than 0.1 W/m2.
Sun is the only source of energy , seb
GET OVER IT !!
And still thinking that TSI is the only solar variable.. DOH.
You really need to do some actual LEARNING seb, instead of just following the AGW mantra.
But you seem to choose to remain PURPOSELY and DILIGENTLY UNAWARE of basically everything.
According to Feldman et al. (2015), the 22 ppm increase in CO2 concentration resulted in a 0.2 W m-2 per decade radiative forcing.
Due to changes in the Sun’s geomagnetic constitution that affect changes in decadal-scale cloud cover over the course of the last 3 decades, the forcing from absorbed surface solar radiation via the reduction in cloud cover is about 10 times greater than the (tiny) alleged per decade forcing from CO2 concentration changes. And, unlike CO2, SW radiation resulting from changes in cloud cover can penetrate by 10s of meters into the ocean, whereas IR cannot penetrate past the hair-thin skin layer. Therefore, even tiny changes in cloud cover can modulate ocean heat content on magnitudes-greater scale than tiny parts-per-million (0.000001) changes in atmospheric CO2 — even assuming that the forcing values for CO2 are not just theoretical and model-based, but real.
http://www.sciencemag.org/content/308/5723/850.abstract
“Long-term variations in solar radiation at Earth’s surface (S) can affect our climate, the hydrological cycle, plant photosynthesis, and solar power. Sustained decreases in S [surface solar radiation] have been widely reported from about the year 1960 to 1990. Here we present an estimate of global temporal variations in S by using the longest available satellite record. We observed an overall increase in S [surface solar radiation] from 1983 to 2001 at a rate of 0.16 watts per square meter (0.10%) per year [1.6 W m-2 per decade].”
—
https://link.springer.com/article/10.1007/s00704-016-1829-3
“The present paper describes how the entire series of global solar radiation (1987–2014) and diffuse radiation (1994–2014) were built, including the quality control process. Appropriate corrections to the diffuse component were made when a shadowband was employed to make measurements. Analysis of the series reveals that annual mean global irradiance presents a statistically significant increase of 2.5 W m−2 (1.4 %) decade−1 (1988–2014 period)
—
http://www.atmos-chem-phys.net/13/8505/2013/acp-13-8505-2013.html
“[T]here has been a global net decrease in 340 nm cloud plus aerosol reflectivity [1979-2011]. … Applying a 3.6% cloud reflectivity perturbation to the shortwave energy balance partitioning given by Trenberth et al. (2009) corresponds to an increase of 2.7 W m−2 of solar energy reaching the Earth’s surface and an increase of 1.4% or 2.3 W m−2 absorbed by the surface.”
—
http://www.atmos-chem-phys.net/12/9581/2012/acp-12-9581-2012.html
“The Earth’s climate is driven by surface incident solar radiation (Rs). Direct measurements have shown that Rs has undergone significant decadal variations. … By merging direct measurements collected by Global Energy Budget Archive with those derived from SunDu [sunshine duration], we obtained a good coverage of Rs [surface incident solar radiation] over the Northern Hemisphere. From this data, the average increase of Rs [surface incident solar radiation] from 1982 to 2008 is estimated to be 0.87 W m−2 per decade [2.3 W/m-2 total]”
—
ftp://bbso.njit.edu/pub/staff/pgoode/website/publications/Palle_etal_2005a_GRL.pdf
“Traditionally the Earth’s reflectance has been assumed to be roughly constant, but large decadal variability, not reproduced by current climate models, has been reported lately from a variety of sources. There is a consistent picture among all data sets by which the Earth’s albedo has decreased over the 1985-2000 interval. The amplitude of this decrease ranges from 2-3 W/m2 to 6-7 W/m2 but any value inside these ranges is highly climatologically significant and implies major changes in the Earth’s radiation budget.”
Yep, in a decade. Now come to the realization that it is a kind of permanent forcing and we have been at it for more than a decade.
So is the difference of the solar forcing (at the surface) between day and night or the seasons. What are you trying to say?
You have that penetration thing out of your head, Kenneth (and AndyG55). When you put a heat source into a vacuum and insulate it by constructing a sphere of whatever material around it, the heat source will increase in temperature. No penetration of any kind needed. That is simply physics. I have some analogies for you here, but since you don’t like simplifications at least try to understand the physics of heat transfer directly.
http://www.srh.noaa.gov/jetstream/ocean/layers_ocean.htm
This surface layer is also called the sunlight zone and extends from the surface to 660 feet (200 meters). It is in this zone that most of the visible light exists. With the light comes heating from sun. This heating is responsible for wide change in temperature that occurs in this zone, both in the latitude and each season. The sea surface temperatures range from as high as 97°F (36°C) in the Persian Gulf to 28°F (-2°C) near the north pole. The sea surface temperature also “follows the sun”. From the earth’s perspective, the sun’s position in the sky moves higher each day from winter to summer and lower each day from summer to winter. This change in the sun’s position from winter to summer means that more energy is reaching the ocean and therefore warms the water.
—
http://www.tellusa.net/index.php/tellusa/article/view/25313
The incoming solar irradiance, which is absorbed by the upper ocean, is the main energy source in the ocean heat budget, and hence strongly impacts the oceanic thermal structure, heat transport and the global circulations. Shortwave radiation is attenuated exponentially with depth. The attenuation depth (e-folding depth) depends on the wavelength and biogenic components of the water. Traditionally, the water types are classified Jerlov I, IA, IB, II and III (Jerlov, 1976). The shortwave attenuation depth (SWAD) in open oceans (almost Jerlov I) is about 20–30 m, and it decreases with increasing water turbidity, particularly in coastal regions.
So incoming solar radiation does not need to penetrate past the skin layer to warm the subsurface ocean waters. And this is “simply physics”. Wow.
“You have that penetration thing out of your head, “
ie. its against the seb mantra and totally destroys his fantasies of CO2 warming.
LEARN SOME BASIC SCIENCE and PHYSICS , seb
You are seriously embarrassing yourself and all AGW apostles, with your wilful and deliberate anti-knowledge.
The solar radiation is the primary source of the energy, Kenneth. The downwelling longwave radiation is not an additional source.
Solar radiation can also heat opaque objects without penetrating the surface. Still, the presence of an insulation layer that radiates back to the object causes its heat content (and thus the temperature) to be higher than without that layer.
Is that so hard to understand?
As a thought experiment, you can also eliminate the Sun from the equation and replace it with an equally sized heat source inside the oceans. The oceans will still radiate to space and an increase of the backradiation will still cause a buildup of the heat content until temperatures are reached where everything is in balance again.
Maybe someday you’ll understand. Until then it’s kind of pointless to discuss this or anything having to do with heat transfer with you. Wouldn’t you agree?
How much higher is the heat content due to the insulation effect (the CO2 “blanket”) relative to the level of warmth generated in the first place from variations in albedo affecting how much SW heat is absorbed by the oceans? What the difference in magnitude of changes in CO2 vs. changes in say, clouds, SebastianH? I ask because the scientific literature is teeming with statements about changes in shortwave radiation (as influenced by cloud changes, for example) completely overwhelming the radiative changes assumed to be connected to the CO2 “blanket”. And yet you seem to think the CO2 “blanket” is just as powerful as SW in determining OHC. Why do you believe in that?
http://www.indiaenvironmentportal.org.in/files/file/cloud%20radiative%20forcing.pdf
Water vapour and cloud are the dominant regulators of the radiative heating of the planet. ..The greenhouse effect of clouds may be larger than that resulting from a hundredfold increase in the CO2 concentration of the atmosphere.
—
http://www.witpress.com/elibrary/wit-transactions-on-engineering-sciences/83/27156
What can be said is that LWIR from GHGs will have a different and smaller effect on OHC than a similar amount of solar radiation as the LWIR is nearly totally absorbed in the evaporation layer while nearly all short wave solar radiation is not.
It is established physics that the oceans are opaque to the long wave radiation reemitted by GHGs while short wave solar radiation readily transports energy to a depth of many meters. Long wave GHG radiation is quickly returned to the atmosphere and, eventually, space as latent heat of evaporation as is demonstrated in “Appendix 1”. If established, this fact can only lead to the conclusion that a Radiative flux imbalance at the TOA caused by increasing GHGs will likely be restored to balance more quickly than a similar sized flux imbalance caused by changes in solar radiation.
—
http://www.indiaenvironmentportal.org.in/files/file/cloud%20radiative%20forcing.pdf
The size of the observed net cloud forcing is about four times as large as the expected value of radiative forcing from a doubling of CO2. The shortwave and longwave components of cloud forcing are about ten times as large as those for a CO2 doubling.
—
http://www.sciencemag.org/content/267/5197/499.short
Ship observations and ocean models indicate that heat export from the mixed layer of the western Pacific warm pool is small (<20 watts per square meter). This value was used to deduce the effect of clouds on the net solar radiation at the sea surface. The inferred magnitude of this shortwave cloud forcing was large (≈ – 100 watts per square meter) and exceeded its observed value at the top of the atmosphere by a factor of about 1.5. This result implies that clouds (at least over the warm pool) reduce net solar radiation at the sea surface not only by reflecting a significant amount back to space, but also by trapping a large amount in the cloudy atmosphere, an inference that is at variance with most model results.
—
http://www.realclimate.org/index.php/archives/2006/09/why-greenhouse-gases-heat-the-ocean/
Of course the range of net infrared forcing caused by changing cloud conditions (~100W/m2) is much greater than that caused by increasing levels of greenhouse gases (e.g. doubling pre-industrial CO2 levels will increase the net forcing by ~4W/m2)
—
CO2 is NOT an insulating layer in any way shape or form
It actually has LOWER insulating properties, (actually measured) than normal air, because it it is radiatively active gas.
Your lack of basic physics, and your non-credible attachment to mindless AGW mantra keeps tripping you up.
Showing your constant wilful NON-AWARENESS
“and an increase of the backradiation “
OOPS… poor non-aware Seb is WRONG YET AGAIN.
https://s19.postimg.cc/aam12xls3/ceres_dwlwir_decreasing.png
Without the recent 2015-2017 (inclusive) El Nino RELEASE OF ENERGY FROM THE OCEANS, its pretty obvious what has been happening since the previous El Nino settled down
http://www.woodfortrees.org/plot/uah6/from:2001.2/to:2015.2/plot/uah6/from:2001.2/to:2015.2/trend
By skeptic logic, you should see a steep warming from 2008 in this graph. Just like you see a stable Arctic ice extent from 2007/2008 in such graphs 😉
Whether or not an El Nino actually releases energy from the oceans depends on a few variables, doesn’t it? During an El Ninos less cold water from below reaches the surface and the warm water from the surface can continue to get warmer. A warmer surface transfers more energy to the atmosphere, thus affecting climate.
It’s not an event where some warm water from some kind of storage gets pushed to the surface for the energy to be released. Do you agree or disagree?
https://www.nodc.noaa.gov/OC5/3M_HEAT_CONTENT/heat_content55-07.png
How much energy was released? Can you make it out on that graph when it happened? Has the following La Nina managed to increase OHC again?
El Ninos are a warm surge of water to the surface, of course they release energy.
And thanks for the graph showing continued SOLAR warming of the oceans, even it is somewhat “adjusted”
Now lets see the evidence that it is anything BUT Solar energy.
Plenty of that Sun’s energy, you know.
Grand Solar Maximum. UV levels still up.
Cloud cover decreased, so dwlwr is decreasing
https://s19.postimg.cc/aam12xls3/ceres_dwlwir_decreasing.png
WOW…. DWLWR DECREASING while CO2 is rising..
How can that be ! 😉
Could it be that any possible DWLWR from CO2 is such a tiny thin, LOW-POWER radiation that is thermalised to the atmosphere, and is TOTALLY DOMINATED by that from H2O.. to the point where it is TOTALLY INSIGNIFICANT..
That would certainly explain why there is ZERO EMPIRICAL EVIDENCE that enhanced atmospheric CO2 does anything except enhance plant growth.
Wow, the Sun drives climate change…who knew?
It would seem to be a hypothesis worth considering.
Scientists are people who like hypotheses. They look at the data and see if supports the conclusions.That is what scientific discussion is like,Sebastian.
It’s politicians who just take up positions and refute everything others say in order to look all wise and of superior intellect. I don’t advise you to take up the political attitude on a scientific blog.It is entirely the wrong place.
Take heart, there must be political blogs with positions nearer to your feelings on these matters which you could join, and you should be very successful in debate there.
Nope, that’s what skeptics do.
Well you have never been able to refute anything…
… and certainly you have never conveyed even the [snip]
[…] F. Bosse and Prof. F. Vahrenholt, April 28, 2018 in […]
[…] Fonte: No Tricks Zone […]
[…] The No Tricks Zone reports: […]
I just love the way climate “scientists” throw around anomalies like “x” W/m2 such as Trenberth et al quote in their updated “Energy Budget” without thinking through the consequences of what they claim.
Trenberth et al quote a “net absorbed” anomaly of 0.9 W/m2. Hansen once quoted a 2 W/m2 anomaly.
Using average values of Atmospheric mass of 5.1 x 10¹⁸ kg, the surface area of Earth of 5.101 x 10¹⁴ m2, the specific heat of ordinary air and the standard heat flow equation of Q = mass x specific heat by delta T one can easily estimate that an anomaly of 0.9 W/m2 should produce a delta T of 8.96 x 10⁻⁸°C per second.
As there are 31,536,000 sec per annum this means a steady input of an extra 0.9 W/m2 should produce a delta T of 2.84°C for each year such an anomaly exists.
Clearly this has never been observed and is simple evidence that the mathematics employed by the IPCC is far from “settled science” !
I won’t even mention the absurdity of the maths they teach University students about the “greenhouse effect” which even so called sceptics accept as real despite being easily debunked.
There will be a grand minimum.
Frank Bosse and Prof. Fritz Vahrenholt, I have been aware of the 12-year sunspot cycle for many years. In your Figure 3, there appears to be another cycle going on (with about a 10 solar cycle duration, about 120 years). What understanding is there of this cycle, and what might its physical basis be?
Thanks…
Geoff
… [Trackback]
[…] Read More: notrickszone.com/2018/04/28/solar-activity-flat-lines-cycle-24-weakest-in-200-years-link-to-recent-northern-hemisphere-ice-rebound/ […]