40-year veteran meteorologist Joe Bastardi at WeatherBell’s Saturday Summary shows how the Earth’s surface has cooled dramatically over the past three years and that Arctic sea ice is piling up.
Hurricane threat to East Coast due to natural factors
First at his most recent Saturday Summary, the 40-year meteorologist first warns that in-close developing hurricanes of the sort seen in the 1930s are a risk to the US East Coast this year, due the current Atlantic temperature pattern. The reason has nothing to do with CO2 in the atmosphere, but because of natural sea surface temperature cycles.
Sea surface temperatures see “pretty dramatic turnaround”
Next Joe Bastardi illustrates the stark sea surface cooling the globe has seen over the recent years. The following two charts show the “pretty dramatic” cooling that has occurred over the past three years, 2015 vs 2018:

Cropped from Weatherbell Saturday Summary.
The two images above show the surface temperatures of the globe for the years 2015 – 2018. Note the profound cooling that has taken place from 2015 to 2018.
Bastardi calls it “a pretty big flip” and “a pretty dramatic turnaround”.
Arctic turns frigid
As sea surface temperatures around Greenland and in the Arctic are currently below normal, they are having an impact on Arctic surface temperatures this summer.
Joe Bastardi notes that according to the Danish DMI, Arctic temperature has been below normal over the entire summer:
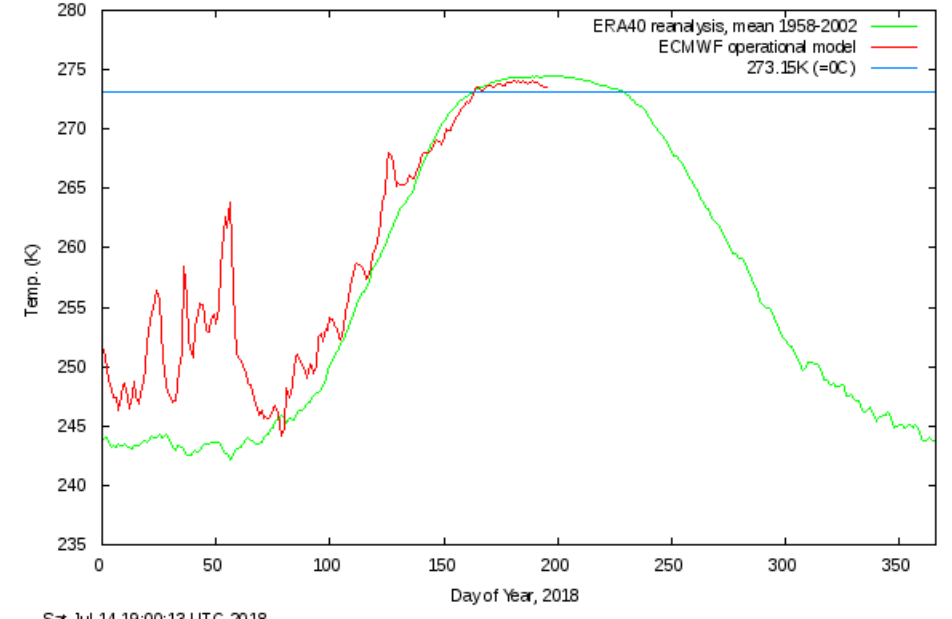
Moreover, Arctic mid-summer temperatures, north of 80°N latitude, have dipped to near freezing over the past days. This is likely in large part linked to the cold North Atlantic sea surface temperatures we’ve been witnessing. All this suggests ocean cycles, and not CO2, are the real Arctic drivers.
Snow and ice climbing past decade
The cold polar temperatures are naturally having an impact on Arctic snow and ice.
Japanese blogger Kirye tweeted here that Arctic sea ice volume is currently at the 4th highest level since 2003, thus defying the dire alarmist predictions of Arctic sea ice disappearing by now.

Arctic sea ice volume (m3) has eased off from third place and is now at the 4th highest level since 2003, and showing an upward recovering trend over the past decade. Chart: Kirye.
Also at the 11:50 mark of his Saturday Summary video, Joe shows that Arctic sea ice extent is well above the levels seen over the previous years.
Greenland gets buried in snow
According to Kirye here, warming and melting have also been AWOL in Greenland, which has been seeing a dramatic snow and ice mass balance increase:
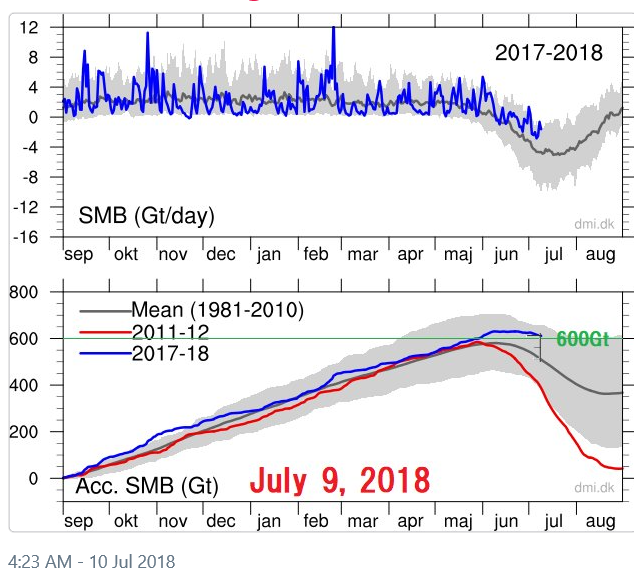
Chart: DMI.
“Total nonsense” concerning Thailand monsoons
In his Saturday Summary, Joe Bastardi also sharply criticized the climate ambulance chasing we’ve witnessed from hysterical climate alarmists, who are desperately grasping at any straw they can find to keep the climate panic on life-support.
It was recently claimed that the group of Thailand teenagers and their coach got trapped in a cave due to monsoon rains which were induced by global warming!
But Joe Bastardi presents a chart showing that this year’s monsoon activity in Thailand is completely within the range of natural variability:
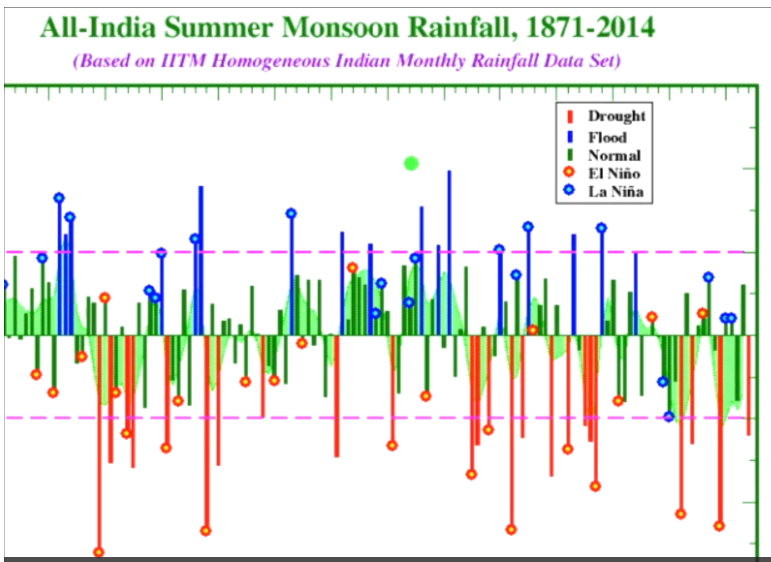
Chart: WeatherBell Saturday Summary.
Bastardi calls the claim the kids got trapped because of climate change “total nonsense”, and points out that the monsoons over Thailand over the past five years have been normal to even below normal!


Note, The biggest drop in SST has been over the past 2 years, There was a super nino coming on in 15, but the drop from last year to this year is impressive, So I am more impressed with the 1 year, because in a super nino its going to be dramatically warmer in that area of the Pacific, The real evidence in Thailand are the precip charts I show which through July 1 had Thailand at or below normal precip The Indian monsoon having no changes overall would imply the SE asian monsoon is the aame as the IOD is a big deal for both. A look at the video (HOttest part of summer ends early again like last year for 75% of nation) is suggested
Thanks,Pierre and Joe for this round of climate-truth. I am sharing it on blogs I read from the U.S., so you might have a few more readers than usual.
Pierre, you deserve a medal, for your indefatigable investigations and publications into real climate science research. Thank you very much.
[…] Global Sea Sea Surface Temperatures Have Seen “Pretty Dramatic Turnaround,” Says 40-Year Meteoro… […]
Funny some people hates when things are not pointing to Armageddon
Zoom into 2015-2018 in you graph (or better at wood fortress) and will see what Joe states is 100% accurate.
Will be interesting to see how it continues though…
And for the last 3 years, total ocean heat content has continued to increase at the rate of 3.4+ trillion 100-watt light bulbs running 24/7. (Average warming rate from March 2005 to present. If you just count the 3 year period from June 2015 to Mar. 2018, the warming rate is even steeper.)
Data source:
Graph: Click on “2” at https://www.nodc.noaa.gov/OC5/3M_HEAT_CONTENT/
or for the numeric data
https://www.nodc.noaa.gov/OC5/3M_HEAT_CONTENT/basin_data.html
(Click on World → 0-2000 all months)
(For those readers that would like to verify the math, one 100-watt light bulb for one second = 100 Joules. The least squares slope of the red data in the above graph is 1.077E22 Joules per year.)
I assume that this referencing (or the Four. Hiroshima. Bombs. Of. Heat. Per. Second. comparison) sounds scary to those who don’t know any better how ocean heat content changes/recirculates or the mechanisms that drive these oscillatory changes.
The same people peddling this alarmist language also say things like the Greenland ice sheet has lost 9 trillion tons (!) of ice in the 110 years between 1900 and 2010. What they don’t tell us is that 9 trillion tons of ice lost amounts to the meltwater equivalent of less than 1 inch of sea level rise – about 9/100ths of an inch per decade. Of course, one inch of ice melt equivalent in 110 years doesn’t sound scary enough, so they invent ridiculous Hiroshima-like “equivalents”, like saying that inch of water spread out over the entire surface ocean area, if collected and then dumped only onto the U.S. highway system roads, would “submerge the entire U.S. interstate highway system 98 feet deep — and to do so 63 times over“. Because, um, yes, sea water is indeed gathered up and dumped onto the U.S. highway in the real world.
Not to mention that satellite observations have shown that more land area is above sea level today than 30 years ago, meaning that islands and coasts and beaches are growing, not shrinking, all over the world. In other words, the main threat of global warming/ocean heat content increase — sea level rise engulfing the coasts — has not been happening for decades. On net, land uplift is occurring faster than sea levels are rising, blunting any alarming “threat”.
We’re not falling for the alarmist-sounding language (3.4 trillion 100-watt light bulbs per second!) you’re peddling, Bill. We’re skeptics. You’re going to need to provide evidence that something unusual is happening that falls outside the range of natural variability…especially considering there is plenty of evidence to the contrary:
450 Non Warming Graphs (1)
450 Non Warming Graphs (2)
Kenneth, didn’t we learn from that Khan paper that the melt water from the poles can not reach the tropical regions because water has to go uphill or something like that? So there can be no doubt that the Greenland melt is very local … or maybe not. Just try to be consistent with your skepticism (and use the metric system). That would be great 😉
No, that’s not what “we” learned. You are doing what you usually do in claiming that absolutist statements were made about what melt water can not do.
So there’s no doubt…or maybe not. Clear as mud what you’re writing about here.
I used “inch” in this case because that’s the measuring system used in the Washington Post article referenced for the Staggering. 9. Trillion. Tons. Of. Ice. Lost. comparison. Why are you niggling when you have so many of your own issues with the English language that are graciously glossed over by those who are fluent here?
Another NONSENSE attention-seeking post from Mr Evidence Free.
Just “believe” whatever the AGW priests tell you seb, zero scepticism.
You have NOTHING else to offer.
“didn’t we learn … “
No seb, you did NOT learn, not anything, at all.
Your baseless arrogance and deep-seated AGW zealotry will never allow you to.
You adamantly defended the Khan paper and now you are saying that what this author wrote is not what you are claiming or what you believe to be true? So why did you defend this nonsense then?
If your strategy is to bring up ridiculous claims in papers to shed doubt on climate science results without making those claims your own, then … I don’t know what then. What kind of strategy is that?
No, I’m saying that what you characterized as what the author wrote is not actually what he wrote. You misrepresented what he wrote, as usual. And your claim that I “adamantly defended the Kahn paper” is also inaccurate.
Furthermore, it is not true that if I feature a paper on this cite that it automatically means I must agree with all that is written in it.
Light bulbs use very little power, Bill
Especially not the one in your had.
BIG numbers scare little billy. BOO !!
Joe is talking about SST!
So 4000 Billion lightbulbs heats 1.35 Billion cubic km ocean
That is 2 962 per cubic km or 0.000002962 lightbulbs per m3.
Sounds really hazardous. How do we stop this???
Perspective little billy.
See that little squiggle at the end.
https://s19.postimg.cc/bbiicubg3/OHC_rosenthal-2013-figure-2c-annotated.png
And I repeat, you have ZERO EVIDENCE that the slight ocean warming has anything to do with human anything.
It’s ONLY natural.
Who ever made this graph did it wrong. The actual “squiggle at the end” should be at least half a degree IWT high …
But thanks for pushing a lie, I guess. Just shows what skeptics would do to not let reality become real in their heads.
NO seb.. you are wrong again.
Global ocean change is barely 0.2ºC from 1970 (coldest period since 1900) and 2010.
http://www.climate4you.com/images/World3monthTemperatureSince1955Depth0-700m.gif
Pacific has warmed at by about 60% the tiny global ocean warming. Graph looks like its in the ballpark, around 0.12ºC
Furthermore, according to NOAA data for Pacific 0-700m, the change in temperature from 1969-2010 has a trend of 0.026ºC decade x 42 year = 0.11C
Seb faceplants in his own BS, YET AGAIN. !!
And there is zer0 evidence that humans had any part at all to play in that tiny amount of warming.
And from 1955 -2010, trend from NOAA is 0.0172ºC/decade = 0.096ºC in 56 year (inclusive)
WOW.. I’m petrified with fear !!
What amount would you estimate that little red squiggle to represent, seb ?? 😉
Yes. Global ocean and 0-700 m layer.
However:
Do you know what this graph of yours shows? Certainly not temperature of the global ocean in 0-700 m depth.
Maybe reading the paper this graph is taken from helps:
https://www.researchgate.net/publication/258215955_Pacific_Ocean_Heat_Content_During_the_Past_10000_Years
And maybe, by interpreting figure 3 and 4 correctly (and include current Pacific Ocean OHC measurements) you’ll find out, that the modern OHC rise is way bigger than what is drawn into that graph of yours for skeptic’s propaganda purposes.
So stop lying and “faceplanting” all the time. Thanks.
This is what we mean about your PETULANT ARROGANCE not allowing you to accept when you have MASSIVELY GOOFED UP
Give it up seb.. stop digging yourself deeper and deeper into your own BS.
The graph says Pacific 0-700, the data at the end is correct up to 2010. NOAA data confirms it.
GET OVER IT. !
btw, NOAA Data for global oceans shows a trend of 0.0117ºC/decade from 1955-2010.
That equals 0.06ºC over the 55 years.
Get the data.. check for yourself
…or just carry on with your juvenile bluster and DENIAL of reality.
And wipe that crap off your face, the tears are showing.
NOAA global oceans show a trend of 0.0150C/decade from 1955-2017 (62 years)
How many degrees is that seb?
The “squiggle” at the end is about 0.1C
Simple maths seb.
BIG RAG needed for you, seb.
Has Bill Butler taken over from our usual resident troll, or is it a pseudonym?
They sound equally misguided.
Most newspapers have a comics section B&T I enjoy reading them for a laugh. Its probably more like slapstick, you know they are going to say something dumb but you laugh when they say it anyway.
Perhaps the baton has been passed. Or perhaps they’re just taking turns tripping over themselves. Different performers, same substandard performance.
Nope, its just been the weekend in Germany, seb is not at work, so doesn’t have time to post his non-science.
Bitter&twisted,
It’s Sunday. SebastianH doesn’t usually turn-up on Sunday. I wonder why?
Go figure.
Protesting with Antifa?
Conducting a sermon?
Maintaining windmills?
Cleaning solar panels?
@bullspit bill
Ah yes, the vaunted temperature “anomalies “ – wink wink, …
https://m.youtube.com/watch?v=kwIixU1JyDU
Never have so many made so much fuss over so little for so long.
“bullspit bill”
Isn’t that great. You have nothing, so you refrain to mispronouncing names as a childish attempt to annoy you conversation partner. Do you think that is an effective strategy if you want to convey that skeptic talking points should be taken more serious?
First link.. some to some idiot’s anti-science propaganda web site
Second link contains zero information just descriptions
Third link to a comedian AGW propaganda web site.
As usual Bill… You have NOTHING. !
Especially NOTHING to show that humans have been the cause of that slight warming.
Do you actually find it unusual the oceans might warm up just a tiny amount when the solar activity goes through a period of increased activity, like the Grand Solar Maximum
Did you know that the 1970s was the coldest period since 1900 in many parts of the world. Good place to start if you are looking for warmist propaganda. 😉
And its Accuweather that should be kicked out for inaccurate forecasts.
They have been taken over by alarmista dolts.
Your durangobill link shows a 0.2° to 0.4° decline over the last two/three years. Which you can argue is meaningless but you can’t argue doesn’t exist.
You can do yourself a favour and stop pretending that Cook’s site has anything whatever to do with either scepticism or science. Why should anyone be interested in the ramblings of a failed cartoonist?
And basically every thing from SkS’s response to Joe’s comments is a MISINFORMATION or just downright evidence free nonsense.
To be expected from them.
You really need to upgrade your source of non-information, Bill, or keep coming across as a complete fool.
Bill Butler,
From your link to skeptical (anti-)science on Joe —
“CO2 is just a trace gas”
[skeptical (anti-)science] Many substances are dangerous even in trace amounts; what really matters is the total amount of CO2 in the atmosphere.
There is no evidence either now or from what is known of the past that show that CO2 is dangerous to the climate — Joe is correct!
We are well within the levels of natural variability on all counts — see https://notrickszone.com/category/natural-variability/
“Human CO2 is a tiny % of CO2 emissions”
[skeptical (anti-)science] The natural cycle adds and removes CO2 to keep a balance; humans add extra CO2 without removing any.
This question and its answer presumes that CO2 influences the climate, to date there is little if any indicative proof that it does. Man’s input to the near disastrous level of 0.04% of the atmosphere is so small (at about 5% of this level) as to be trivial. Joe is correct!
“It hasn’t warmed since 1998”
[skeptical (anti-)science] Every part of the Earth’s climate system has continued warming since 1998, with 2015 shattering temperature records.
Apart from the El Nino effects the global temperatures are flat. see https://lh3.googleusercontent.com/-xAdiohdkcU4/VjpSKNYP9SI/AAAAAAACa8Q/639el4qIzpM/s720-Ic42/monckton1.png Joe is correct!
“It’s cooling”
[skeptical (anti-)science] The last decade 2000-2009 was the hottest on record.
See above! Joe is correct!
“It’s the ocean”
[skeptical (anti-)science]The oceans are warming and moreover are becoming more acidic, threatening the food chain.
If the oceans are becoming warmer then they can not take-up much more CO2, if they cool and take-up more CO2 then they are well within natural bounds and can never become acid, they just become very, very slightly less acidic. There is after all a lot of magnesium and calcium buffering salts in the oceans.
See https://notrickszone.com/category/ocean-acidification/
Joe is correct!
“It’s the sun”
[skeptical (anti-)science]In the last 35 years of global warming, sun and climate have been going in opposite directions
The sun is heading towards a more torpid state (unlike the very very active state of the last 25 years), and history shows that this will lead to a generally cooler world. Joe is correct!
See https://notrickszone.com/category/solar-sciences/
“Roy Spencer finds negative feedback”
[skeptical (anti-)science] Spencer’s model is too simple, excluding important factors like ocean dynamics and treats cloud feedbacks as forcings.
Dr Spencer’s model, despite its elegant simplicity, has proved to be more accurate than the IPCC preferred models. Note that NO model show reality particularly well — the IPCC’s models are just less good at showing reality than most.
Joe is correct!
“We’re heading into cooling”
[skeptical (anti-)science] There is no scientific basis for claims that the planet will begin to cool in the near future.
There is plenty of evidence. Just a look at the many posts HERE and https://notrickszone.com/category/solar-sciences/ which show exactly that.
Joe is correct!
Using skeptical(anti-)science as the source for climate understanding is (IMO) little more than listening to rumors about weather, or worse paying attention to SebastianH at this site. Yes it will give the consensus view but not much knowledge, understanding, or any skepticism.
There are too many unknowns for the likes of the IPCC, or Climate Alarmists like Seth Borenstein, David Brock, Al Gore, James Hansen, Katharine Hayhoe, Naomi Klein, Jon Krosnik, Michael Mann, Bill McKibben, Michael Oppenheimer, Naomi Oreskes, Ben Santer, George Soros, Tom Steyer, Kevin Trenberth, Sheldon Whitehouse, etc., etc… to be able to say that the globe will overheat, or that the climate is behaving unnaturally. Despite all their individual qualifications, their 30 years of alarmist blather has not amounted to anything definitive about climate predictions or predictability. They’ve only encouraged an international political climate of posturing, virtue signaling, and a BIG waste of public (our taxes) money! Just shows how dumb politicians, and the poor misinformed saps that vote them in can be.
In summary…
“It Ain’t A Fit Night Out For Man Or Beast”
And after that horrible winter it’s sooo very hot this summer that, …wait, what? It AIN’T?!
http://www.drroyspencer.com/2018/07/summer-causes-climate-change-hysteria/
Do tell. Do tell.
Hmmmm
So, how’s a body gonna get hysterical over that? Don’t seem fair, somehow, depriving us of our natural born right to complain about the weather, especially the weather we ain’t never had!
Pierre, are you sure those images aren’t showing the anomaly? The actual temperatures look a littlebit different: https://earthobservatory.nasa.gov/global-maps/MYD28M
I don’t know if this is news to you, but Arctic or polar amplification is all about ocean and wind currents pushing the heat from the tropics northward. There is no big local heating effect caused by the CO2 in relatively cold regions. It’s all about the transport of the increasing heat content towards the poles. Cycles are the drivers for this. Pretty obviously.
You seem to be focused on ice volume now and even made up the story that climate scientists would be switching over to volume instead of area recently. Why?
Ice isn’t going to melt in regions with -20^C (https://www.ventusky.com/?p=73;-2;2&l=temperature-2m). It’s all about how far north the ice melts. If it turns out to be cooler at the northpole, great. The Arctic will still be ice free according to the definition even if the volume doesn’t further decrease and ice becomes thicker. Why? Because thicker ice at the same volume means less area. And as previously said, a 5 meter thick ice block with the same summer volume as in the last years would make the Arctic ice free (less than 1 million sq. kilometers of ice extent) in the Summer. Got it?
As dramatic as back in 2015/2015? https://notrickszone.com/2015/08/31/danish-meteorological-institute-data-show-greenland-ice-mass-balance-has-grown-impressively-since-2014/
As dramatic as last year? What is the runoff currently? Do you think the net mass of Greenland will be growing this year? Wan’t to bet?
This Joe Bastardi fandom of yours is astounding. Wouldn’t have thought that you skeptics would fall for what single people put out in the world. But here we are … where is that “veteran journalist” who writes for “Die Welt”? Where is the veteran something Kowatsch who tells us that Germany is getting colder every month? Will July finally be cooler than normal again? 😉
Of course you’re free to choose data that confirm alarmist views and suits whatever emotional needs there may be. The science is very much in dispute…assert as much claim to high authority as you wish.
When it is raining and someone says it is wet outside and the other person says it is dry outside, then the science of raining is not in dispute! One side is lying!
In climate science, that’s not even close to an apt analogy.
The IPCC-uncertainty in the factors associated with oceanic heat flux are 10 times greater than all the forcing attributed to human emissions in the last 100+ years. If uncertainty is 10 times larger than the alleged anthropogenic forcing value itself, then it’s true that “the science is very much in dispute” and not as certain as determining whether it’s raining or not raining. But that was a gallant attempt to concoct a straw man argument, SebastianH.
http://www.ipcc.ch/publications_and_data/ar4/wg1/en/ch8s8-3-2-1.html
“Unfortunately, the total surface heat and water fluxes (see Supplementary Material, Figure S8.14) are not well observed. Normally, they are inferred from observations of other fields, such as surface temperature and winds. Consequently, the uncertainty in the observational estimate is large – of the order of tens of watts per square metre for the heat flux, even in the zonal mean.”
—
https://www.ipcc.ch/pdf/assessment-report/ar5/wg1/WG1AR5_Chapter03_FINAL.pdf
“The overall uncertainty of the annually averaged global ocean mean for each term is expected to be in the range 10 to 20%. In the case of the latent heat flux term, this corresponds to an uncertainty of up to 20 W m–2. In comparison, changes in global mean values of individual heat flux components expected as a result of anthropogenic climate change since 1900 are at the level of <2 W m–2 (Pierce et al., 2006)”
—
http://planck.aos.wisc.edu/publications/2012_EBupdate_stephens_ngeo1580.pdf
“The net energy balance is the sum of individual fluxes. The current uncertainty in this net surface energy balance is large, and amounts to approximately 17 Wm–2. This uncertainty is an order of magnitude [10 times] larger than the changes to the net surface fluxes associated with increasing greenhouse gases in the atmosphere (Fig. 2b). The uncertainty is also approximately an order of magnitude larger than the current estimates of the net surface energy imbalance of 0.6 ±0.4 Wm–2 inferred from the rise in OHC [ocean heat content]. No attempt has yet been made to examine the extent that changes in the surface energy balance over time similarly track changes in OHC as would be expected.”
“The current revised depiction of the global annual mean energy balance for the decade 2000–2010 is provided … For the decade considered [2000-2010], the average imbalance is 0.6 Wm–2 when these TOA fluxes are constrained to the best estimate ocean heat content (OHC) observations since 2005. This small imbalance is over two orders of magnitude [100x] smaller than the individual components that define it and smaller than the error of each individual flux. The combined uncertainty on the net TOA flux determined from CERES is ±4 Wm–2 (95% confidence) due largely to instrument calibration errors. Thus the sum of current satellite-derived fluxes cannot determine the net TOA radiation imbalance with the accuracy needed to track such small imbalances associated with forced climate change.”
“There is no big local heating effect caused by the CO2 ”
There is no heating effect caused CO2 ANYWHERE seb.
If you think there is, then..
SHOW US WHERE..
Produce the evidence.
Of stop this idiotic nonsense of yours.
And NO, 1 million km³ is NOT ice free, except in some weird hallucinogenic dream or some anti-science farce.
GOT IT !!
An NO, Arctic sea ice area won’t get anywhere near that, this year or any year in the near or mid future.
GOT IT !!
AMO is turning, seb.. Accept reality for once in your life.
Do you even comprehend ???????
Or are you really in too much of a semi-catatonic brain-hosed stupid.
Honestly, you should really go out there and read more. And not the propaganda stuff you usually consume. Can’t help you if you feel like everything is a hoax doesn’t come from your favorite conspiracy website.
That is the definition of the Arctic being ice free. Sometimes skeptics seem to be very pedantic with the meaning of words and defintions, but when it suits them, they re-interpret everything to their liking. Great 😉
We’ll see … apparently you have no clue what local lower sea surface temperatures mean in times of global warming and a radiative imbalance caused by CO2. So feel free to play the insult spewing clown whenever you reply to something. Might make real skeptics avoid the area of the web where you operate though. And i hope those who like conspiracies and made up data will at least be disgusted by your choice of words …
“Honestly, you should really go out there and read more”
So you choose the headless chook route yet again
You CAN’T show us where, can you seb
No evidence of CO2 warming anywhere, and YOU KNOW IT.
You poor inept little child.
“That is the definition of the Arctic being ice free”
A definition MADE UP by the clown it is named after, 1 Wadham = 1 Million km³
Gees didn’t he get things WRONG.. you worship his ineptitude as well, I bet.
Just FACE THE FACTS, seb..
You have ZERO EVIDENCE of CO2 causing warming of anything, anywhere, anytime
You are just EMPTY… and will always be EMPTY.
And there’s that conspiracy ideation of yours again…
WOW, just WOW, you really are sinking deep into mental trauma, aren’t you little child.
OOPS
That should of course be..
1 Wadham = 1 Million km² (not ³)
Which incidentally is nearly 3 times the land area of Germany
Seems Germany is “land-free”.. all the time. 😉
“That is the definition of the Arctic being ice free.”
not km to the third . . . . he said “square”
Why? It did not use to be. Then Peter Wadhams just made it up. That’s why the concept is called ‘1 Wadhams’.
square, not cubes
“There will still be about a million square kilometres of ice in the Arctic in summer but it will be packed into various nooks and crannies along the Northwest Passage and along bits of the Canadian coastline. Ice-free means the central basin of the Arctic will be ice-free and I think that that is going to happen in summer 2017 or 2018.”
HERE
yep, I just picked up the wrong thing from the character toolbox.
I know its km² .. ie area
I coined the term “1 wadham” 🙂
“It’s all about how far north the ice melts.”
Its REALLY cold above 80N, seb
look at the DMI temperature graph
MASIE has:
Beaufort Se extent above all years back to and including 2007
East Siberian Sea above all years except 2008, 2010
Canadian Archipelago above all years except 2008
And surprisingly, Baffin Bay and Hudson Bay are both above every year since 2006
And the sea ice is thinker than for quite a while.
There’s ONE HECK OF A LOT OF SEA ICE up there. !
Actually, Bastardi’s forecasts have been way more accurate than Accuweather’s, NOAA, or any other weather site that believes in global warming. I started tracking his forecasts after running across him almost a decade ago. I actually saved his and NOAA’s forecasts and compared them later, as I was trying to decide who I should follow. No forecaster has a perfect record, but his accuracy was a good 20% or so better and his long range forecasts put theirs to shame. Yet I kept seeing headlines and comments from AGW believers about how inaccurate his forecasts were. They’d pick the occasional wrong forecast (as I said, no one has a perfect record), while completely ignoring whenever NOAA or Accuweather blew it (badly in many cases) and act like those organizations had a near perfect record.
There’s a reason people pay for forecasts by him, Corbyn, and Dilley. It’s because they know the organizations that push the AGW agenda have let their beliefs affect their forecasting.
[…] More at No Tricks Zone […]
[…] No Tricks Zone: By P Gosselin on 15. July […]
Phew a pretty conclusive destruction of Butler and Seb’s lies and misdirections. Well done folks
Total destruction … I bow before you TomOmason … except it makes no sense at all. But nice try 🙂 keep on believing skeptic folks. And no, I will not try to counter anything in this list. I will just do as you guys so often do: „these aren’t valid counters“. Done. It’s raining outside and you guys are claiming it’s dry …
heh Bill
was not kicked out of Accu weather and as a matter of fact quite the opposite, Because of the legalities I can not discuss. But by saying something like that, when the facts are exactly the opposite, as anyone familiar with the situation know, it does call into question some of the other things you are saying, Its obvious you do not read or look at anything I say, for while pointing out this big drop and much of it in the last year and un-forecasted I also remind people on my side of the debate that the current SST and UAH sat readings are highest on record in satellite era in any period 2 years removed from an el nino, I am sure you do not know or understand saturation mixing ratios, for if you did, you would see most of the addition of global temperatures is in the coldest driest places or with nightime lows, which is due to the direct affect of water vapor on temperatures which is much greater the lower the temperature, So the warming is skewed, and actually is lessening zonal potential energy globally, which runs counter to claims of more extreme weather, ( If you lessen the range north to south or high to low, you lessen the potential for extremes) The fact is that natural cyclical processes of the oceans warming and cooling and the affect on water vapor are much larger contributors than co2, That is why we have saturation mixing ratio charts for water vapor and temperature, but not co2, Ever notice that? Again this is assuming you look at that. However if we went to the Saturation mixing ratios as the climate metric, hysteria would diminish to nothing and you would be left to making up stories about why I left, not got booted out, but left accuweather Given your inaccuracy in that matter, the reader is left to draw his own conclusions, Happy trolling Peace out
Here is the article. It was behind the paywall, and then I shared it with the Patriot Post, It is to show why I am concerned this year and it has nothing to do with co2, nor did the other great storms referenced in the article
https://patriotpost.us/opinion/57114-the-past-is-a-reason-to-worry-about-high-impact-east-coast-hurricanes
What happened here?
Only 19 out of 49 comments can be read!!!
Has an entire thread here just vanished? How very transparent of you guys. Just wanted to quote something Kenneth wrote from it, but it’s gone …
Oh dearie me….
… cry me a river.
poor sad, lonely, attention-seeking seb.
Wasn’t my thread … You were in it too spikey. Must be because Joe commented himself and Pierre’s fandom let him delete that whole amti-Joe thread with all the skeptic insults against one guy criticizing their strange ways …
I would guess the deletion of the thread had something to do with Bill Butler making up a false claim that Joe Bastardi was “kicked out” of AccuWeather. I wouldn’t be surprised if Pierre has banned him from commenting here again for this slander. No one should have to endure made-up accusations when commenting here.
This may be a good opportunity to remind commentators here to err on the side of civility. If you’re not sure that you are accurately representing what someone else (whom you disagree with) has written, or whether you are accurate in your claims about someone else’s background…it’s probably best not to write it.
“If you’re not sure that you are accurately representing what someone else ”
I think I can VERY accurately represent seb’s evidence of CO2 warming…
Do you live in the Leighton Buzzard or Luton areas?
[…] (Source) […]
[…] Weatherbell.comGlobal Sea Sea Surface Temperatures Have Seen “Pretty Dramatic Turnaround,” Says 40-Year Meteoro…Bastardi: Dropping ocean temperatures and East Coast hurricane risk […]