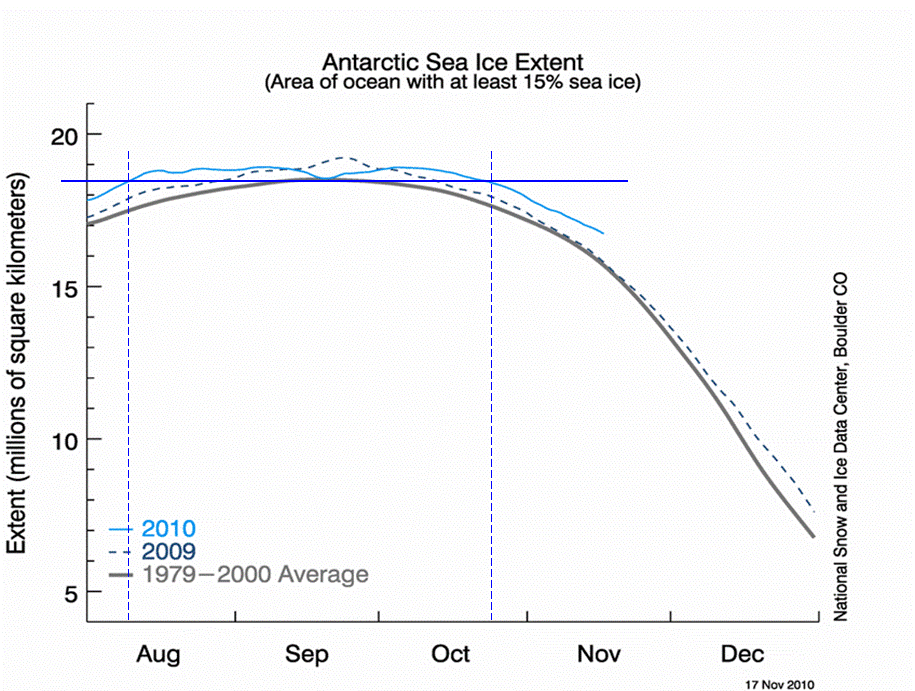
Antarctic sea ice simply refuses to melt, and stubbornly remains at a very high level. In fact in 2010 it reached its second highest level ever since satellite measurement began over 30 years ago. Normally Antarctic sea ice peaks at about 18.3 million sq km around September 20.
But this year, Antarctic sea ice reached that value already on about August 9 or so – over 5 weeks early! I’m using the graphic below to draw up these statements.
In 2010 Antarctic sea ice remained at or above the normal high peak (18.3 million sq km) for well over 2 months, from early August until late October. That’s quite awhile for the ice to hang around. I bet lots of penguins are happy about this.
Granted I haven’t gone back and taken a look at the stats over the years, but I doubt you’ll find very many years where this has happened. So you just have to laugh when physicists impostoring as climate scientists tell you the Antarctic is in trouble.
Fact is, it’s the climate scientist impostors who are in trouble, as we expose day by day. Don’t be surprised if soon another model or paper comes out claiming global warming is causing more ice! Read here. Call it desperate pre-emptive damage control on their part.
Global sea ice
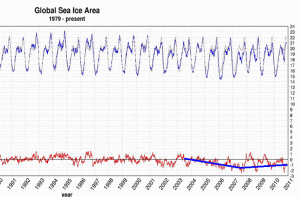
Overall global sea ice was steady until about 2004, then declined for a few short years. Since 2007 it has been trending upwards. We’re at where we were about 20 years ago.
Many are now predicting a recovering Arctic over the next couple of years, like Joe Bastardi. With no further ice melt, the peculiar absence of tropical storms, and bitter winters returning, it all means alarmists will have to be content with the meager pickings of isolated heat waves, floods or droughts.


Today’s installment of the Cancun Week special is now available at
http://ourmaninsichuan.wordpress.com/
It is the third translation of selected portions of the Chinese book “Low Carbon Plot” and deals with the true national self-interest behind climate politics and finance.
Pointman
We know this, but the warmists don’t want to know it.
OT/
hysteric greenies -> “carbon capture and storage”
http://www.spiegel.de/wissenschaft/technik/0,1518,729915,00.html
(only German)
sorry, no more money!
http://www.spiegel.de/politik/deutschland/0,1518,730143,00.html
(only German)
CCS: Interesting madness. The enviros, eurocrats and politicians come across as if they really believed in a catastrophe. A catastrophe they will reap, but one of their own making, and it will be an economic catstrophe.
This thread contains some very interesting comments by Piers Corbyn and Stephen Wilde; it could help to explain the modulation of the north/south polar sea ice extents and the effects of a quiet sun (which we start to encounter right now).
http://climaterealists.com/index.php?id=6658
We know this, but the warmists don’t want to know it.
Nah, they are quite well aware, Ron. Facts like this just move up the timetable, in case the masses become aware – a slow process. In an inexplicable twist, others have simply given up the environmental premise and are now openly advertising that it was a ruse from the beginning. We know this, but the warmists don’t want us to know it. I love the irony.
http://newsbusters.org/blogs/noel-sheppard/2010/11/18/un-ipcc-official-we-redistribute-worlds-wealth-climate-policy
How entertaining that you felt the need to, ah, “enhance” the global ice extent trend chart by slicing 11 years off the front of it.
The original graph http://arctic.atmos.uiuc.edu/cryosphere/IMAGES/global.daily.ice.area.withtrend.jpg is still available to show the visible downward slope of the long term trend superimposed on the weather noise.
Also, there is a detail that the Northern Hemisphere and the Southern Hemisphere have seasons that are 180 degrees out of phase. This means that when sea ice extent is at its summer minimum for the Arctic, it is close to the winter *maximum* for for the Antarctic. This out-of-phase addition tends to reduce the apparent decline of sea ice loss in the chart.
If you time shift the Antarctic data forward by six months to bring it into the same phase with the Arctic data, so that the addition is for the *same* phase of their cycles, you get this for the summer minimum months:
http://snowhare.com/climate/charts/global_summer_minimum_sea_ice_extent_1979_forward.png
I sliced the chart because I wanted make it easier to see the last 7 years.
Sure the ice has reduced some – why wouldn’t it? The PDO, AMO and other ocean cycles have been in their warm modes and solar activity very high.
Looking at short timescales is a trick constantly used by the warmists. So don’t start barking at me if I focus once on a 20 year period, bud.
Overall you have to look at longer time scales, i.e. hundreds or thousands of years before drawing conclusions. If you do that, you see a definite cooling trend. There’s no evidence of a CO2 influence. None! Nada!
So anytime you want to start looking at longer time scales – just let me know.
Right. You removed 11 years from it, (and shrunk it as well, I now notice), to “make it easier to see the last 7 years”. For values of “easier” meaning “harder”.
The AMO? You mean this? http://upload.wikimedia.org/wikipedia/commons/thumb/1/1b/Amo_timeseries_1856-present.svg/1000px-Amo_timeseries_1856-present.svg.png
Note that it was in it’s negative phase from around 1963 to the late 1990s. While things warmed. It has mostly been in a positive phase since then. While things *continue* to warm up.
============================================
Reply: Normally I do not deal with climate embiciles, but I feel charitable today. The AMO warmed from about 1975 to 2005. So of course this is going to impact temperatures positively.
The PDO and the AMO just move energy from one place to another in the system. They can’t actually change the long term trends for the planet.
==============================================
Reply: Longterm not. But they do on decadal scales. Are you going to tell me they don’t?
As for solar activity and longer time scales, let’s start at around 160 years: http://ossfoundation.us/projects/environment/global-warming/solar/overview/image
Hmm. Solar activity stabilized about 60 years ago (it has actually been in a slight decline for decades now).
Temperatures didn’t (stabilize, that is).
CO2? Here is the last 4000 years: http://snowhare.com/climate/charts/antarctic_co2_4000_years.png
Global Temperatures for the last 2000 years? http://upload.wikimedia.org/wikipedia/commons/c/c1/2000_Year_Temperature_Comparison.png
Isn’t it funny how the slow long term cooling trend became a fast warming trend exactly when humans started pumping CO2 into the atmosphere in massive quantities a bit over a century ago.
Yeah. Funny that.
=============================================
Reply: You’ve go to be kidding! You expect to be taken seriously with the crap you’ve presented? What’s the source of the data? You cite no source on the graphs. They could have been drawn by you yourself, for all we know.
Temperatures have been warming since 1700 – long before CO2 began rising. Hmmm. You’re cherrypicking. Go back 500 years, 1000 years, 10,000 years or 1 million years, and show us data and graphs that have a source. Even the warministas concede that the MWP, Roman Times and early Holocene periods were warmer than today.
Are you going to tell me the science is settled, too? With data you present, no one is going to believe it. Cite your sources in the future. In school such work would be awarded an F! Snowhare charts aren’t going to cut it..
– snip
Ice is increasing in the antarctica because of humans ! Yes CFC’s have depleted the ozone which is causing ‘cooling of the stratosphere colder stormier and faster winds over antarctica waters’ that has meant sea ice increases. http://www.physorg.com/news171129293.html by Adam Volland 2009
Basically, the article you link to says “we don’t know” – it only takes more sentences to do it than i. Notice that CO2 isn’t mentioned in the article. Shouldn’t the NASA colleagues show a bit more solidarity with Hansen? Why does CO2 make polar ice melt according to the AGW fanatics, but lets the antarctic sea ice untouched? Funny selective behaviour for a trace gas, that. Do you have a link to a study that explains that?
DirkH 12. Dezember 2010 at 13:14
CO2 raises temperature, higher temperature melts ice. The Antarctic sea ice is irrelevant, it is seasonal and melts again in summer. http://www.iup.uni-bremen.de:8084/amsr/ Arctic sea ice extent 2010; Jan to May below average – May to Sept above average – Sept/Oct below average – Oct to today around average. Record monthly change for December 2010..
Arctic sea ice as of 29 Dec 2010 is about 500,000 sq km below 2009. Mid winter very slow ice growth. A high over Scandinavia feeds cold air over Europe, but warm air towards the arctic ocean, Canada and Alaska. Hudson Bay is normally frozen over by November, at present only 1/4 to 1/3. The best link I can give you is Google and an open mind.