By Ed Caryl
In A Recent Temperature History, Part 1, the temperature trends for the contiguous United States were examined. In part 2, the rest of the world (as far as there is data) will be explored. Again, the selection criteria were: less than 10,000 population, and (as much as possible) a continuous record from 1940 or before to the present.
Ten stations were found in the Arctic and Siberia, six stations bordering the North Atlantic Ocean, and thirteen stations in the southern hemisphere, in South American, Australia, the south Atlantic, and south Pacific. All of these stations are well away from any population centers and are isolated or in or associated with very small towns and villages. No stations were found in continental Europe or Africa that met the above criteria. Station records at GISS either ceased in 1990, had a large gap during WWII, or both.
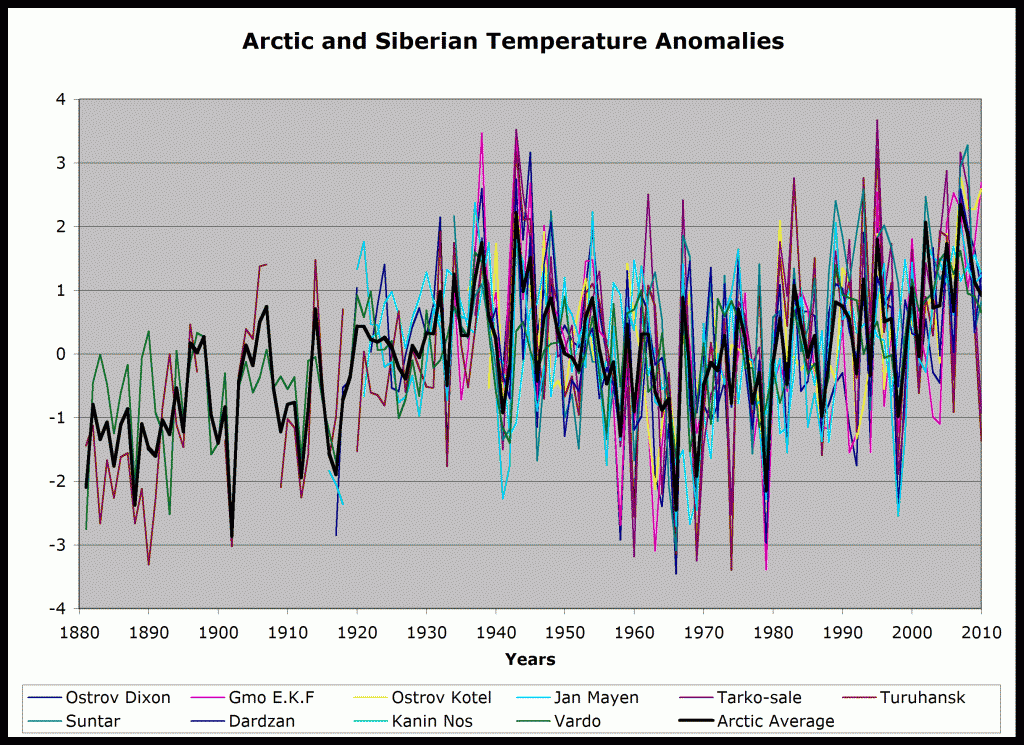
Figure 1. These are Arctic and Siberian temperature anomalies using 1930 to 1980 as the baseline period. The bold black trace is the average of these ten anomalies.
In the Arctic and Siberia we see the familiar pattern of warming in the first half of the 20th century, followed by cooling until 1970, then warming until recently.
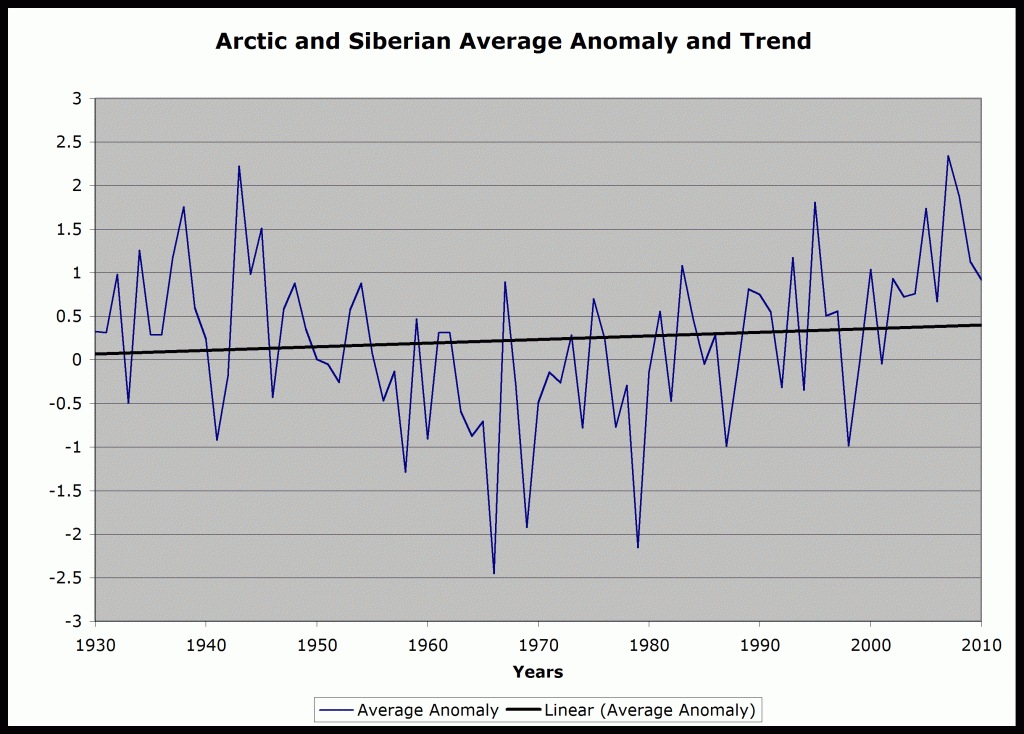
Figure 2: The Arctic and Siberia average anomaly and a linear trend line from 1930 to the present. The trend is +0.33° C over the 80 years, or about 0.4° C per century.
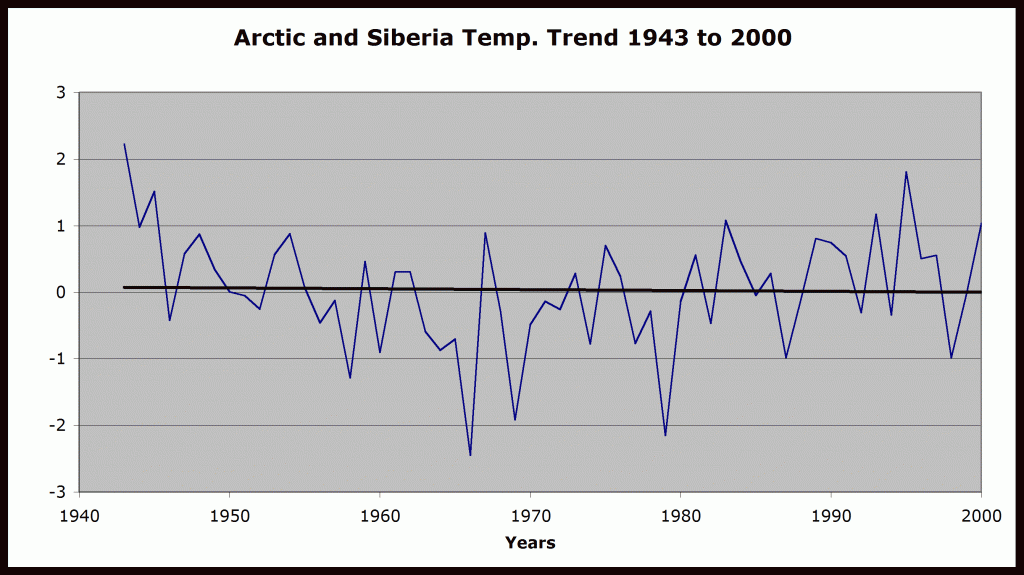
The problem with the trend in Figure 2 is that it includes part of the earlier warming trend and only one cooling period. In Figure 3, the 66-year complete cycle is chosen, and there is no trend.
Figure 3. The Arctic and Siberian trend over the period 1943 to 2000.
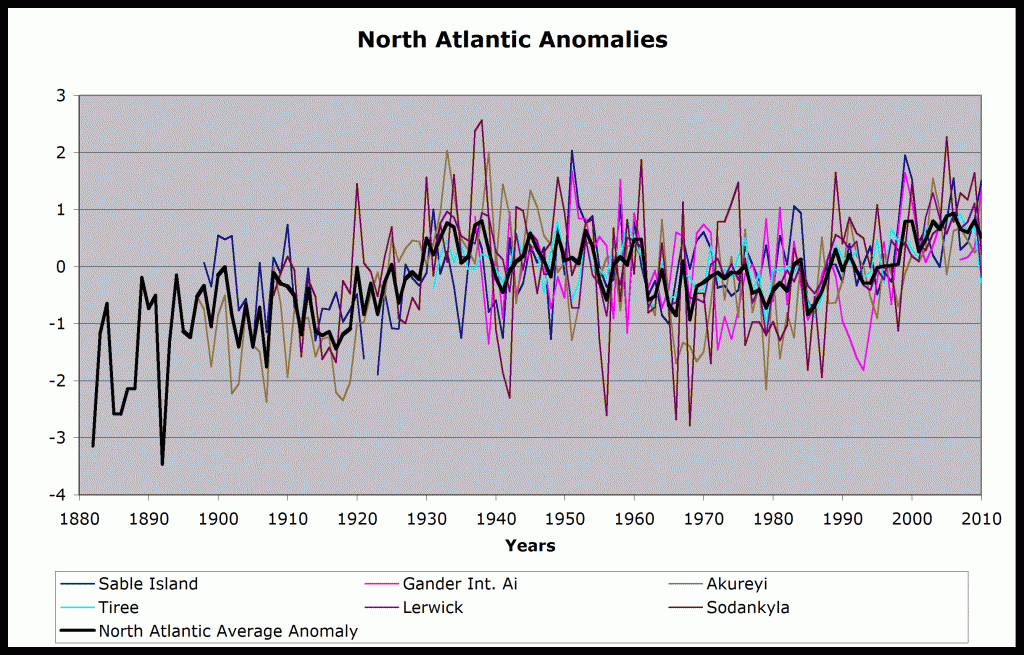
The North Atlantic shows the same shape as the other Northern Hemisphere records.
Figure 4. There are six North Atlantic temperature anomalies. The bold black trace is the average of the six stations. Before 1900, only the Akureyi station on Iceland was active.
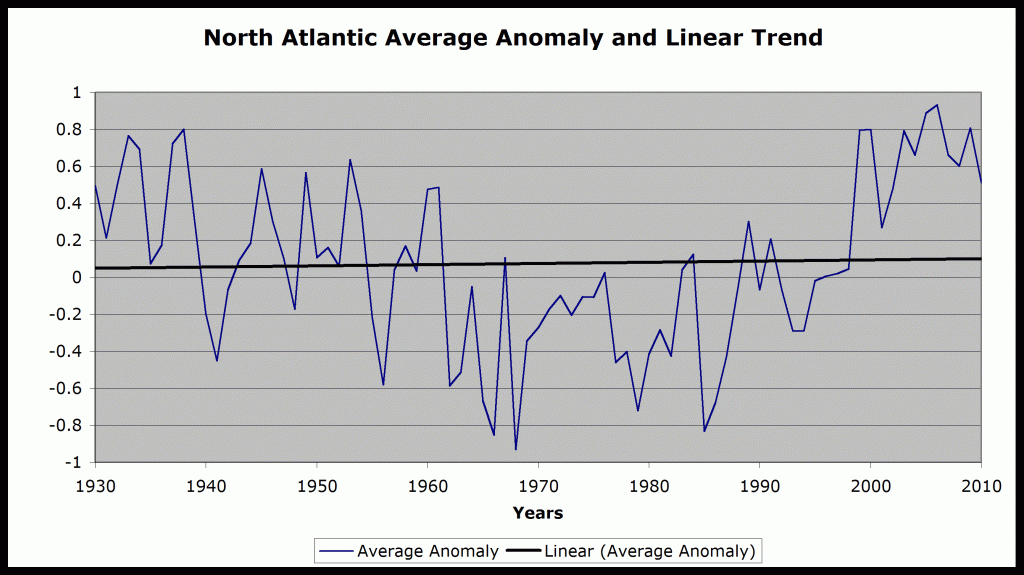
Figure 5. This is the North Atlantic average anomaly and the linear trend from 1930 to the present. The trend from the mid 1930’s to the present is flat.
In the northern hemisphere the temperature trend is a cycle, roughly paralleling the Atlantic Multi-decadal Oscillation (AMO), and the Pacific Decadal Oscillation (PDO). Between the cycles of that oscillation, there is no trend. There may have been a trend in the 19th century of warming from the LIA, but that is now over.
The Southern Hemisphere
There are few stations in the Southern Hemisphere that meet the criteria for admission into this exclusive club. South Africa has none. Australia has three, two at airports, but not large airports. South America has four stations, the rest are on islands in the Pacific, and there is one in the South Atlantic. There were no stations in Antarctica before 1955. Most stations in Antarctica were established during the International Geophysical Year from July 1, 1957, to December 31, 1958. Still, there are five stations in the southern hemisphere that go back to the turn of the 20th century.
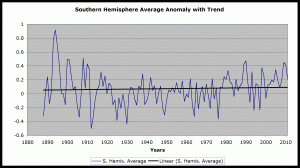
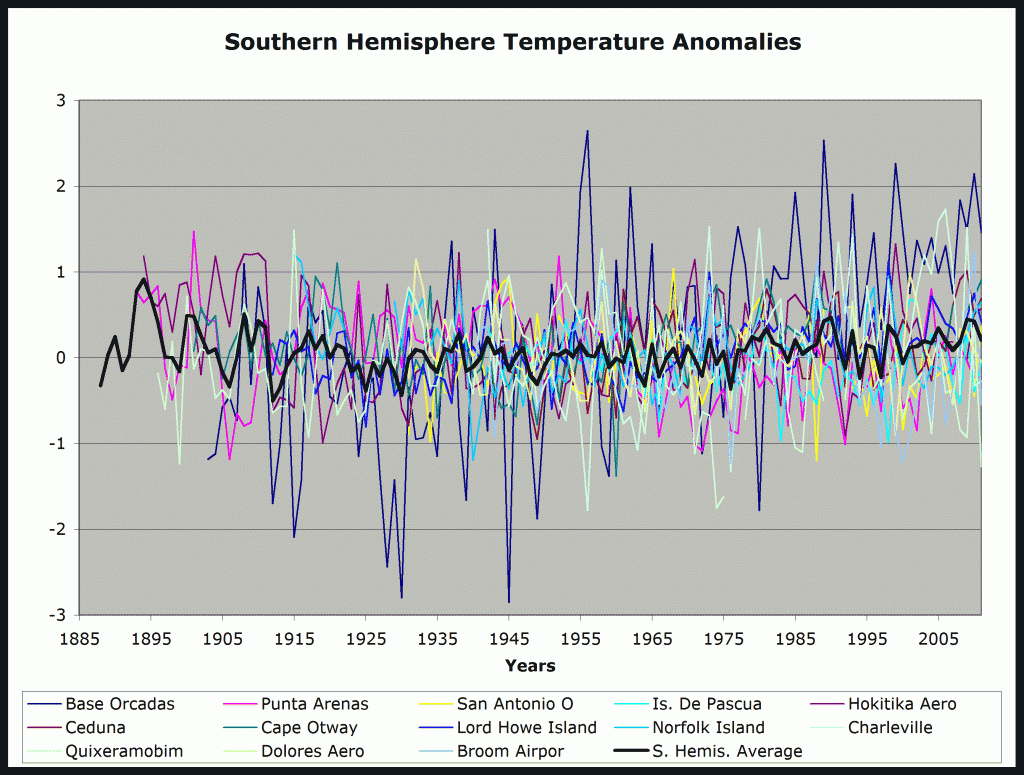
Figure 6. There are 13 Southern Hemisphere stations with long records. The baseline for these anomalies is, again, 1930 to 1980. The bold trace is the average anomaly.
In Figure 6, the Argentine Base Orcada on the South Orkney Islands in the South Atlantic provides much of the noise.
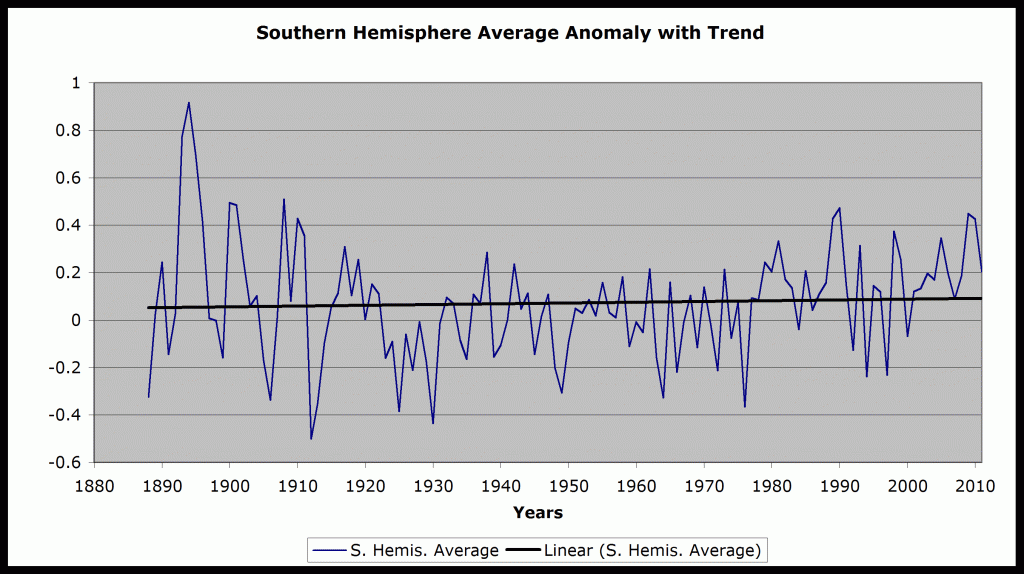
Figure 7: This is the Southern Hemisphere average anomaly with the linear trend line.
The notable thing about the southern hemisphere trend is that there isn’t any trend. The eye tries to detect a pattern of cooling early and a slight warming since 1930, but it would be about 0.1° C. If real, this may be half of the 200-year cycle discussed in the Lui et al paper, and here. But it might be urban warming creeping into the data. Some of the positive peaks coincide with major El Nino years, particularly 1891, 1982-83, 1997-98, and 2010. Over the last 50 years, continental Antarctica itself seems to be cooling slightly. See A Wind in Antarctica.
In the beginning, the exercise described in this two-part article was an attempt to tease out an accurate measure of global warming in order to determine CO2 sensitivity, the amount of warming we would experience if CO2 were to double. During the 20th century, CO2 in the atmosphere has increased from about 280 parts per million (ppm) to 390 ppm. This is about 40% of doubling. If doubling the CO2 in the atmosphere were to cause appreciable warming, we should see a measurable amount now. The climate sensitivity can be calculated from that amount. That number has now been found.
It’s zero.


Very good argument. CO2 is global so we should see the effect in the SH. We don’t, so the effect must be zero. Which is, for me, logical – radiative transport of heat is only one of three transport media (the others being convection and conduction, with the most energy transported upwards by the hydrological cycle), and the fastest one, so even if an increase in CO2 would slow the radiative transport down (because of more absorptions/re-emissions happening on the way), this slowdown would still only delay the radiative heat transport by minutes. Long term effect zero; the absorptive qualities of CO2 notwithstanding.
DirkH, you forgot phase change. In the case of evaporation from the ocean surface phase change is associated with convection but humidity also plays a part. The so-called scientists who seem to think that radiation emitted from surfaces and absorbed by gases in the atmosphere is all important have no understanding of heat and mass transfer (which by the way is an engineering subject outlined to some extent in chapter 5 of Perry’s Chemical Engineering Handbook)
Yes, phase change. Here’s the Postdoc of Ken Caldeira, Ex IPCC Top Honcho; Julia Pongratz:
http://www.youtube.com/watch?v=7QScjmDOxYI&feature=related
DirkH, watched two videos but have not read the paper (have you a link?) From the videos of two of the authors there is nothing new, see the publications and blog here http://www.bioticregulation.ru/pubs/pubs2.php . The other thing not mentioned is that drops of water and particles of ice at the top of clouds radiate to space much more than water vapor because the total emissivity at cloud temperatures is close to one. Heat and mass transfer is complex and few fully understand it.
Oh, their scientific discoveries are not groundbreaking or noteworthy – except for the fact that Ken Caldeira is a warmist who just quit the IPCC; talk about rodents, ships, and sinking. 🙂
“In 2011, Caldeira resigned as a lead author of an IPCC AR5 chapter. ”
http://en.wikipedia.org/wiki/Ken_Caldeira
Ed
I think your latest work again confirms that global warming as a global event does not even exist and has not existed recently. There is no significant warming in the Southern Hemisphere .The warming is only a cyclic Northern Hemisphere event and even then if temperature data is properly selected and the data covers an interval which reflects at least a complete climate cycle[60 years or more] , then there is only a minor increase in temperatures and this increase is consistent with century long trends[ 0.5 to 0.65 degrees C rise per century] and not catastrophic by any stretch of the imagination as painted by some alarmist.
Ed – thanks for this very interesting 2-part story.
Most skeptics and alarmist scientists agree that manmade CO2 contributes to warming (some much more than others) so it is astounding that we hardly can detect it at the uncontaminated stations.
Still, we cannot say that CO2 doesn’t cause warming. But on the other hand, it certainly is not causing anywhere near the warming the alarmists and some lukewarmers have claimed.
A few days ago I wrote a post about about this new German book (possibly coming out in English too) due in February. It is amazing to see the similarities in the results, i.e. much less warming from CO2 than suspected. It all gets down to sensitivity and feedbacks. We are finding out that there really isn’t much of either.
The Book, Die kalte Sonne, makes a convincing case that it has been the sun all along as far as the longer term trends are concerned. And it explains why the Earth is going to cool over the next 3 decades.
Pierre, are you doing the translation?
It’s official; Branson wants you all dead.
http://www.grist.org/climate-skeptics/2011-12-16-new-approach-to-climate-deniers-launch-them-into-space
Ecotretas has video. Warmists having fun.
http://ecotretas.blogspot.com/2011/12/pachauri-openly-defends-killing.html
I presented the definitive evidence that invalidates the greenhouse effect entirely, AND reforms the physics of atmospheric warming, with my simple Venus/Earth temperature comparison more than a year ago, and have written about it here more than once in the last year. But even skeptics will not listen. The reason the absorptive qualities of CO2 (as DirkH puts it) do not contribute to an increase in atmospheric warming is because the atmosphere is fundamentally warmed by direct absorption of incident solar infrared radiation, not by first warming of the Earth’s surface. Atmospheric (in particular CO2) absorption of infrared radiation emitted by the surface does not warm the atmosphere at all, because it is already warmed by the incident solar radiation, to its ability to retain heat. Upward longwave radiation is just part of the TRANSFER of heat along the temperature gradient between the surface and the top of the troposphere; and that gradient is governed by the hydrostatic condition that defines the troposphere in the Standard Atmosphere. Climate scientists (and radiative transfer theorists) set aside the Standard Atmosphere (obviously because its stability was not interesting enough for them, although my analysis confirms it as the equilibrium state of the atmosphere) and chose instead to pursue the “greenhouse effect” and a “runaway climate” paradigm. The Venus/Earth analysis, as I did it, is the definitive evidence for the correction of, and any further progress in, climate science and radiative transfer theory when applied to planetary atmospheres.
I am an engineer and I find this comment quite interesting because it seems to pose the question about the origin of warm air, which has been discussed to quite a lot of depth on some blogs. As I understand it, warm air moves with the clouds because otherwise it would escape into space. Warm air rises, therefore the origin of the air warm air must be the ground/sea re-radiation ( Convection, conduction, IR) from the Sun. The heat capacity of air is very low compared to the land and sea, so again, it seems logical that this is the source of the warm air.
I am ready and willing to be convinced otherwise.
Nope Barg, you ideas and theory sound good, lapse rates do it for me and the key: is gaseous H2O [and the Sun’s IR + land and ocean conductivity, thermal (re) radiation natch].
BTW, fine work Mr. Caryl.
Thanks, Ed. I cannot tell what your selection is worth but it shows the sound point that it is better to have a small unbiased sample than a large biased sample. More is not necessarily better. Let’s not forget that the records in large historical data bases like BEST and GHCN were never made for answering our present question. Perhaps the best we have in this respect is the 30-years satellite record. For a certain time I have been analysing (just for fun) the GHCN base and have decided that the best way is to apply a linear model separating local and temporal information. In this base (not the earth) the temperature increases during 1701-2009 with 0.3 degrees Celsius per century. There is a small acceleration at recent times but this shows the defect of a too small time window. We need thousands of years like in ice-core studies to get a signal deserving Fourier-analysis. Nice work if we forget our doomsday questions all together.
Thank you for this article and it’s conclusions.
ZERO is what I’m saying over the past 15 years.
As for the “warming” graph’s:
http://www.Real-Science.com/2009-alabama-state-climatologist-correctly