Die kalte Sonne website here has a guest post by Frank Bosse. I’ve translated and condensed it in English:
================================
Troposphere and Sea Surface Temperature: 18 Years With No Trend
Guest post by Frank Bosse
There’s a heated debate going on concerning the trend of non-rising global temperatures CRU (HadCRUT4) for the last 16 years.
In 2011, a paper authored by Ben Santer and colleagues described that at least a 17-year trend is needed to identify the human impact on the mean temperature of the troposphere. The paper’s summary:
Our results show that temperature records of at least 17 years in length are required for identifying human effects on global-mean tropospheric temperature.”
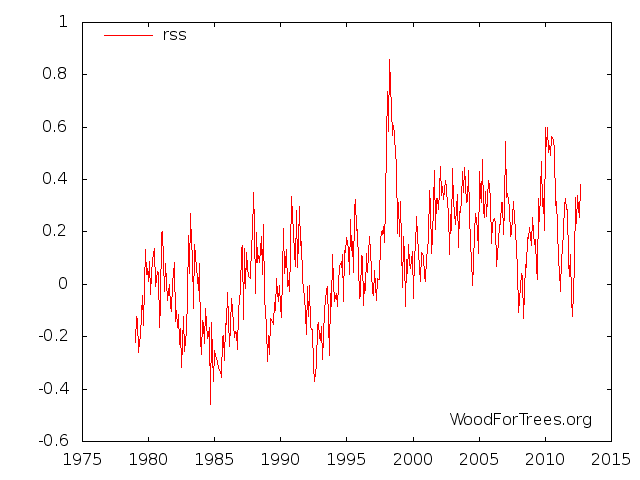
This mainly referred to the Temperature Lower Troposphere (TLT):

Source: woodfortrees.org.
This brings us to the issue of auto-correlation, principally how long and how often must the temperature be measured before a significant trend can be established with a sufficient level of confidence. Is the trend positive (and not random) and can it be traced back to a real warming? If it can, then the trend is said to be significant. In statistics we can say that a 95% confidence interval means that the trend must be 95% real trend, and only 5% random.
There are statistical tests available to show whether the measurements are strongly dependent on each other or not. The dependency of a measured value on the previous value is called auto-correlation.
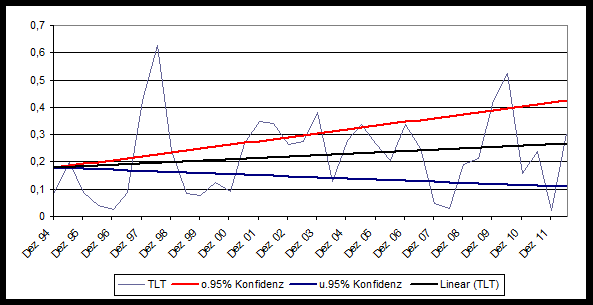
In the paper named above, the limit is 17 years. But to be sure, we want to look at the past 18 years, i.e. the months from September 1994 until August 2012, which means 216 measurements. We calculate a 6-month mean value and look to see whether the trend is significant at the 95% confidence level. If that is the case, then both limit values of the trend increase must be positive. Is this the case?

No!
The mean trend (black) is in fact positive, but it is not significant. The lower (blue) is negative. Thus it is shown when considering auto-correlation that the condition of Santer in his paper hasn’t existed since September, 1994. The temperature of the troposphere has not significantly risen over the last 18 years.
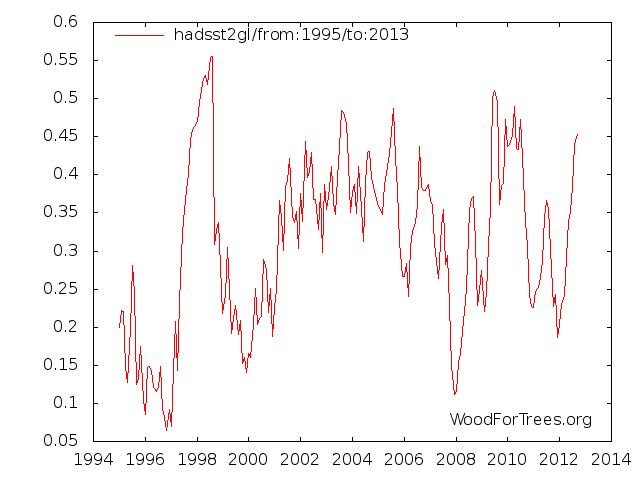
And there’s more. We examine the temperature of the sea surface since 1995, see here:

Source: woodfortrees.org.
We presume that the temperature will persist at its (high) August 2012 level until December because of an announced El Nino (one that will not show up, but we don’t want to be accused of cherry-picking). Here the trend is 0.067 °C per decade, but it is not significantly positive at the 95% confidence level when one uses the annual mean values. Also the temperatures of the entire sea surface have not risen significantly over the last 18 years.
What does it all mean? Does man no longer have an impact on the temperatures of the troposphere and sea surface temperature? With certainty man does have an impact, as he has been emitting CO2. The concentration of CO2 in the atmosphere since 1995 has risen from 359 ppm to 397 ppm. According to IPCC models, tropospheric and sea surface temperatures should have increased significantly, but they haven’t. Here natural variability, e.g. ENSO, has also played a role. So can CO2 sensitivity be as much as assumed? 3.2°K per doubling of CO2 concentration?
Two contributions from the recent past contradict this: one comes from an examination of the radiation budget when Pinatubo erupted in 1991: a value of 1.4°K, the other comes from an evaluation of the global temperatures and the heat content of the upper 2000 m of water in the ocean (OHC): 1.7°K.
What is the most probable? 3.2°K CO2 climate sensitivity as estimated by the IPCC or 1.6K?
The fulfillment of the famous Santer Postulate for the temperatures of the troposphere and sea surface temperature speaks for the latter estimate. This leads us to the final assumption made in Lüning’s and Vahrenholt’s book “Die kalte Sonne”: The man-made share of warming likely is only half as much as what is assumed by the IPCC.
==============================
Note: That the warming is only half-caused by man is also claimed by German climate scientist Mojib Latif, who repeatedly attacked Vahrenholt and Lüning – just because they agree with his claim!


“Does man no longer have an impact on the temperatures of the troposphere and sea surface temperature? With certainty man does have an impact, as he has been emitting CO2. The concentration of CO2 in the atmosphere since 1995 has risen from 359 ppm to 397 ppm.”
There is little doubt that man has an impact, and that he has been emitting CO2.
Atmospheric CO2 has increased by 10.5 percent, from 359 ppm in 1995 to 397 ppm by 2011.
However, there are at least two questions:
1. How much of the global temperature increase of 0.067 degree Celsius per decade was caused by CO2?
2. Given that man’s total CO2 emissions comprise about 4 percent of annual, global CO2 emissions (96 percent of annual global CO2 emissions are from natural sources), how much of the global temperature increase was caused by man-made CO2 emissions?
Aside from that, temperature and heat content are not the same. Temperature is measured and expressed in degrees Celsius or degrees Kelvin. Heat content is measured in Joules.
Vahrenholt and probably Lüning and the guest poster Bosse are warmists; but for tactical reasons they want to prevent immediate financial ruin through exploding energy costs, as they fear a backlash of public opinion against warmism. They are, in other words, lukewarmists.
Vahrenholt certainly used to be a warmist – I don’t know about Lüning, who, being a geologist, probably has always been quite skeptical. Maybe Vahrenholt is a lukewarmer I’m guessing, though one that is probably getting cooler. You can only go out on a limb so far before it snaps.
@Walter – I was a bit surprised that Bosse made no mention of the sloppy temperature measurement methodology and the urban heat island effect. A good start, but far from a complete analysis. I think you can take the 50% share attributed to CO2 and cut it in half again. But his conclusion is right: NO TREND!
Oh there is a trend alright. Its sinusoidal. Unfortunately I have found no IPCC climate scientist who can explain to me just why CO2 emitted by evil SUV’s can make temperature go up and down in such a fashion. Mystery it is. So amazing what this evil dastardy CO2 molecule can do. Its also such an amazingly amazing coincidence that the same 60 year cycle appears in the AMO, PDO, ENSO, rainfall data and sea level data. To think CO2 did all this is fantabulistically amazing. I see now how Al Gore got his Nobel Prize.
Turmoil at the German Greens. Old Leftist Claudia Roth lost party internal election against 46 yr old Katrin Göring-Eckardt who now forms party leadership duo with old leftist Trittin.
I just saw it in the news. The gang of old Leftists looked as if they were about to break out in tears.
A very satisfying view.
Forgot to mention, Göring-Eckardt is a Christian.
Egads! 😉
She joins Gauck, Germany is turning evangelical. Shouldn’t that lead the MSM to label her as a religious, Bible-thumping nutjob? One of her quotes (Wiki):
“Der Rückbezug auf die Bibel öffnet ganz neue Wege in die Zukunft. Die Worte, die im Buch der Bibel überliefert sind, können uns gelassen, frei und erfinderisch machen inmitten einer sich rapide verändernden Welt.“ Roughly in English:
“A return to the Bible opens up new paths to the future. The words of the Bible can make us calm, free and inventive amid a rapidly changing world.”
I don’t trust her. Christians can lie, or tolerate lies, just as any other people. Corruption does not discriminate.
Yeah, she’s a green. But in any case – they looked so pissed, you should have seen them.
Loser Claudia Roth in an old photo, carrying a banner saying “Never again Germany!” (probably before the re-unification):
https://www.youtube.com/watch?v=KTklItyM_qg&feature=related
Here is what the ocean pattern for the last 140 years says about future warming:
http://orssengo.com/GlobalWarming/GmstPrediction.png
Its less even than that as half of the trend under the cycle is due to overall solar output.
Solar cycles are getting longer, which means temperature falls. The shortest solar cycle in 212 years ended in 1996 and temperature on average has been flat since then, and falling recently.
Its easy to include this factor into a model, but of course the IPCC does not do this.