 [Sticky post, hence different color background…new posts below]
Cooling Will Be Worse Than We Thought
By Joe Bastardi, weatherbell.com/
At Weatherbell.com, we try to show people the ‘why’ before the ‘what’. My father taught me that if you are right, then you should have the reason why first, and not excuses for being wrong later.
From where I stand, the reasons why we are right are clear. But the barrage of excuses coming from the other side is growing shriller with each passing day. And the idea that people spouting the CO2 idea are being driven from the field in spite of the overwhelming evidence against them is nonsense. When facts don’t matter, it’s not the facts that will force them to quit. This is well beyond science. Any rational person can see what is going on and can say that in the least there is enough doubt to stop the madness that demonizes those that disagree. In reality, their point has been driven from the field.
What I am doing here is giving you the ‘why’ before the ‘what’. What I’m amazed at is how people can keep seeing things that are opposite of what they claimed would happen 5 years ago, simply change the terminology and then say the things they say. That kind of mentality is one that does not accept any answer except the one they think it should be. So the fight is not on a level of a normal argument. The arguing is with people who believe they possess the “truth” and that anything short of their “truth” cannot be tolerated.
But we must smile and fight with facts. Debunk, and try not to demean.
In any case the following link will be very helpful in trying to get my point across, and I am going to use relative humidity and mixing ratios to show some of this: weather.cod.edu.pdf.
Here is why this should be simple: Energy can neither be created nor destroyed. So what is the source of energy to the Earth? Answer: the sun. If outgoing radiation equals incoming, then there is no trapping and all this hullabaloo is a moot point. Since that is the case, the game should be over.
However if you want to start confusing the issue, then you assign major importance to very minor items, control the language, and then you can control the perception.
The fact is that the Earth has been warming since the very cold period of the 1700s (Little Ice Age). It just so happened sunspots were in the tank, and it was cold. When sunspot activity increased, the Earth responded by getting warmer. Should be simple, right? The link to the oceans in the overall rise that has occurred is obvious in the graph below (from the outstanding site: Climate4you.com/.
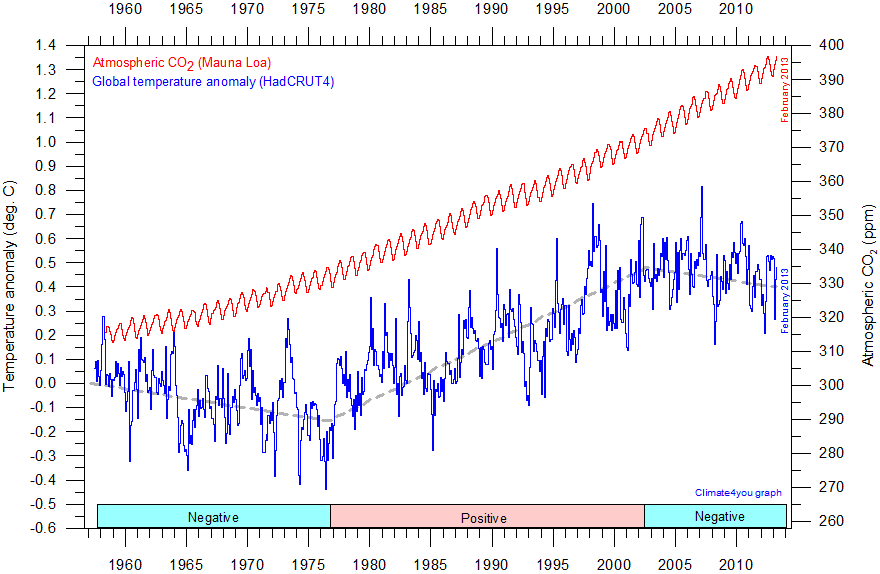
Figure 1: CO2 concentration and global temperature.
The cumulative effect of the warm AMO and PDO added heat to the atmosphere, so temps rose from the late 1970s to around 2000. After the air absorbed the heat, it leveled off, the PDO flipped, and we started trending down.
Simply using the PDO, as seen in the chart below from Wikipedia, shows an almost direct correlation:
The warm years from the late 1970s to a bit beyond 2000, the latest downturn can be seen as well. The Pacific is much larger than the Atlantic, but the Atlantic turned warm in the mid-1990s so it is still not fully on board with the cooling. But when it does turn, chances are global temps will respond as one would expect knowing the heat capacity of the ocean is 1000 times that of the atmosphere. This chart alone should cast doubt, if not slay, the CO2 dragon being a major climate factor, if any at all. It’s simply too small to do what these people spouting this agenda-driven idea say it will.
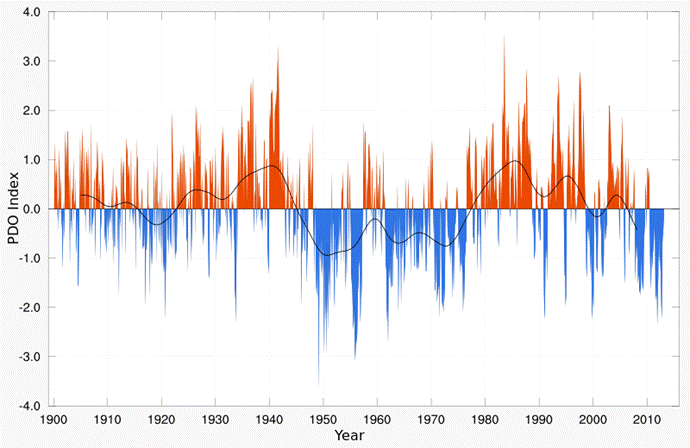
Figure 2: Pacific Decadal Oscillation (PDO)
Again the overall rise of the past 200 years is easily explained by sunspots, which is why a lot of people are nervous about cooling. After all, if you are claiming the sun caused the warming, and you take it away, and the oceans flip to their negative phase, and a couple of volcanoes blow to boot, then there is real trouble. Hence the triple crown of cooling, which I showed on national TV 4 years ago when explaining why the cooling would commence, and by 2030 temperatures would return to levels seen in the late 1970s.
As for CO2, the rise may be due in part to a lag that FOLLOWS warming, and doesn’t cause it. Since the 1950s, the only time CO2 was correlated was when the oceans warmed. This is not brain surgery.
There is science and pseudo-science. Science comes up with an idea like the oceans are causing warming, and when they cool, the air cools. Pseudo-science says: well CO2 is adding to this, but how much? IT’S A QUESTION THAT CAN NEVER BE ANSWERED. Does the question then become: Would we already be heading into a mini ice age were it not for CO2 saving us? How do you answer that? Untold amounts of money are being thrown at a question that isn’t even something of consideration.
Now here is the problem. Temps have been dropping as you can see…not a lot, but some. But what should be very disturbing for planners and people looking forward is that the Relative Humidity is dropping. That means the wet bulb has dropped more than the temperatures.
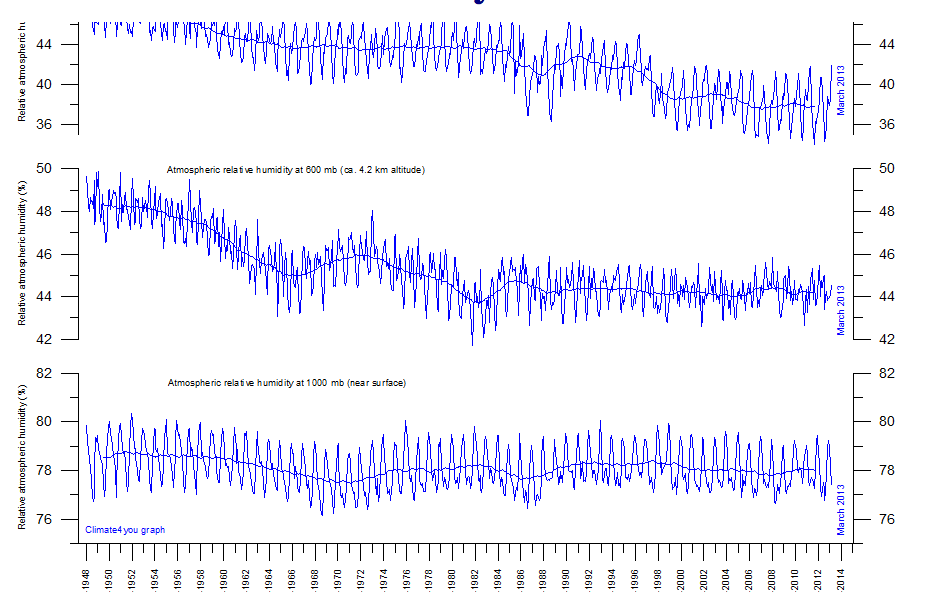
Figure 3: 300 mb (top); 600 mb (middle) 1000 mb (bottom).
Why is the RH dropping? Think about it. A cooling Pacific, especially in the tropics, means less water vapor available to the system. So we get the initial temperature drop off because of the cooling Pacific is no longer adding to the warmth of the air – primarily in the tropics. But the RH is dropping too.
Where it’s dry, it does warm up and the large dry land areas do warm in the summer season, until such the entire earth/ocean system adjusts (the AMO flips to cold too). But the drop of RH, seen above in the chart is a big hint!
Notice how at this time, the 1000 mb is lagging. Eventually, though, the transport of moisture from the lagging low levels will cool the mid levels (increased moisture leading to temperatures falling toward the wet bulb), leading to more instability, more cloudiness. Until a balance is reached, the earth’s temps will cool. Perhaps faster!
A look at the skew T and the mixing ratio relationship to temperature really drives my point home about why this is a distortion of temps and not warming. By distortion I mean its obviously warmer in the northern areas, but THE COOLING IN THE TROPICAL AREAS, EVEN THOUGH MUCH SMALLER, CARRIES HAS A FAR GREATER IMPACT ON THE WEATHER AND CLIMATE.
A way to think about it like 2 people that weigh the same, but one may have more mass in one part of the body than the other.
An example of this can be seen when one looks at what it takes to change the mixing ratio 2g/kg at 30°C vs -20°C.
Look at how the mixing ratios increase dramatically with higher temps. In other words, suppose we lower the temps 1°C at 30°C (from Wikipedia chart).

Figure 4: Mixing ratios
Doing so, we would change the mixing ratio by about 2g/kg. Now how much of a rise at -20C would we need to offset that? At -20°C the mixing ratio is about 0.7 g/kg. To move up 2 g to 2.7 g/kg, we would have to raise the temp about 15°C.
The changes in temperatures in the tropics have a much greater overall impact on the climate than those in the Arctic. It is, if you will, easy to warm cold, dry air, but to cool warm tropical air is much harder. So if the Earth’s temperature is about steady, or falling off a bit as we saw in the graph above, and the Arctic is still warm, the compensating drop in the tropics means more to the Earth’s climate than the same movement of temps in the Arctic It becomes a predictor of what has to happen as the PDO continues cold and the AMO turns cold…the warmer northern polar regions will cool. A degree is not a degree when it comes to the climate system. A one-degree movement up and down where wet bulb temperatures are 30°C have far greater effects on the system than a 1-degree change where its near 0. That is the message behind the mixing ratio example above.
Now let me ask you this question, in terms of the climate system, which is far more important: 1) the tropical oceans and the air masses around them, or 2) what is going on in the Arctic? The answer is given above.
Again this is simply saying there is a natural large-scale thermostat called the ocean. The warmer the ocean, the more it drives the whole climate system.
The slight cooling with dropping RH is a sign of bigger things to come. This means the wet bulbs are falling faster than the actual temps. It is a predictor of future temperature drops (it’s worse than we thought). For usually when the RH falls, the temperatures rise. But in this case, temps are already falling and the RH is falling too!
At the very least I expect temperatures by 2030 to return to where they were in the late 1970s, which was the end of the last cold PDO phase and, by the way, the start of the satellite era: the most objective form of measurements.
Is the cooling worse than I thought? We are going to find out in the coming decades.
Photo Joe Bastardi: weatherbell.com/


The final line in several of my recent comments has been, ‘This could mean several decades of great skiing, or this could mean a substantial hardship for inhabitants of the Northern Hemisphere’.
I can see Joe’s mother tongue in is writing 😉
He always makes sense and resists the exaggerations of the AGW supporters. That’s enough for me to listen.
Goes to show that the ocean’s 1000 times greater heat capacity and its role on climate cannot be ignored in models.
The idiot (or perhaps fraudulent) IPCC modellers assigned the positive AMO and PDO heat from 1980-2000 to CO2. Now they’re wondering why their models aren’t working. Duh!
And all the stuff about the Arctic is crap. The Arctic lags, and in a few years you’ll see re-freezing. Go back and look at the 1950s.
Fascinating read! Thanks Pierre for having Joe on here. This was very interesting!
Looking at the temperature curve in Figure 1, I have a small problem.
I remember the 60’s and 70’s winters being cold and there was quite some snow. I also remember that the summers in the 60’s being quite warm and I believe even quite hot. I know that the human memories is not perfect.
When I compare the winters and the summers of the last few years then I think the curve from 1975 is going to high.
I listened to Prof. Dr. Fred Singer http://www.youtube.com/watch?v=40fQ85pFDzg and I can follow his view that the warming from 1975 is problematic. He thinks it is not genuine.
Are we measuring the same way? I doubt it. I read somewhere in the past that the measuring stations are reduced and the heat island effect is also noticeable. A correlation between CO2 and temperature couldn’t be made since as far back as the 60’s.
Joe’s not wrong. The last 4 years in the EUSSR have been colder and colder as Pierre will no doubt attest. If it continues at this rate we will be back to the 1950s in 5 yrs and maybe worse in 10. The difference now to 2006 is enormous. How do I know ? I grow things. I am planting and sowing later and later. Last year I sowed my potatos at the usual time (Late march) but sowed them deep so as to miss the frost (not normally necessary). They failed. They failed because of cold and wet. That’s not normal in SW France.
Stephen,
What do you think about the logo of the DWD, upper right hand, (temp curve that seems to say you’ll be able to plant earlier and earlier). http://www.dwd.de/ ? Do you feel the logo is misleading? Just curious.
I truly believe we are on the verge of a major cooling but Joe says it so much more powerfully.
Don’t take my word for it:
http://wattsupwiththat.files.wordpress.com/2013/04/archibald_1749_2049_projected_solar_cycle.png
Oops forgot the main link:
http://wattsupwiththat.com/2013/04/29/russian-scientists-say-period-of-global-cooling-ahead-due-to-changes-in-the-sun/
Stephen Richards,
Same thing in Northern California, I’m planting my backyard vegetable garden four to six weeks later than I did ten to twenty years ago because the temps are cooler, and some of the past ten years, we’ve had frost weeks after the ‘final’ frost date.
Perhaps you oughta give Ed ‘Jerry’ Brown Jr. a bell and tell him how it really is in the world and btw tell him to sort those green nutters out in Hollywood.
I think what this really means is that it is incorrect to use an intensive variable like ‘atmospheric temperature’ when the metric should be energy content – or Kilojoules per Kilogram of atmosphere. The amount of energy in a Louisiana bayou after in the mist after an afternoon storm with temperature of 78F and humidity close to 100% is almost double the energy of a dry hot afternoon in the Arizona desert at 100F and closer to 0% humidity. This makes averaging these temperatures as is done for ‘global mean temperature’ as meaningful as averaging the numbers in the phone book.
Nothing new under the sun: the late Prof. Marcel Leroux had that one figured out a long time ago, just to be censored by the French IPCC clowns.
http://ddata.over-blog.com/xxxyyy/2/32/25/79/Leroux-Global-and-Planetary-Change-1993.pdf
And his 2005 and 2010 books published by Springer expanded on this:
http://www.springer.com/earth+sciences+and+geography/atmospheric+sciences/book/978-3-642-04679-7