Over the last few days, parts of Germany have been hit by some of the worst flooding seen in 100 years after heavy rains hit southern and eastern regions over a period of 4 days. Since then armies of climate charlatans have appeared in the media claiming it’s all because of man’s fossil sins.
Today the German Weather Service (DWD) issued a press release. I’ll remind readers that the DWD is now under the control of warmist activists, who have far more faith in crystal ball fortune-telling models than they do in real observations. Here are some excerpts of the DWD press release:
After the extreme precipitation of the last days, especially in southern and eastern Germany, and the subsequent devastating flooding situation, citizens are asking two questions: How often can something like this happen, and do we have to expect such extreme events more often in the future because of climate change? What follows are some explanations by the German Weather Service (DWD).”
The DWD then explains that flooding in general is nothing really unusual, but that this time the extreme flooding was due to a large weather system and the 4 days of heavy precipitation it brought with it. Some 22.75 billion metric tonnes of water fell onto Germany. That’s 22.75 cubic kilometers! Moreover, the ground had been already saturated from of a wet month of May and, to make things worse, snowmelt in the Alps added to the water mass. In summary a number of factors happened to converge.
The question of course is: Did this happen because of climate change? The DWD writes (my emphasis):
Analyses by the DWD over the period of 1951 to 2000 show no distinct trend of more extreme precipitation events can be derived. However there is a trend to more precipitation days with 30 liters and more per square meter – especially in the winter. Global warming shows an increase, which means more water vapor in the atmosphere. The latest climate analyses and projections show a tendency to more wet low pressure systems over Central Europe. The median annual number increases 20% accordingly from 1951 until the end of the century.”
As they added the word “projections” we can assume here they mean the end of the 21st century. Note how sloppy (tricky) they are with the communication by blurring the past and the future. If you read carefully, they seem to be saying no trend from 1951 to 2000, yet their projections show 20% increase by 2100, leading a reader tio believe that there is an overall upward trend. If a reader doesn’t read carefully, then he may easily get the idea that there is a “20% trend” The reality however is: their real observations show no trend, but their crystal balls foretell a 20% increase by 2100.
Should we believe the DWD crystal balls? Like Richard Feynman said: “If the observations don’t match your guess, then your guess is wrong. That’s all there is to it.” It doesn’t matter how many awards you got, how renowned the newspapers say you are, or if you think you won a Nobel Prize, or if your are the director of the Weather Service – it’s wrong.
As a final note, Dr. Roy Spencer shows us just how well 73 climate climate models are doing so far:
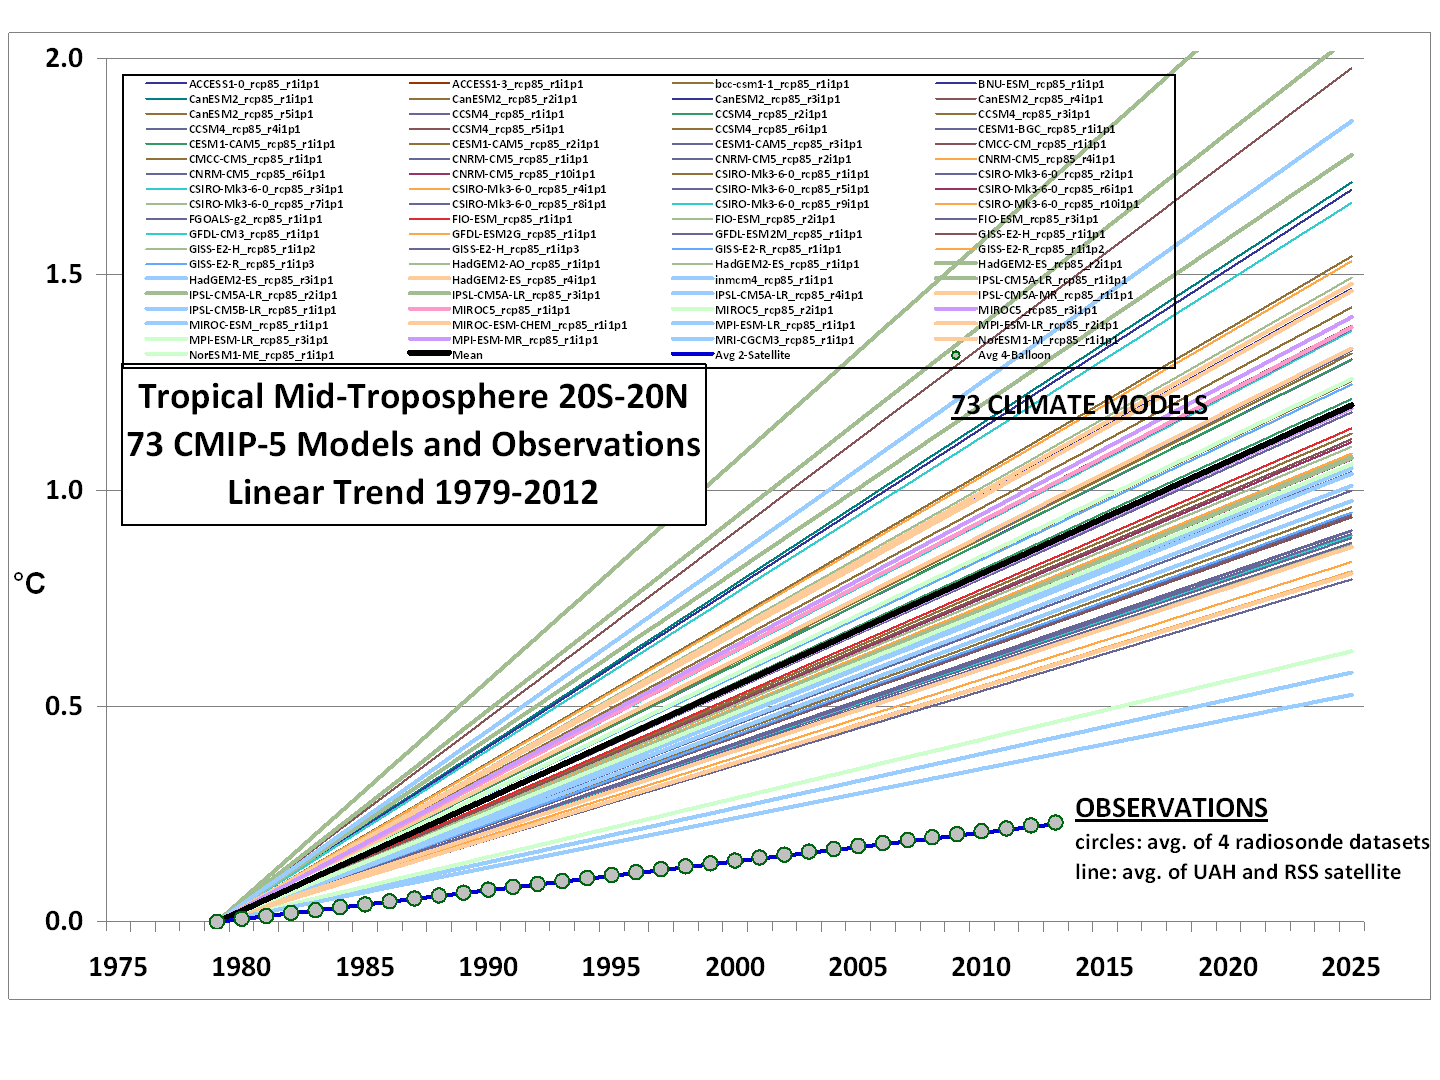
“If the guess doesn’t match the observations, then it’s wrong”. Chart source: www.drroyspencer.com/.


Water vapor reanalysis shows decline of specific humidity since 1980
http://suyts.wordpress.com/2013/06/05/climate-update-earths-atmosphere-holding-more-water-or-something/#comment-75014
Utter failure of CO2AGW theory.
DWD are liars.
No clear trend, indeed the only trend is natural.
No clear trend at Siemens either – with this confused rubbish, I thought that the Germans were building coal fired power plant at any cost and stuff to the emissions targets.
Here’s what Loescher [Siemens] thinks:
http://www.bloomberg.com/video/germany-should-focus-on-gas-plants-wind-loescher-2X0yADGfQvG_przmL~gqyg.html
Furthermore, the ETS? is it, the emissions scheme as dead as a Dodo – can the Kommissars in Brussels resurrect the ETS and bring it back from the dead – I do hope not.
When DWD says: “….this time the extreme flooding was due to a large weather system”…,
it is only partly the truth. On 3rd June warm moisture Mediterranean air was stopped along the line Marseille – Berlin
___see satellite image 03.June: http://seatraining.net/e/b/7_4_3.jpg . The big flooding became inevitable.
The reason is obvious. The North Sea, English Channel and Biscay SST (anomaly) were significant below average:
___see: 03June Atlantic SST-anomaly map: http://seatraining.net/e/b/7_4_1.jpg.
Particularly the sub-cold North Sea, showing a stark difference toward the Baltic,
___see: 03June North- and Baltic Sea http://seatraining.net/e/b/7_4_2.jpg ,
which can be regarded as a major source to stop the wet air over SE Germany. DWD does not mention the fact, neither does it offers an explanation, although the North Sea is extreme cold since early March, and is a major reason for the record cold spring 2013 as well; discussed here:
__”Cold spring 2013 in NW-Europe will last through May”; http://climate-ocean.com/2013/8_4.html
__“ ‘Urgent’ need to see if Arctic affects UK extreme cold? No! MetOffice should investigate the impact of human activities in the North- and Baltic Sea !”
http://climate-ocean.com/2013/9_4.html
Precipitation trends
and recently we had good news all round I hope. 🙂
In any chaotic system, extremes happen. On any given day, an extreme is occurring somewhere in the world. Because of modern communications, these extremes now get measured and reported. Nothing abnormal is happening, except the increasingly insane reactions of the those with an AWG ax to grind.
O/T I’m back, after 2 1/2 months of packing, moving, and vacation from the packing and moving. I finally have internet access again.
Hi Ed, welcome back! Hope things have settled down at your new home.