On Climate Sensitivity – Thunderstorms
By Ed Caryl
Everyone Is Correct – Just At Different Times.
Since the time of the patron saint of Climatologists, Svante August Arrhenius, climate researchers have been attempting to pin down climate sensitivity, the amount of warming that various constituents will cause when present in the atmosphere. This is not limited to carbon dioxide, as other gases and substances also warm and cool the atmosphere to varying degrees. The chart below is from the IPCC AR4 Summary for Policymakers.
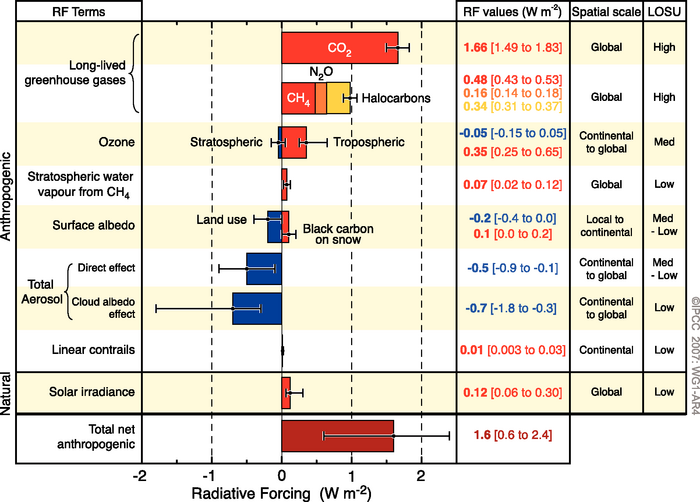
Figure 1:is found here as figure as SPM2
The IPCC believes carbon dioxide as about 55% of the positive forcing, and methane as about 16%. But water vapor is missing as a contributor in this chart, except as clouds, a reflector. Water vapor is a strong greenhouse gas. Water vapor is highly variable in the atmosphere. Over oceans relative humidity is usually close to 100%, over deserts it can be close to zero. Absolute water vapor content is also variable with temperature. In the tropics water vapor is very high. In the Arctic and Antarctic, in winter when it is very cold, water vapor is very low.
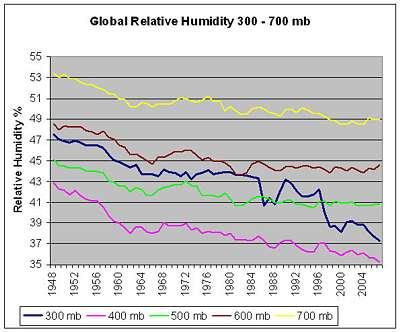
Figure 2 is Global Relative humidity in the Troposphere. Source here. A similar chart is available here along with global maps for water vapor and methane. Click on Greenhouse gases in the sidebar, then select the gas of interest. Methane sources are mostly tropical.
The IPCC believes that water vapor increases with temperature, acting as a positive feedback, further increasing temperature. But this is not happening. Global weather balloon data shows that water vapor has been decreasing over time, not increasing.
Why should tropospheric humidity decrease with temperature increasing? The answer is that humidity in the upper atmosphere is largely driven by thunderstorms (convection), and thunderstorms have been increasing.
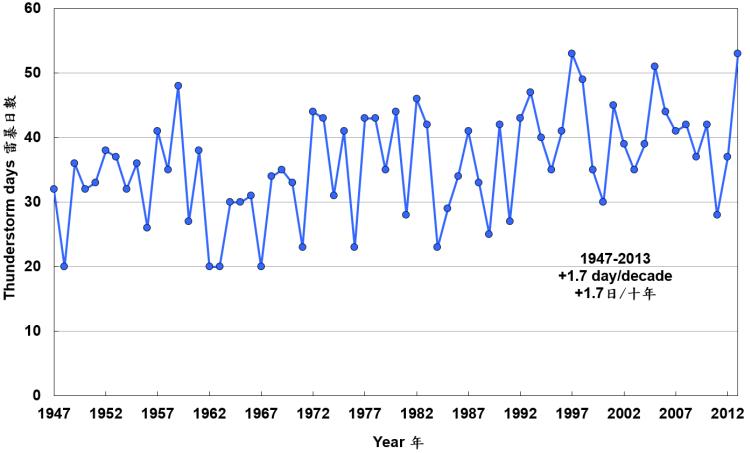
Figure 3 is the thunderstorm frequency at Hong Kong since 1947. Source here.
Most thunderstorm activity is in the tropics, and Hong Kong is subtropical at 22°N latitude, so should be representative of global activity. The data shows a low during the cool 1960’s, and a high in the warm 1990’s, with an increase of 1.7 days/decade, roughly tracking global and local temperature. Local temperature at the Royal Observatory in Hong Kong has not been corrected for local heat island, or “homogenized” by GISS. I could find no global data for thunderstorm frequency.
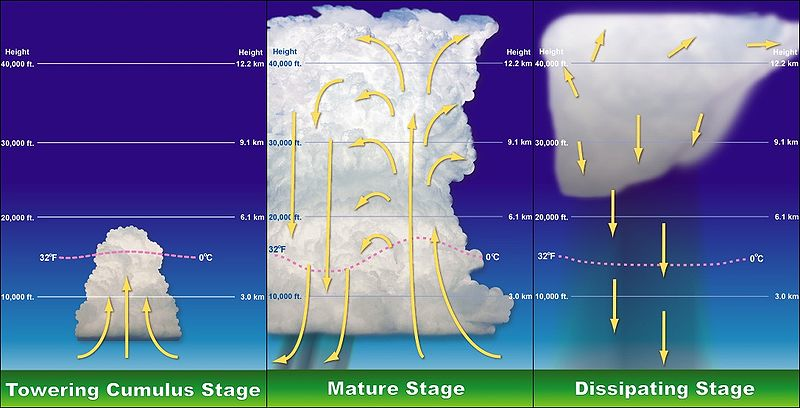
Figure 4 are the steps in thunderstorm maturation. Source Wikipedia.
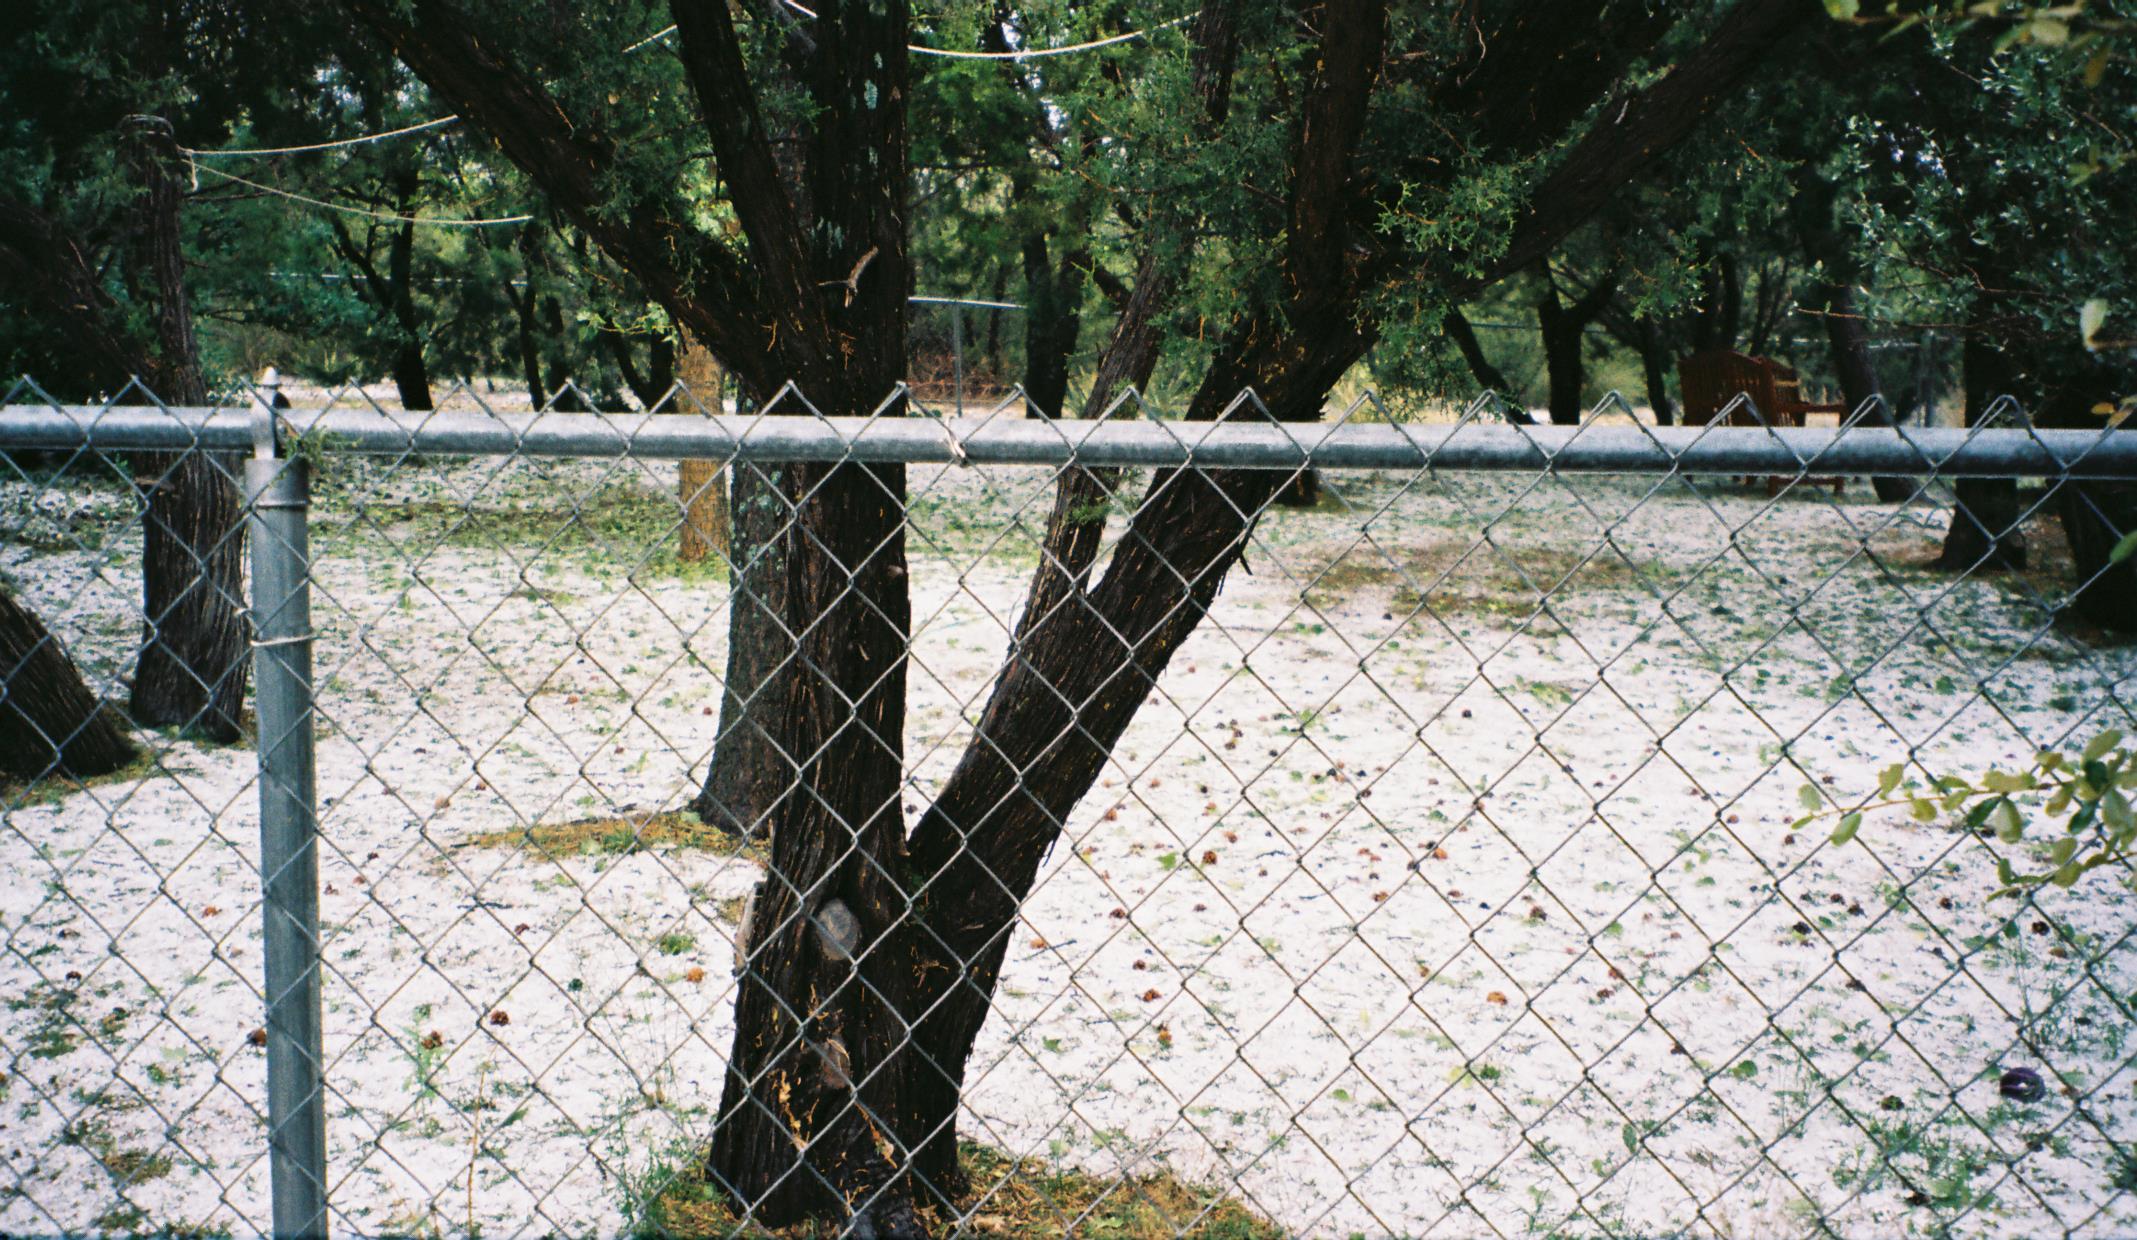
Figure 5 is the aftermath of a thunderstorm/hailstorm, near La Luz, New Mexico, USA, August 2009. Source is the author.
Thunderstorms operate by convection. As the surface heats up, air rises. If that air contains moisture, as the air rises and cools, the moisture condenses, giving up more heat. This can result in towering clouds that produce hail and rain. This leads to rapid surface cooling and heat transport to the stratosphere. The rising air is depleted of water vapor resulting in drying at all levels in the troposphere up to the stratosphere. If there are more thunderstorms, there is more drying and surface cooling. The heat transported to the stratosphere is then transported poleward by Hadley Cell circulation and radiated to space. This is one reason for the poles (at least the north pole) warming more than the tropics.
Thunderstorms are nature’s thermostats. This is easily observed. On a hot summer’s day, in the heat of the afternoon, rising thermals turn into cumulus clouds and then into rising thunderheads, followed by rain and sometimes hail. Surface temperatures under the clouds of 105°F (40.5°C) can drop to 60°F (15.5°C) in minutes. The winds felt on the ground are just the bottom portion of a loop of air that extends up through the clouds outside or trailing edge and down in the rain. At the end of the storm, when the clouds dissipate, what is left is dry air. The moisture is now on the ground as water or hailstones and the heat has been lifted to the tropopause. In temperate latitudes it may take several days for heat and humidity to build up and begin the cycle again. In the tropics, the cycle may begin the next day.
The most important area for climate regulation on earth is the tropics, and the tropics are where there is the most water vapor and where most thunderstorms occur. Thunderstorms do two things: they move heat from the surface to the top of the tropopause, and the associated clouds reflect solar heating to space. They also set the earth’s sea surface temperature thermostat to 30°C. See Willis Eschenbach’s article on the subject here. As the earth warms, more sea surface will reach the thermostat set point, and more heat will be shunted away by clouds and thunderstorms, either as short-wave reflected from the cloud tops, or long wave radiated from the top of the atmosphere. This naturally reduces climate sensitivity to more greenhouse warming. Climate sensitivity has changed over time. This is the reason that the early 20th century warming was as dramatic as it was with a small CO2 rise, and the late 20th Century warming was the same amplitude with a much greater CO2 rise. Here is a plot of 60-year window equilibrium climate sensitivity from 1880 to 2010 using GISStemp data and a combination of Law Dome and Keeling CO2 data.
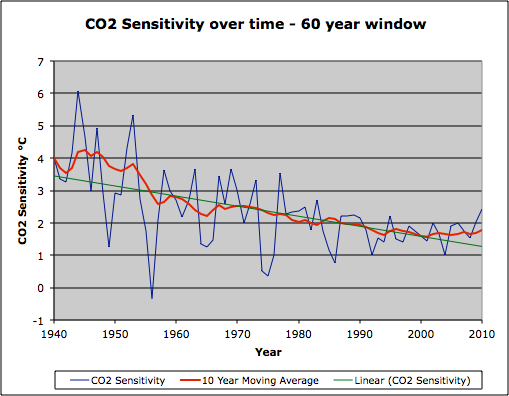
Figure 6 is a plot of equilibrium climate sensitivity assuming a 60 year window (1880 to 1940, 1881 to 1941, and so on). The window length bridges the natural climate cycles.
As the plot shows, climate sensitivity in the early 20th Century was about 4°C for CO2 doubling, but by the turn of the Century, this had reduced to about 1.5°C. It is likely approaching zero if we take out all the GISS “adjustments” and use the true temperatures. This explains the “pause” of the last 17 years. The temperature cannot rise higher because we can’t warm beyond Mother Nature’s thermostat set point, set by the maximum sea-surface temperature.


I can see that as at least part of the picture. I think Figure 6 should have a bit of a disclaimer – this is the most the CO2 sensitivity could actually be given the data, not necessarily what it is. I think true CO2 sensitivity is virtually nil.
I had some similar thoughts about convective cooling, which could include thunderstorm activity, which I posted here today. This explains mathematically how we could be, and why we probably are, at a null sensitivity point.
As my last paragraph says, if all the GISS adjustments are taken out, it will be close to zero. There are plenty of other indications that is very low, or zero. I will discuss some of those in a future article.
Indeed to maintain equilibrium, more warming does lead to more cooling.
You are confusing localized and transient weather for a global temperature thermostat. It is obvious to me that no one–believers in the consensus and skeptics alike–is learning anything.
When a graph such as Figure 6 is prepared there ought to be a disclaimer placed across it somewhat like the word “shutterstock” in this image:
http://ts1.mm.bing.net/th?id=HN.608020167780007991&w=233&h=185&c=7&rs=1&pid=1.7
Words to the effect that “numbers in this chart are wildly exaggerated” or design an icon that conveys such a message. 🙂
The letters or icon should be boldly colored and difficult to remove so that the chart cannot be used easily for a nefarious purpose. See the post and my comment here:
http://stevengoddard.wordpress.com/2014/03/17/back-to-the-16th-century/#comment-327936
Note especially what was done on the WUWT link.
I’m glad you liked it. You can do the calculations yourself. The data is available.
Figure 6 shows climate sensitivity as high as 6 C. degrees (1945?) and more recently about 2.5 (2010). In your written word you claim it is very low, or zero. Mr. Greg Laden is most likely to use the chart and not the words.
Ed, your time-sensitive climate sensitivity is consistent with Beenstock & Reingewertz’ time series analysis; where they find that CO2 concentration cannot cause temperature, but the derivative of the CO2 concentration can.
Yes, the derivative of CO2 and SST track, but which is cause and which is effect? Salby thinks SST and soil moisture is the driver. I think it is just SST.
If the derivative of CO2 were that cause rather than the effect, you would have the glaring paradox that you could pump the atmosphere to 10,000 ppm but, once you stopped pumping, temperatures would settle back to where they began. You could raise CO2 by a fraction of a ppm in a short time, and the Earth would fry.
Obviously, this makes no sense. The rate of CO2 is the effect, not the cause.
Beenstock and Reingewertz have made a purely statistical analysis and do not speculate about physical mechanisms. Their analysis was a test for possible Granger-causality. The test does not prove a given causality, but it can rule it out.
Oiy vey….really? How long are you guys going to “milk” that bogus line anyway? Until the next La Nina (2014 – 2015)? You guys CAN do better than that…:)
http://globalnews.ca/news/967058/researchers-find-explanation-for-global-warming-pause/
Greenland ice sheet melt accelerating:
http://www.sciencedaily.com/releases/2014/03/140316152955.htm
Climate sensitivity shown to be higher than previous estimates:
http://www.accuweather.com/en/weather-blogs/climatechange/climate-sensitivity-to-co2-sho/21841419
Antarctic ice sheet melting faster:
http://www.upi.com/Science_News/2013/12/13/Satellite-confirms-accelerating-melting-of-antarctic-ice-sheets/UPI-96411386979787/
Other than that……you were “spot on”….:)
Cheers……:)
You’re completely off topic, Buffy; you sound like a broken record; and you seem to be in the EU. Interesting. Do you work in Brussels.
You are such fun, Buffy.
Cowton and Way have been refuted by many, and I have refuted that paper here myself.
https://notrickszone.com/2013/11/24/cowtan-and-way-which-bias-was-it-again/
Greenland ice builds up in the center and melts at the edges. It also melts during interglacials generally. That ten-year study is during the current Arctic warm cycle, it was done by people that want to find melting, Greenland still isn’t down to were it was during the Eemian interglacial, and at the current rate it will take 10,000 years or so to reach that point.
That climate sensitivity paper is models all the way down. Data free. Totally wrong.
The Antarctic paper is referring to the WAIS, not the whole ice sheet, a three-year period is hardly a trend, it usually takes three years to calibrate satellite data, and there may be an active volcano under there.
You need to widen your education and get away from the alarmist sites.
There needs to be more attention to research conducted by the Connollys and reported in their papers and discussions here: http://globalwarmingsolved.com/2013/11/summary-the-physics-of-the-earths-atmosphere-papers-1-3/
They investigated readings from radiosonde balloons, attempting to measure the impact upon the atmosphere’s temperature profile from increasing amounts of GHGs. The climate models include assumptions about tropospheric warming and stratospheric cooling that are not supported by the observations. This should be a big deal, and reminds me of John Christy’s APS presentation.
Uh oh…… Norway’s sovereign wealth fund moving $$$ into renewable energy. Interesting to see the movement of investment $$$ into renewable and sustainable energy.
It’s almost as though they want a SUSTAINABLE and clean future. Interesting…….. Just trying to figure out why countries are now looking at clean energy…..sustainable farming methods……healthier diets.
It’s almost as they they want a better earth. What an interesting thought. Energy that doesn’t pollute the atmosphere and our water supply……..diets that provide for a healthier population. What WILL they think of next?
http://thinkprogress.org/climate/2014/03/14/3403251/norway-sovereign-wealth-fund-renewable-energy/
Some people have money to burn. Norway has gotten super-rich from gas and oil.
Hypocritical Norwegians should scuttle their oil drilling platforms if they really mean it, don’t you think so Buffy? Norway is killing the planet!
Norway has plenty of hydroelectric capacity to power it’s country, yet it continues pumping lots of North Sea gas and oil. It won’t stop because it makes too much money exporting both.
Buffy! Look what CO2 has done!
http://www.agry.purdue.edu/ext/corn/news/timeless/images/CornYieldTrend_US.gif
We’re doomed!
We will be buried alive by corn.
You say
“The IPCC believes carbon dioxide as about 55% of the positive forcing, and methane as about 16%”.
This was what they stated in AR4 in 2007. By AR5 in September 2013, the CO2 was 50% and CH4 29% of the positive forcing of 3.33Wm-2 since 1750.
http://manicbeancounter.com/2013/09/28/radiative-forcing-unipcc-ar5-undermines-ar4-but-scientists-have-unshaken-confidence-in-their-work/
It does not detract from your article. However, the deceleration in the rate of rise in methane levels in the 1990s may have had a minor impact on the pause in temperature rise if the revised significance of methane is taken into account.
Yes, I should have used the AR5 numbers. My mistake.
The methane levels may be driven by temperature and not the other way around, but not from Arctic melting. Check the methane source map at the link in the article. All the methane sources are tropical or subtropical except for eastern China. There are no sources in the Arctic that even show.
Ed.
Thank you for responding. I have looked at the data for methane levels at methane levels at http://www.climate4you.com/. The data does indeed support your belief that methane levels are driven by temperature. But that measured data only goes back to the 1980s. Methane levels were rising rapidly in in 1980s, slowed in the 1990s, almost stopped from 2000-2007, rising very slowly thereafter. Currently atmospheric methane levels are around 1700-1850 ppb (1.7 to 1.85 ppm)
This hypothesis is not contradicted by the Vostok ice core records of the last 800,000 years. The levels of methane (like CO2) appear to fluctuate with the temperature. http://cdiac.ornl.gov/images/vostok_co2_ch4_from_bubbles.jpg
But methane levels were between 400 and 700 ppb.
The Law Dome ice core figures for the last 2000 years tell a different story.
http://cdiac.ornl.gov/images/three_gases_historical.jpg
Like for carbon dioxide, the levels were pretty constant until the late C17th, when they increased. From 1750 to the late C20th, they levels of methane doubled. In 1750 they were already at the highest levels for 400,000 years. A human influence seems to be more apparent than for CO2.
The Law Dome ice cores are amongst the highest quality ice cores available. There is also un-archived data for O18 surface temperature proxies, which show a distinct medieval warm period.
http://climateaudit.org/2012/06/12/an-unpublished-law-dome-series/
This would suggest, from the same ice cores, that methane levels in the last two millennia do not follow temperature, but do respond to human emissions.
Here is the anomaly. For over 200 years methane levels possible rose to unprecedented levels in line with human emissions. But in the last 15 years when human emissions (quite possibly) have accelerated, this apparent link has been broken. In mitigation policy terms it suggests that small (less than 30%) reductions in global CH4 emissions will have no discernable impact on levels, but huge (60%+) reductions will. This is in contrast to CO2 emissions against CO2 levels. Over the past 60 years, about 15-18 billion tonnes of CO2 emissions result in a 1ppm increase in CO2 levels. The quantity is gradually decreasing as total CO2 emissions increase.
CH4 is an unoxidized molecule. From bacteria to lightnings to radicals, everybody wants to reduce it. Assuming it can accumulate the way CO2 does is nonsense. Totally different pathways have to be modeled; and aren’t.
“It is likely approaching zero if we take out all the GISS “adjustments” and use the true temperatures.”
This is the nub of the problem. As you say the Arctic acts as the radiator of the heat engine that transfers heat from the tropics via the Hadley cell. But, if we use the correct temperature data, that is raw data – or that which has been corrected for UHI effects in the right direction! – then there has been no warming in the Arctic over that experienced in the 1930’s.
Whilst The GISS, Hadcrut4 and other series show a significant warming during the 20th century that is greatest in the Arctic region, in line with the claims of Arrhenius that a doubling of atmospheric carbon dioxide would result in warming mainly in this area, at night and in the winter, an analysis of long run raw temperature records from around the Arctic Rim in the database of John Daly (http://www.john-daly.com/stations/stations.htm#Europe ) we find that in most cases those with a 100 year record show warming in the 1930’s to 1940’s as equal to or greater than the end of the century when atmospheric carbon dioxide levels were much higher, or no trend. Looking at the recent BEST data shows that they use the same raw data for these stations but by data manipulation or adding in shorter records from the same areas, change the overall trends to one of +0.7C or greater.
The Swedish scientist, Karlén made a plot of 25 data series from the NordKlim database and found similar results that contradicted the IPCC data:
http://hidethedecline.eu/pages/posts/scandinavian-temperatures-ipccacutes–scandinavia-gate–127.php
http://geoclimate.se/articles/20131107_GISS_Wibjorn_Karlen.pdf
His studies are detailed in the post at WUWT (http://wattsupwiththat.com/2009/11/29/when-results-go-bad/) in which he states
” In attempts to reconstruct the temperature I find an increase from the early 1900s to ca 1935, a trend down until the mid 1970s and so another increase to about the same temperature level as in the late 1930s. … In my letter to Klass V I included diagram showing the mean annual temperature of the Nordic countries (1890-ca 2001) presented on the net by the database NORDKLIM, a joint project between the meteorological institutes in the Nordic countries. Except for Denmark, the data sets show an increase after the 1970s to the same level as in the late 1930s or lower. None demonstrates the distinct increase IPCC indicates. The trends of these 6 areas are very similar except for a few interesting details. … I have in my studies of temperatures also checked a number of areas using data from NASA. One, in my mind interesting study, includes all the 13 stations with long and decent continuously records north of 65 deg N.
The pattern is the same as for the Nordic countries. This diagram only shows 11-yr means of individual stations. A few stations such as Verhojans and Svalbard indicate a recent mean 11-year temperature increase up to 0.5 deg C above the late 1930s. Verhojansk, shows this increase but the temperature has after the peak temperature decreased with about 0.3 deg C during the last few years. The majority of the stations show that the recent temperatures are similar to the one in the late 1930s.
In preparation of some talks I have been invited to give, I have expanded the Nordic area both west and east. The area of similar change in climate is vast. Only a few stations near Bering Strait deviates (e.g. St Paul, Kodiak, Nome, located south of 65 deg. N).
One example of published data not supporting a major temperature increase during recent time is: Polyakov, I.V., Bekryaev, R.V., Alekseev, G.H., Bhatt,U.S., Colony, R.L., Johnson, M.A., Maskshtas, A.P. and Walsh, D., 2003: Variability and Trends of Air Temperature and Pressure in the Maritime Arctic, 1875-2000. Journal of Climate: Vol. 16 (12): 2067ñ2077.
He included many more stations than I did in my calculation of temperatures N 65 N, but the result is similar. It is hard to find evidence of a drastic warming of the Arctic.”
It is high time we had a new temperature series based only on continuous records from 1880 or earlier that have not been adjusted other than for known UHI effects. There are some 424 such land records giving good coverage of the contiguous USA and adequate numbers from Europe and the Arctic regions. As most of the claimed warming is in these areas we can ignore the data from elsewhere.
Peter, you might be interested in this paper:
https://notrickszone.com/2010/09/21/a-light-in-siberia/
“Climate sensitivity has changed over time. This is the reason that the early 20th century warming was as dramatic as it was with a small CO2 rise, and the late 20th Century warming was the same amplitude with a much greater CO2 rise. “
I am not so sure about your explanation for this as the impact of water vapour on the radiative forcing of CO2 in the Arctic is low. So, if we accept the analysis of Karlén and others that there is little difference in the temperatures around the Arctic Rim between those in the 1930’s and mid 1990’s (at the peak of the warming attributed 50%+ to CO2 by the IPCC) we need another explanation. One would be that of Miskolczi of constant optical thickness of the atmosphere with increased CO2 compensated by decreased atmospheric water vapour.
http://climateclash.com/ferenc-miskolczis-saturated-greenhouse-effect-theory-references/
This is supported by the satellite data, as you show, but would be less in regions like the Arctic where water vapour levels are low anyway, though it may not just be the level of water vapour that counts but the form and distribution – clouds (height and type), ice crystals etc – see the study of Stephens later:
http://www.seafriends.org.nz/issues/global/climate2.htm
And, as Judith Curry, finds the effects of clouds in the Arctic are complex and differ by season.
http://webcache.googleusercontent.com/search?q=cache:http://www.curry.eas.gatech.edu/currydoc/Curry_JC9.pdf
However, this lower effect of the water vapour / CO2 balance in the Arctic could also be mediated by the net absorption of emitted carbon dioxide in northern regions by forests, as shown by the Ibuki satellite data
http://johnosullivan.livejournal.com/41060.html
And also the AIRS satellite data – showing that atmospheric carbon dioxide levels are higher in tropical areas where there is most competition from water vapour – this also supports the view that a large part of the increased atmospheric carbon dioxide is due to increased ocean warmth as solar activity increased at the end of the 20th century and especially surface TSI from reduced cloud cover, as you discussed in your paper:
https://notrickszone.com/2013/03/02/most-of-the-rise-in-co2-likely-comes-from-natural-sources/
Thus in the Arctic area the increase in CO2 was likely (an IPCC statistical term!) smaller and there was a greater uptake into biomass compared to the 1930’s.
http://theresilientearth.com/?q=content/going-green-rising-co2
So, in attempting to compare climate sensitivity to carbon dioxide between the warming of the 1930’s and 1990’s we have a difference in the carbon cycles to take into account, and as Freeman Dyson points out this is the “elephant in the room” for the CACW meme.
Note that any argument that lower atmospheric water vapour is offset by lower growth rate of trees from reduced precipitation is answered by the reduced transpiration of plants with higher rates of carbon dioxide via lower numbers and size of stomata. Arguments that Arctic temperatures must have risen because of the ice loss post 1979 ignore the fact that the Arctic warming in the 1930’s was linked to a pulse of warm water from the northern branch of the Gulf Stream spilling over into the Arctic ocean where it takes about 13 years to circulate. And we now know that there are numerous cyclones in the Arctic region that depending on strength and direction break up the ice, drive it our through the Bering Straits and/or up against the shorelines and then bring up warmer water to the surface where it is responsible for further ice melt and some increase in atmospheric temperatures but also a convective effect that increases cloud cover and loss of heat to space.
http://wattsupwiththat.com/2013/12/12/ice-melting-arctic-cyclones-more-common-than-previously-thought/#more-99104
http://wattsupwiththat.com/2014/03/04/nsidcs-greenpeace-connected-researcher-claims-less-days-of-arctic-sea-ice-being-seen/#more-104360
http://www.arctic.noaa.gov/detect/climate-clouds.shtml
The variations in atmospheric carbon dioxide, ocean, atmospheric and land temperatures, surface TSI, wind patterns etc argue for modeling climate on a regional and zonal basis rather than putting all the data into one pot and macerating it to give global values of dubious value. Then the work of Tsonis and the Stadium wave concept of Wyatt and Curry can be used to bring together the interactions between these zones into some meaningful climate change theory. That this applies to the calculation of climate sensitivity is suggested by Stephens (2005) when reviewing the potential impact of clouds on climate sensitivity where he finds that rather than the linear relationship between global temperature and global radiation balance at the TOA
“ it is the accumulated result of complex regional responses that appear to be controlled by more local-scale processes that vary in space and time” and if so the climate sensitivity used by the IPCC is of limited value and restricted to inter model comparisons .
:
Cloud Feedbacks in the Climate System: A Critical Review, Stephens, Journal of Climate (2005)
http://citeseerx.ist.psu.edu/viewdoc/download?doi=10.1.1.130.1415&rep=rep1&type=pdf
Clearly we are dealing with a complex system and climate science, at least that practiced by acolytes of the IPCC, is not looking at the problem in right way in assuming that CO2 is the major driver of climate change.
I missed out an important reference to factors that make the greatest contribution to climate sensitivity calculations on a the basis of geographic areas and climate zones:
http://www.sciencedirect.com/science/article/pii/S0921818101001424
Heavy use of models, not much sign of actual data use, and behind a paywall. My big oil/coal/gas check has never arrived, and I won’t pay to be brainwashed.