Large scale oceanic oscillations responsible for most of the post 1980 “warming”
By Joe Bastardi
I think global warming is a misnomer.
There is a distortion of the temperature pattern on the globe, brought about by the natural cyclical warming events of the warm PDO and warm AMO together. I spoke about this at Heartland a couple of years ago – how the sea ice increase in the south and the decrease in the north were the hidden message that here is no “warming” just a distortion.
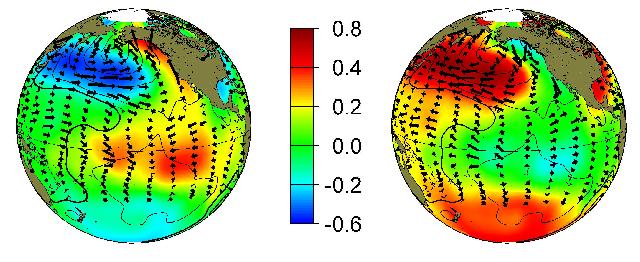
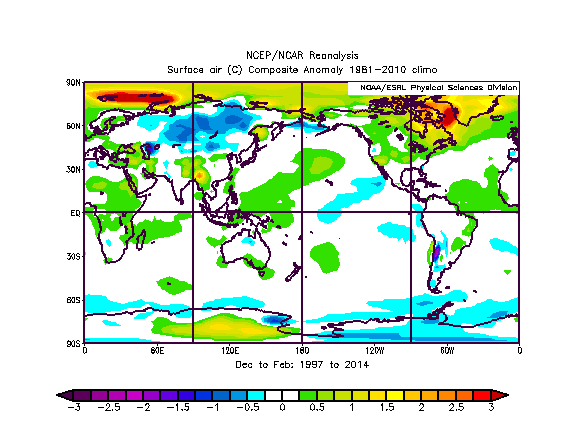
When the tropical Atlantic and Pacific warm in tandem, there is a natural warming that takes place, especially in the northern hemisphere. The Pacific warming after both oceans being cold is a much more dramatic event, as it is the biggest ocean. The fact we have more land in the northern hemisphere and that the Arctic is surrounded by land means the summer seasons over the land masses can be hotter. Also the oceans in the north near North America are warmer. One can see this on the example of the warm PDO (left):
Modes of the Pacific Decadal Oscillation, warm (left); cool (right. Source: jisao.washington.edu.
Notice the warmth near Alaska, yet the cool on the southern side of the globe near Antarctica. NOTICE THE TROPICS, THE NUMBER ONE SOURCE OF ENERGY TO DRIVE THE CLIMATE, are warm. This adds more heat and moisture to the air, warming the atmosphere. It’s why we saw the rise in temperatures in the 1980s and 1990s. In the cool version (right) the heat is where it had been cool earlier. So the southern oceans around Antarctic are cool in a warm PDO, but warm in a cool PDO.
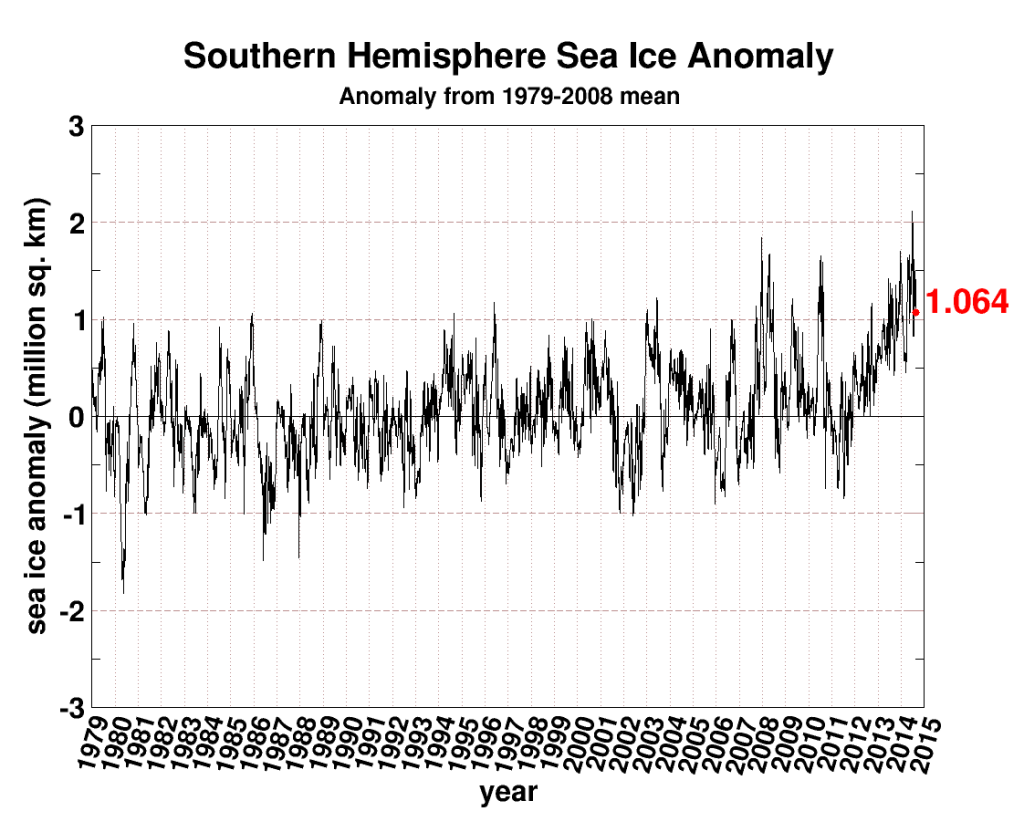
Look at the graphic of Antarctic ice below: it fits perfectly. At the start of the warm PDO around 1980, the ice was below normal, but the NATURAL cooling, compensating for warming in the tropics and north during the warm PDO, means the stage is set for the Antarctic ice increase:
Source: arctic.atmos.uiuc.edu
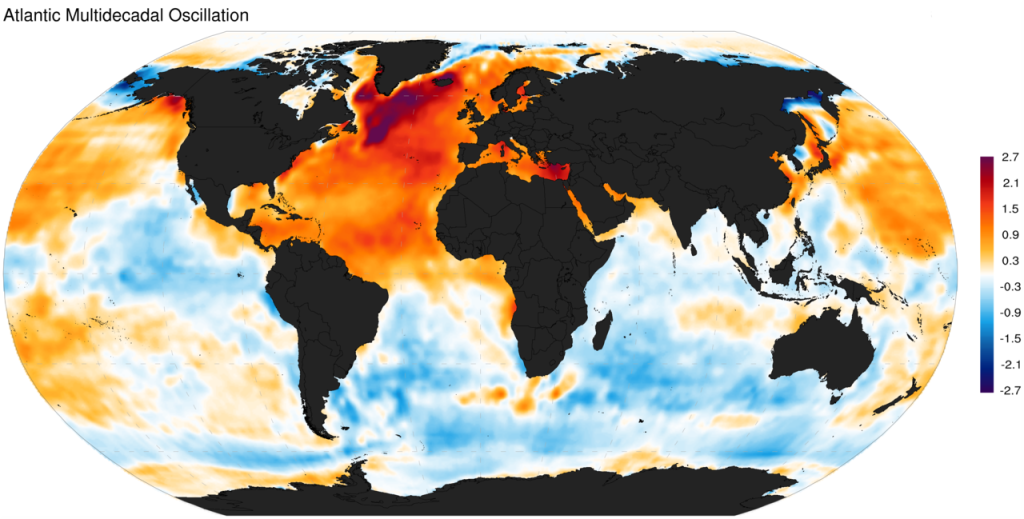
Now look at a warm AMO example:
The Arctic’s exposure to the warm oceanic currents is much greater from the Atlantic side. This warm water moving toward the Arctic ocean obviously has a huge impact.
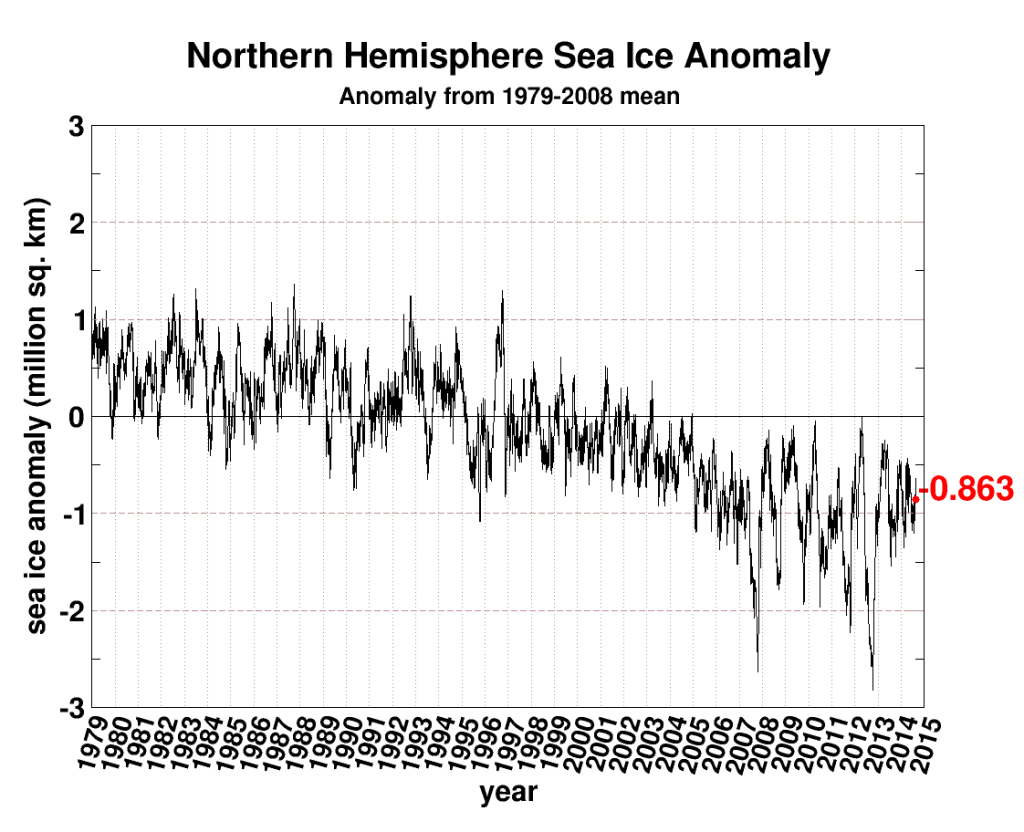
The deck is stacked to warm the northern hemisphere, jack up the global temps and shrink the Arctic ice. But at the start of the period, because the cold PDO and AMO together in the 1970s cooled the Arctic, the Arctic ice cap was way above normal.
Source: arctic.atmos.uiuc.edu
BUT NOTICE THE SOUTHERN OCEANS WHEN THE ARCTIC WARMING IS GOING ON! THEY ARE COOLER!
Bingo, this is compensating cooling. So there is a cyclical distortion. The real key is measuring the water vapor, using temperatures is the wrong metric! Because without the amount of water vapor increasing, there can be no trapping. Co2 is 1/100th of the GHG and it’s likely that’s just about its influence on the entire shooting match of temps. It is estimated that the GHG blanket adds 33°C to the planet’s temperature. Co2 is boxed in at a range of 0.4 to 0.7 of that. It can do nothing because of all that is around it.
This explains perfectly the whole temperature pattern. Given the way we measure temperature, and the fact most of the warming has been in the Arctic in its cold season when there is little overall effect on the water vapor at such cold temperatures, it is highly likely that the subtle compensating cooling in the south over a much more moisture-laden atmosphere means there is no change in the true global temperature. What is happening now is that the atmosphere has adapted to the added warmth in the same way your shower room adapts to the turning on of a hot shower. So what happens when you turn off the shower (i.e. oceans flip their cycles)? It cools.
Notice the cooling in the Antarctic summer, limiting the ice melt season!
We are now in the period of “temperature leveling off”, where the atmosphere is readjusting from the previous increase in heat and moisture from the warmer cycles.
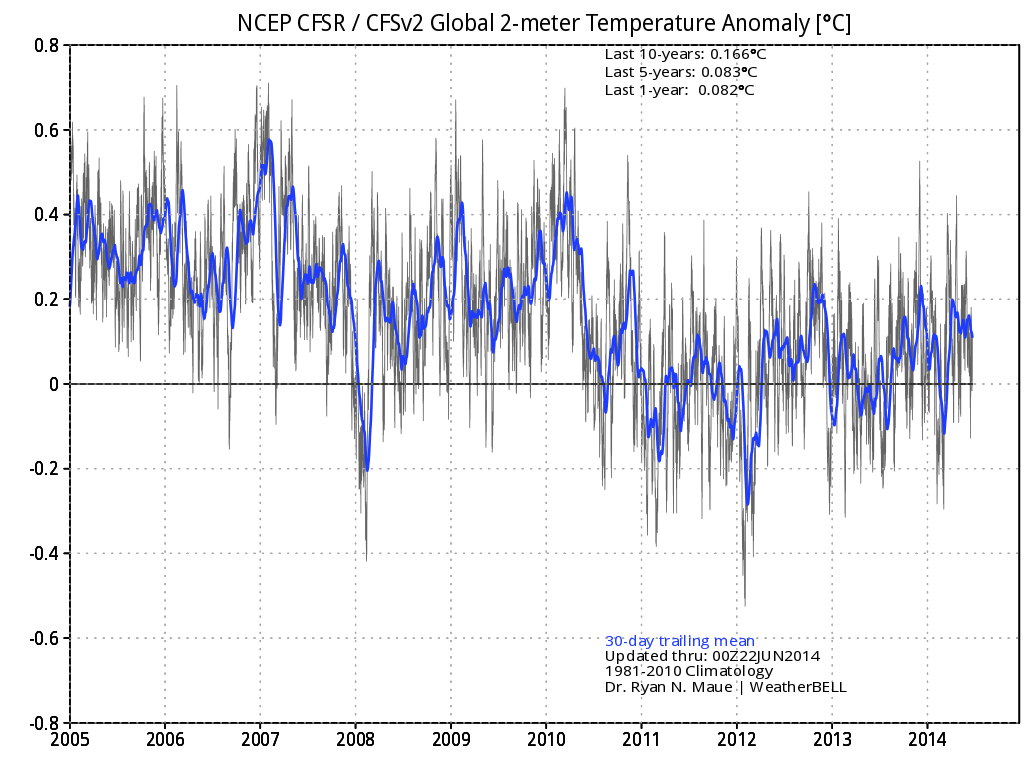
So here is the test we are in. I said in 2007 global temps would come down because of the shift in the PDO. Since 2005, its plain to see a slight downturn in a jagged fashion has started – just as I predicted 7 years ago:
The reason for the fewer, less intense El Ninos is because we are going back to the cycle of the colder PDO periods, plainly evident in the Multivariate Enso Index.
You can see the warm PDO and the major ENSO events that occurred when the globe warmed and the leveling off since then. Naturally, once the Atlantic flips, the global temps will return to where they were, as measured by satellite, at the start of the satellite era, which coincided with the START OF THE WARM PDO!
Its intuitive and natural…if you warm the tropical Pacific, you warm the temperature, but the compensating cooling is waiting in the longer term. That was my idea with the triple crown of climate back in 2007. The sun, the oceans, and stochastic events rule the climate.
So the test is on, and it doesn’t cost 165 billion dollars to justify an agenda (amount US has spent on climate change). It takes a working knowledge of where the climate has gone in order to know where it is likely to go. Once the AMO flips to its cool phase, global temperatures will begin a descent much like the ascent we witnessed back in the 80s and 90s, which got us to our current plateau.
The Arctic is already showing, with the lack of ice melt this summer, what it will do once the AMO flips for good (in 5-10 years). It will recover. The global temperature will drop, but it will not be a drop representing a coming ice age or true cooling, just the cycle swinging back the other way. Meanwhile the Antarctic cap will retreat, eventually to levels seen in the 1970s and early 1980s.
If the southern ice cap does not shrink, then that will be a problem, but I have confidence it will.
When you are right, there are reasons. And when you are wrong there are often excuses, which is what you see from the people today who label the very people who said there is climate change (naturally) and made the correct forecast, as Deniers. The real danger to the globe is not global warming, it’s the global warming agenda. In a way, that is what the increase in the Antarctic ice cap shows you.
See Joe explain it here at the Saturday Summary.


I have a massive respect for Joe B. He is brutally honest and open about what he knows and deosn’t know and he puts out his forecasts and knowledge to be shot down and critiqued. There is no-one in any of the western gove orgs about whom I could say that.
Rarely do you see a meteorologist live and breath what he does like Joe does.
Are my following observations correct?
The IPCC was established in 1988.
The Atlantic multidecadal oscillation (AMO) was identified in 1994.
The Pacific decadal oscillation (PDO) was identified in 1997.
Thanks Joe. Very well reasoned and explained mechanism. When the Antarctic icesheets refuse to decline we have indeed a problem in the longer run.
Thanks Joe. Just eyeballing the graphs it has appeared to me for some time that there was a sixty something year cycle with northern and southern hemispheres out of phase. Not neccessarily exactly anti phase though.
Jimbo asks: Are my following observations correct?
May be officially recognized, but that doesn’t mean that there were not scientists and meteorologists that recognized the cycles years if not decades before that.
The so-called “stadium wave” narrative (Curry & Wyatt) completely overlooks why the wave isn’t damped.
The multidecadal seesaw is a phase effect riding on the broader amplitude context:
http://s12.postimg.org/wu9x6zpl9/Sun_Wind.png
Sun & SAM
There’s nothing anyone can do to correct the naturally permanent & fatal corruption of solar & climate “science”.
Elaboration: Chylek’s seesaw viewed out-of-larger-context plays directly into CO2 alarmists hands:
http://tallbloke.wordpress.com/2014/08/25/has-joe-done-what-uncle-sam-couldnt/comment-page-1/#comment-87037
Important: Deeply understand firsthand exactly why the alarmists chop off the early part of PC1 — for example: fundamentally misleading figure 1a here:
Dai, A. (2013). The influence of the inter-decadal Pacific oscillation on US precipitation during 1923-2010. Climate Dynamics 41, 633-646.
http://www.cgd.ucar.edu/cas/adai/papers/Dai-IPO-US-P-ClimDyn2012.pdf
Remember this though. If I was interested in getting more attention, why would I not hype all this more? The number on profit centers for someone like me would be green energy, since it is directly impacted not only seasonally , but every day, but the weather, and so there would be more demand for someone like me. I have nothing against any form of energy that can elevate the human condition. But what I have done here is turn this into a forecast.. The first forecast was made with the triple crown of cooling (climate) on the Oreilly factor several years ago. one must weigh the variables, and then assign value. So the question is, does the increase in 1 molecule of co2 for every 10k molecules of air in the last 100 years have any measurable impact vs the sun/oceans/stochastic event. I guess that is the 165 billion dollar question, but anyone with a nickels worth of sense can answer that.
I love your work Joe.
And I think you meant to type “number ONE profit center” and “but everyday, BY the weather”.
Joe,
I appreciate all your hard work on behalf of reality.
It must be extra frustrating for you, as a scientist, to witness what is going on in the climatology field.
Keep up the great work. The truth will out!!
Well done Joe! we are all being conned, and anyone who cannot see it is as guilty as the offenders.
[…] https://notrickszone.com/2014/08/24/a-single-meteorologist-explains-what-165-billion-in-government-fu… […]
[…] A Single Meteorologist Explains What $165 Billion In Government-Funded Climate Science Couldn’t. […]
Hello Joe, you say that the planet will simply revert to the pattern of heat distribution which we last saw in the 70’s/80’s, without any net cooling, once AMO has turned fully negative. Is this taking into account any influence of a predicted very weak Solar Cycle 25?
There is a clear correlation between AMO and NH temperatures on this Woodfortrees graph.
http://notalotofpeopleknowthat.wordpress.com/2014/08/22/correlation-of-the-amo-with-nh-temperatures/
There is a clear correlation between North Atlantic SSTa (AMO with long term trend included) and GLOBAL temperatures on these two WfT graphs:
http://woodfortrees.org/graph/hadcrut4gl/from:1856/compress:6/plot/esrl-amo/offset:-0.1/detrend:-0.4/compress:6
http://woodfortrees.org/graph/hadcrut4gl/from:1856/compress:6/plot/esrl-amo/offset:-0.37/detrend:-0.4/compress:6
Except that strange sudden global step change UP in the 60s. Just when the alleged ‘divergence problem’ arose …
What’s up with that!?
PDO was very clearly warm (consistently positive) between 1976/77 and 1988. But that’s it. After that, other North Pacific SSTa patterns replaced it as the dominant one (e.g. ‘Victoria Mode’). There is no trendwise correlation between global temps and PDO post 1988.
There IS, however, a very good correlation between global temps and North Atlantic SSTa (AMO with natural trend included) all the way.
The AMO is driven by the Pacific, but NOT by the PDO. PDO is just ONE expression of different climatic modes in the Pacific basin.
I wish we’d stop being so hung up on PDO. PDO is very much associated with the Great Pacific Climate Shift of 1976/77, but that’s it.
The Pacific climate regime shifted abruptly in 1976/77, with the substantial drop in mean level SOI. After that it’s ENSO (East+West Pacific in reverse relation) and AMO all the way.
Pacific (full ENSO) > AMO > global.
(East+West Pacific in INVERSE relation)
[…] and global-warming skeptic Joe Bastardi has a fairly straightforward theory that models natural climate change in a way that tracks neatly with the accumulated data. […]
[…] https://notrickszone.com/2014/08/24/a-single-meteorologist-explains-what-165-billion-in-government-fu… […]
Joe Bastardi wrote:
“…how the sea ice increase in the south and the decrease in the north were the hidden message that here is no “warming” just a distortion.”
The changes at the poles are hardly symmetrical — Arctic sea ice is melting about 10 times faster than the Antarctic is gaining ice.
This is determined by physics — not “hidden messages.”
This is nothing but the typical (embarrasing) hand-waving chatter that comes out of Joe Bastardi all the time. Has even one of his predictions every come true? Has any of his “work” ever been submitted to science journals, or presented at a seminar that wasn’t a bunch of old men finding comfort in one another’s misunderstandings?
“Another Joe Bastardi Failed Prediction,” 1/19/12
http://davidappell.blogspot.com/2012/01/another-bastardi-failed-prediction.html
Careful with the ageism, David, or I’ll start talking about obesity.
Wow! You found one prediction he didn’t get right. In my view embarrassing is that 97% of your models have been completely wrong and temperatures over the last decade have done OPPOSITE of what you predicted. On peer-review, How can anyone who is right get a paper through when the reviewers are the ones consistently wrong? Peer-review today in climate science is a Farce.
Do you have any other senseless comments, Mr Appell?
Linking climate change to the sole factor of CO2 in the atmosphere is preposterous. And until you “climate scientists” get back to reality, do not expect any critics to take you seriously at all.
Can anyone help? At the back of my mind is that the Ross Ice shelf lost 26% of its area rather rapidly in the late 1950’s to mid 1960’s. This was subsequently found by a scientist plotting the position calls of whaling ships at the time. He noted that they were able to get hundreds of kilometres closer to Antarctica than a few years previously.
I have never been able to find the original reference (I may have heard it on the radio) but this would seem to reinforce J. B’s claim than a cold climate in the North means ice melting in Antarctica.
certainly a far more plausible scenario than the magic gas hypothesis. any doubting the effect of oceanic cycles need only google gadoid outburst . interestingly there has been a massive increase in recruitment of the gadoid species along with mackerel and herring in the northeast atlantic since 2009 ,indicating the switch has already begun to the negative phase.
nice to see someone with the balls to provide a falsifiable prediction.
david appell provides the usual climate comedian quote of the day with a reference to “failed prediction” . oh how i laugh when i reference that against the super accurate predictions the climate science community have given in the last 25 years.
david,this is the real world where people form their own opinions,not the university classrooms full of brainwashed students primed from early education to believe the nonsense fed to them by a bunch of tree huggers masquerading as “scared scientists”.
INTERESTINGLY this has been predicted by someone at the FAO!
http://www.fao.org/docrep/005/y2787e/y2787e08.pdf
See page 53, Table 9.1, for Atlantic Herring!
Prediction made by a model using a 55 year cycle.
Not a climate model.
Climate models are negative predictors it seems.
thank you for that very interesting link dirkh . as a recreational fisherman with many friends in the commercial fishing sector i find it strange that climate scientists do not look for more key indicators of cyclic change in the natural world . the predictions made in this model are at present being verified , and i fully expect that the next ten years will reflect the trend predicted .
http://www.newclimatemodel.com/the-real-link-between-solar-energy-ocean-cycles-and-global-temperature/
from May 21, 2008
“PDO/ENSO together with similar cyclic oscillations in all the other oceans combine to drive global temperature up or down regardless of the level of CO2 in the atmosphere”
and:
“it is necessary to disentangle the simultaneous overlapping positive and negative effects of solar variation, PDO/ENSO and the other oceanic cycles. Sometimes they work in unison, sometimes they work against each other and until a formula has been developed to work in a majority of situations all our guesses about climate change must come to nought.”
Dear Pierre,
Thank you for your valuable summaries of activities in Germany and elsewhere.
If the expenditure estimates are the ones made by SEPP, the headline is not quite correct. SEPP analyzed three government reports detailing expenditures on climate change from FY 1993 to FY 2013. Using categories as defined in the reports, SEPP concluded that since 1993 total US government expenditures on global warming/climate change are at least $165 billion with over $35 billion identified as climate science. To my knowledge, the SEPP estimates are the only ones available.
Ken Haapala, Exec. VP SEPP
[…] https://notrickszone.com/2014/08/24/a-single-meteorologist-explains-what-165-billion-in-government-fu… […]