Josef Kowatsch and Stefan Kämpfe at the European Institute for Climate and Energy (EIKE) here have been looking at temperatures in Central Europe, foremost Germany, over the past 30 years.

Heavy snow blankets Germany in January, 2018. Photo: Stefan Kämpfe
The German media like to say that Germany has been warming rapidly due to global warming, especially winter. Yet a look at the data tells a different story. Although January, 2018 was a mild one at a mean of 3.8°C, as measured by the German DWD national weather service, the overall January trend is COOLING.
The warm January, 2018, did little to curb Germany’s overall January cooling trend, as data from the DWD show. Kowatsch and Kämpfe have plotted the January data over the past 31 years along with the computed linear trend line:
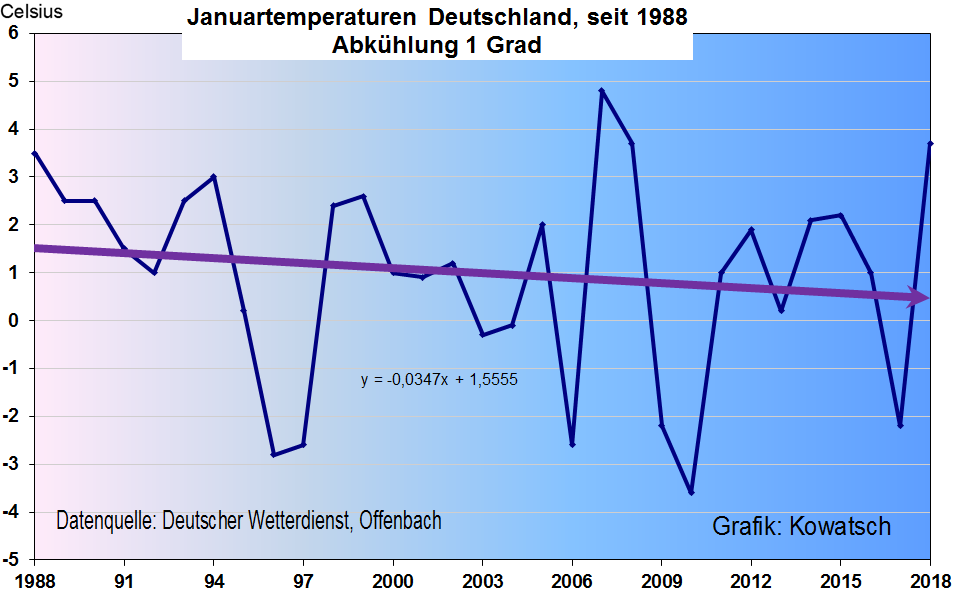
Figure 1: January mean temperatures for Germany have been cooling over the past 31 years. Chart: Josef Kowatsch, based on data from the DWD.
This winter’s mild Central European weather has been attributed to a series of lows that have pumped in mild air from the Atlantic and kept much of Europe out of the ice box. Also heavy precipitation has been associated with the lows, and higher elevations have seen heavy snowfalls as a result — especially in the mountain regions and Alps.
Trend contradicts the CO2
Looking at different locations in Germany, the East German station of Erfurt/Weimar shows the same January cooling trend despite rising CO2 concentrations.
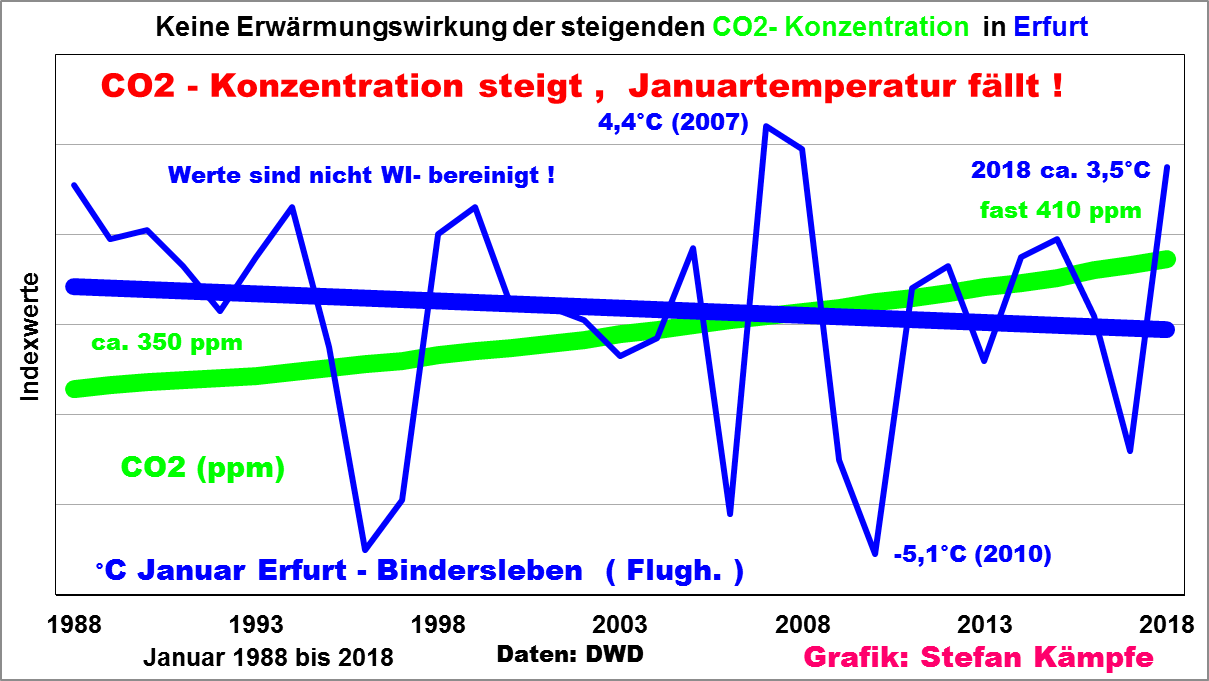
Figure 2: January temperature trend (blue) over the past 31 years in Erfurt (316m elevation) compared to CO2 concentrations (green). Chart: Stefan Kämpfe.
This cooling has been occurring despite urbanization and added waste heat. Currently 100 hectares of building and asphalt are being added daily.
Substantial cooling at the high elevations
Getting away from urban areas, Kowatsch and Kämpfe looked at the mean January temperature atop Germany’s highest peak, the Zugspitze, and at Amtsberg in the East German Erzgebirge near Chemnitz.
The following chart shows the 31 year trend for the Zugspitze, some 2960 m above sea level:
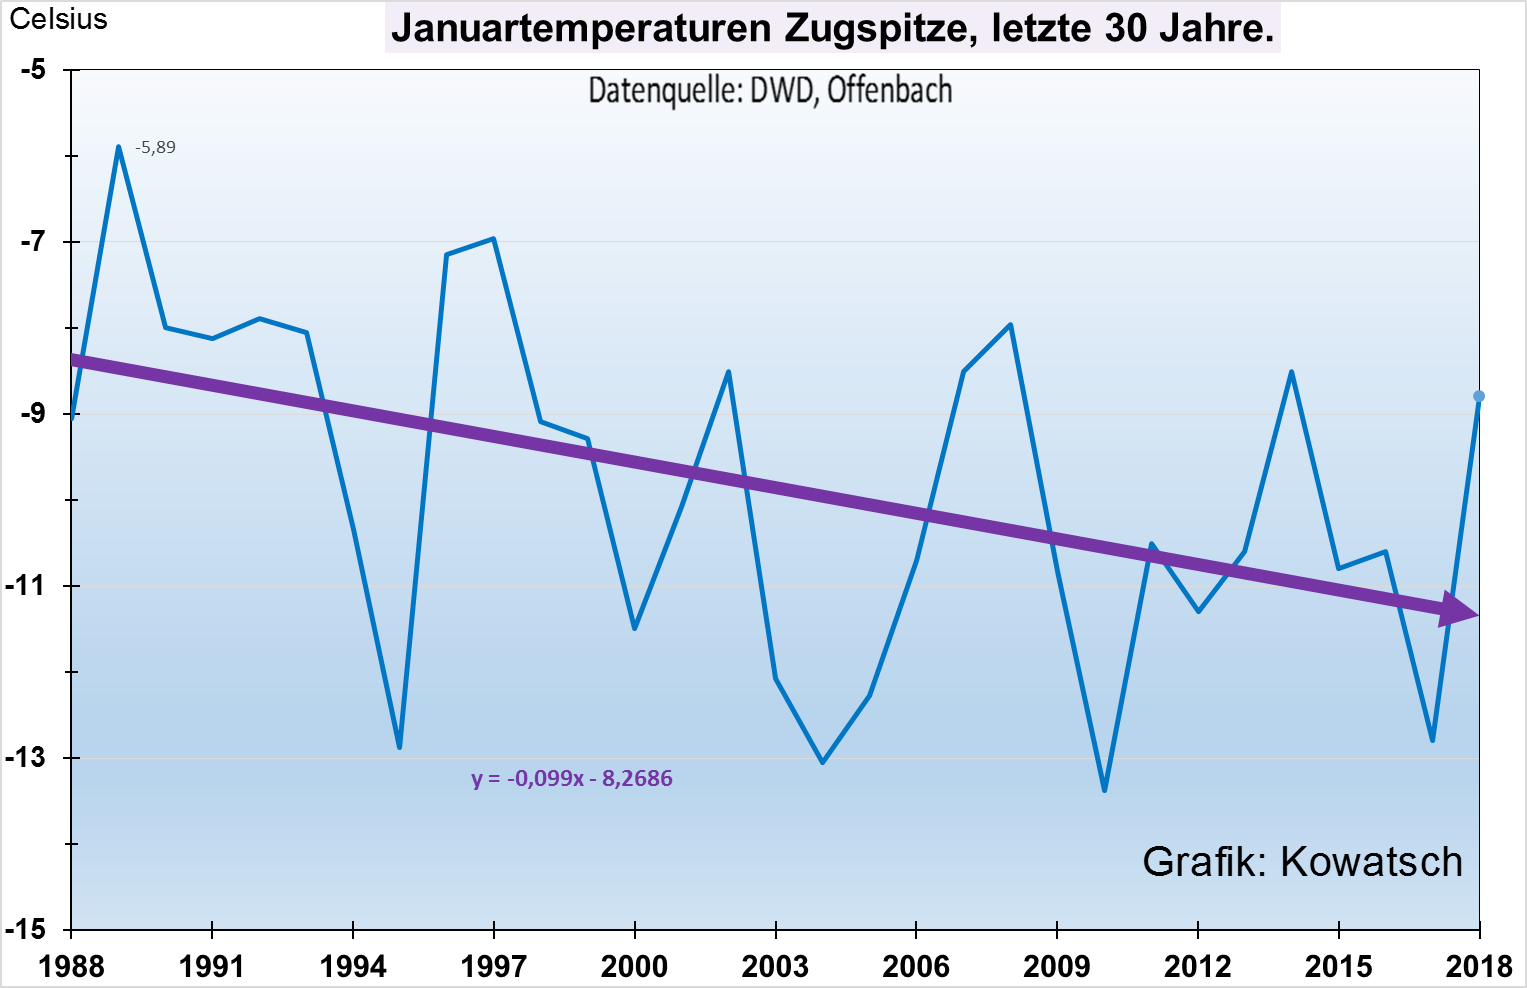
Figure 3: January’s mean temperature on the summit of Germany’s highest mountain, Zugspitze, has trended significantly downward over the 31 years: from -8.3°C in 1988 to over -11°C in 2018 (using the linear trend). That’s about 1°C per decade! Chart source: Josef Kowatsch.
Urban heat island likely skewing the real cooling
Next we look at the station Amtsberg at the foot of the Erzgebirge in East Germany. Here over the past 30 years the mean January temperature has fallen modestly and shows no signs at all of any warming.
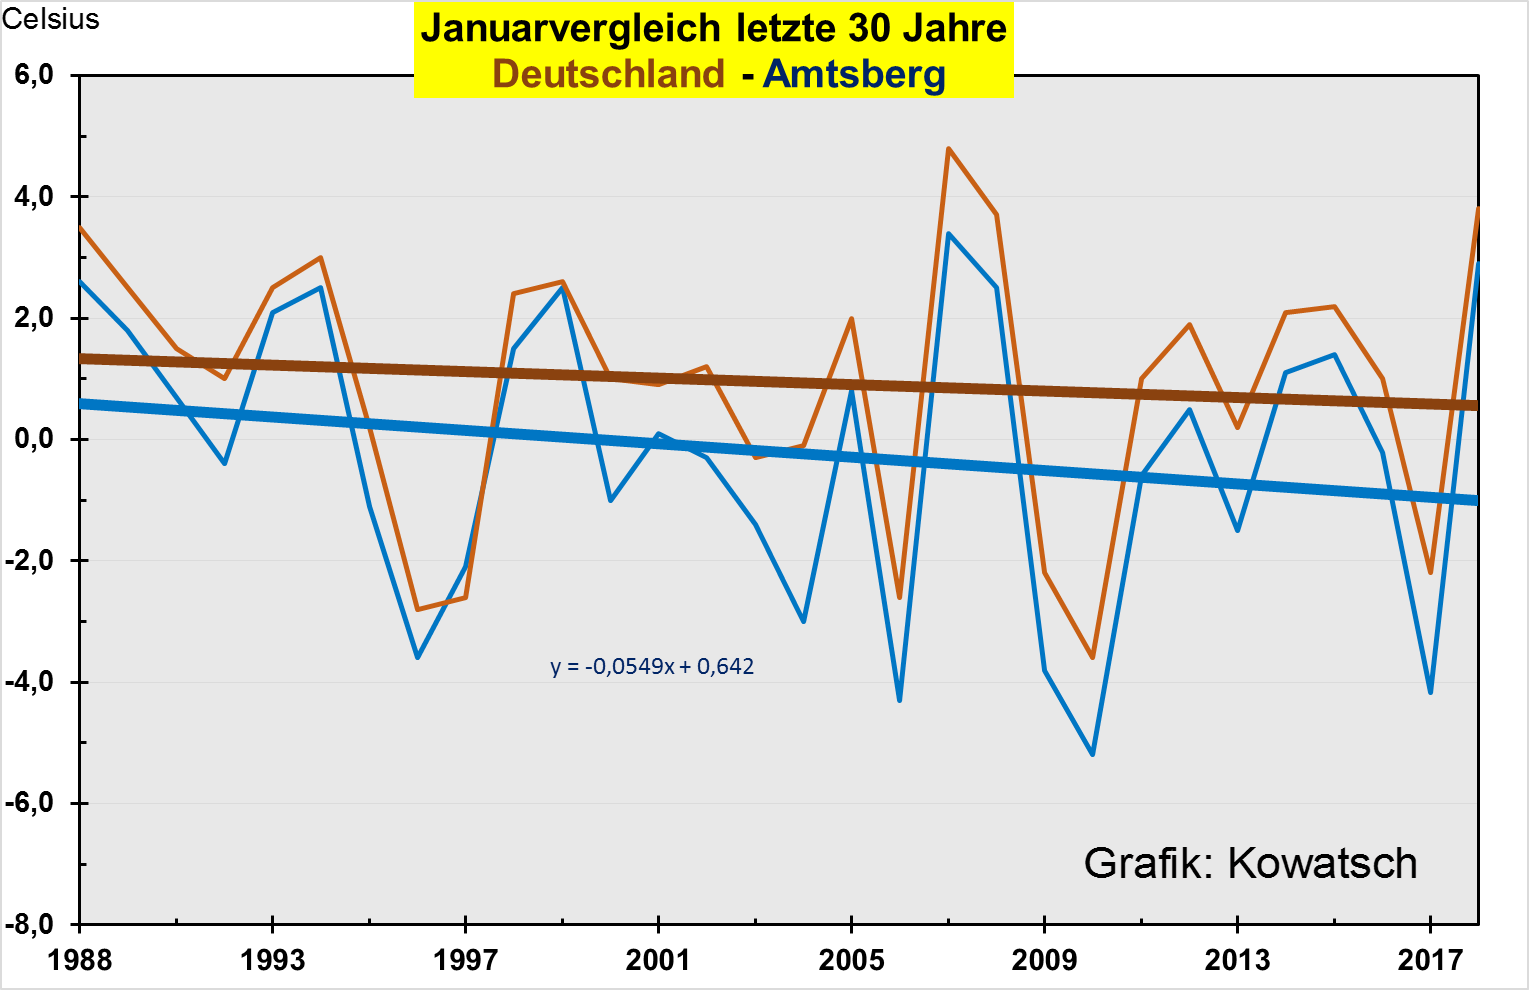
Figure 4: Rural station Amtsberg (blue curve) near Chemnitz is similar to the trend observed across Germany (red curve). Chart source: Josef Kowatsch.
Kowatsch and Kämpfe write that they believe the urban heat island (UHI) effect has not been adequately accounted for in the DWD data, and thus the cooling may actually be even stronger.
So if you’re looking for warming, you won’t find it in Central Europe — despite all the fake climate news you might be hearing.


Uuuuh, we were waiting for that monthly Kowatsch post. Thank you for bringing the sophistication of EIKE to this blog 😉
Yes, look at the data:
– https://www.dwd.de/DWD/klima/national/gebietsmittel/brdras_ttt_01_de.jpg
– https://www.dwd.de/DWD/klima/national/gebietsmittel/brdras_ttt_16_de.jpg
I wonder why the 30-year mean still increases despite all the alleged “cooling” in those graphs, don’t you?
I guess the only Kowatsch worth watching/following is the one in Altered Carbon …
To say that Germany’s mean January temperature is rising is wrong: it hasn’t risen in 30 years (climate definition). If you want to go back further in the past, why not go back to 1500 or the year 1000? You only choose theb data points that suit your fantasy catastrophe and nothing else. No warming in 30 years, period.
The 30-year mean is rising. And since we are nitpicking on accurate descriptions, it is wrong to write that one would not find warming in Central Europe. The second graph (winter) shows a clear warming trend, which is also true for the whole year and summer months. Period!
According to peer-reviewed science, the continent of Europe as a whole is no warmer now than it was when CO2 concentrations were in the 270 ppm range:
Polovodova Asteman et al., 2018
Why do you think that is, SebastianH? Why didn’t CO2 forcing cause more warming?
FACTS and DATA are irrelevant to seb.
His own graph shows a DOMINANT cooling trend since 1915, with a single jump in 1970
https://s19.postimg.org/ii4w5u5sz/brdras_ttt_01_de.jpg
And look at his graph. It is clear that it has nothing to do with CO2.
The greatest increase in temperatures was between 1880 and 1920 when there is about a 6.5degC rise in temperatures but there was no or all but no significant change in CO2.
It is quite clear that CO2 could not have driven that warming. Heck, even the IPCC concedes that CO2 had little impact before 1950, since it was only after 1940 that manmade emissions began to significantly increase.
But as usual, He does not address the point of your article, namely that January temperatures have cooled these past 30 years.
In fact if one looks at the plot, there has been no warming since about 1920, just some ups and downs, but no net overall warming.
Kenneth, great so because it wasn’t CO2 in the past it can’t be CO2 today. What a great argument … *Sigh*
Richard, these aren’t my graphs and we are talking about one month in a rather small country. It’s called global warming and rather than looking at how cold particular months (or sometimes even days in the skeptics camp) are this year, the overall development of the heat content of this planet is the interesting figure we need to look at. Does the heat content decrease when the winter in the NH is particularly cold?
Oh and I didn’t write that is isn’t getting colder in the last 30 years in Germany in January. I wrote the mean is increasing.
As much as you’d like it to be, that isn’t my argument. I’ve told you this isn’t my argument countless times…and yet you (disingenuously) continue to pretend that that’s what I’ve written. Instead of making up your own interpretation, why not just answer the question? Assuming today’s European temperatures can be attributed to CO2 (as you do), why isn’t it any warmer today at 410 ppm than it was at 270 ppm? Where is the warming effect of CO2 manifested, where is the signal, if there’s no difference between today’s European temperatures and pre-industrial temperatures?
Or, this is how the original question reads…
According to peer-reviewed science, the continent of Europe as a whole is no warmer now than it was when CO2 concentrations were in the 270 ppm range:
Polovodova Asteman et al., 2018
Why do you think that is, SebastianH? Why didn’t CO2 forcing cause more warming?
“it can’t be CO2 today. ”
It certainly ISN’T CO2 today.
There is absolutely ZERO EVIDENCE for this mindless anti-science little fantasy,..
Nor is there ANY real physical mechanism whereby CO2 can cause warming.
Never Measured, No Mechanism,
No sign in any real temperature series…
Just a BASELESS NON-SCIENCE CONJECTURE
and you KNOW that, seb
Seb,
The post here refers to the January data from Germany from 1988 to date.
The graph which you posted twice starts in 1880 and clearly demonstrates a positive trend over the past century +. But for the past 30 y, there is no apparent trend.
Poor seb, he DESPERATELY wants to go back to the LIA, the COLDEST period in 10,000 years.
Siberia beckons you, seb.
Wind and solar works so much better up there, seb.
Yo will be able to give up your TOTAL RELIANCE on fossil fuels for heating and travel.
What do you call it when a new value in a time series increases the average of the past x (in this case 30) values?
What do you call it when someone is so WILFULLY BLIND that they REFUSE to see what plain obvious on front of them
In this case a DOMINANT COOLING TREND, with a jump in 1970
I call it WILFUL IGNORANCE, the only thing that seb is capable of.
We are all STILL WAITING for empirical proof that CO2 causes any warming of water or atmosphere , or anything.
seb, you remain, always.. PERPETUALLY EMPTY.
Do you DENY that there is distinct cooling trend from 1915 – 1970 in your first graph, seb
Do you DENY that there is a distinct cooling trend from about 1975 to now, seb
Do you live in a fantasy land of WANTON, DELIBERATE DENIAL…… as all AGW sympathisers do.
Seb’s charts are actually DOMINATED by cooling trends, with a couple of large step changes, especially one in 1970.
If look at about 1915 -1965, you can see the section I am talking about. This COOLING is obviously a sign of increasing CO2. 😉
I’ve added some lines as an illustration.
https://s19.postimg.org/ii4w5u5sz/brdras_ttt_01_de.jpg
Anyone know what caused that step change in 1970?
And here we go again … the “step change” nonsense. This might be a general problem with you, AndyG55. After all you think a one time compression also increases temperature permanently. So why would an El Nino Not be able to do the same thing, right? Or any other phenomenon …
Should I also draw some lines in those graphs? Let’s go wild and completely cover them with lines connecting all data points back and forth. Should be fun 🙂
Wilfully blind seb,
EVERYONE can see the DOMINANT COOLING TREND, with a jump in 1970, seb
https://s19.postimg.org/ii4w5u5sz/brdras_ttt_01_de.jpg
Sorry your brain-washed blinkering does not allow you to se REALITY. !!
Sorry your blocked anti-knowledge does not allow you to accept the basics of actual physics, be it structural or atmospheric.
SO BLIND, so sad, so seb !!
Remain in your PHANTASY, anti-knowledge world seb.
Its pitiful and pathetic, but its all you have.
Don’t like it when sceptics cherry-pick a start date do you, Seb?
But you don’t appear to see a problem when warmists do.
There is a word to describe this kind of behaviour Seb&stianH.
The clue is the last letter of your online name.
I don’t like it when skeptics freely interpret data as to their liking and then declare something which simply isn’t true …
I find it HILARIOUS when AGW sympathisers are WILFULL BLIND to data in front of them.
…. and continually yap mindlessly about things they OBVIOUSY know NOTHING about.
Why? It’s what warmists have raised to an artform.
As the saying goes “what’s goes around comes around”
Suck it up.
So Seb,
From you —
“I don’t like it when skeptics freely interpret data as to their liking and then declare something which simply isn’t true …”
Your contention is there was no cooling trends during the periods indicated on the graphs that AndyG55 submitted. That’s an interesting reinterpretation of what actually happened seb, so you’ve not only got a fantasy about the future, your totally misguided about the past.
Ho-hum, you apparently live in a strange place similar but not the same as others.
Nah, what AndyG55 does is playing “color by numbers” or something like that. But you reply is interesting too. It’s exactly what you quoted … Free interpretation and then coming to the wrong conclusion. What actually happened is a blog author wrote something about January in Germany and concluded it isn’t warming in Europe. Do you think that is a correct conclusion?
Another EMPTY fantasy seb post,
Seb’s AGW cataracts refuse to let him see what EVERYONE ELSE can see…. that being the DOMINANT COOLING TREND since 1915. (with a jump in 1970)
Blinkered DENIAL, the only thing seb has left to yap with.
So it is your contention that there is no cooling during those periods indicated on the graphs that AndyG55 submitted.
Sorry but why all of the angst by meteorologist, scientists, and government official back in the 1970 over the perceived plunge into a new ice-age. Even Leonard Nimoy (Mr. Spock from StarTrek) and Steven Schneider explained The Coming Ice Age at the time.
1970’s cooling was real and caused great consternation at the time, moving some governments to take some action.
Your interpretation of the past temperature record is incorrect.
“and higher elevations have seen heavy snowfalls as a result — especially in the mountain regions and Alps.”
All that snow feeding those vanishing glaciers.
Yes, isn’t it very odd how the earlier part of Seb’s charts show a nic warming Trend, but the last 30 years, when the CO2 has been at it’s highest the Temperatures have been COOLING.
So More CO2 = more Cooling.
Yep, That is the obvious conclusion from the graphs.
If you look at the graph here, you can see that there was a distinct jump in 1970, (why?) but apart from that, there has been a cooling trend since about 1915 while world aCO2 has increased to almost biosphere sustainable levels.
Bit of a worry just how COLD it will get in Germany as the CO2 increase to a plant luvin’ 700ppm !!
Certain people will relish that cold, so long as they have fossil fuel derived heating available.
forgot the pic link
https://s19.postimg.org/ii4w5u5sz/brdras_ttt_01_de.jpg
Wow, you disproved AGW, congratulations! Now explain why you thing German climate in January is exemplary for the whole globe! I am looking forward to your reply.
*think
Here’s a comment you wrote about “anartic” sea ice being at a “record low” for a few months during 2016-’17, and that these few months are indicative of climate change:
https://notrickszone.com/2017/03/27/20-scientists-no-continent-scale-warming-of-antarctic-temperature-is-evident-in-the-last-century/#comment-1192726
Can you explain why a few months in Antarctica overturn the entire 39-year trend of increasing sea ice and represent the globe? In other words, will you acknowledge that you are here doing exactly as you are accusing A C Osborn of doing?
… [Trackback]
[…] Read More Infos here: notrickszone.com/2018/02/09/europe-cooling-weather-service-data-show-falling-january-mean-temperatures-over-past-30-years/ […]