A Deconstruction Of The
PAGES 2k ‘Hockey Stick’
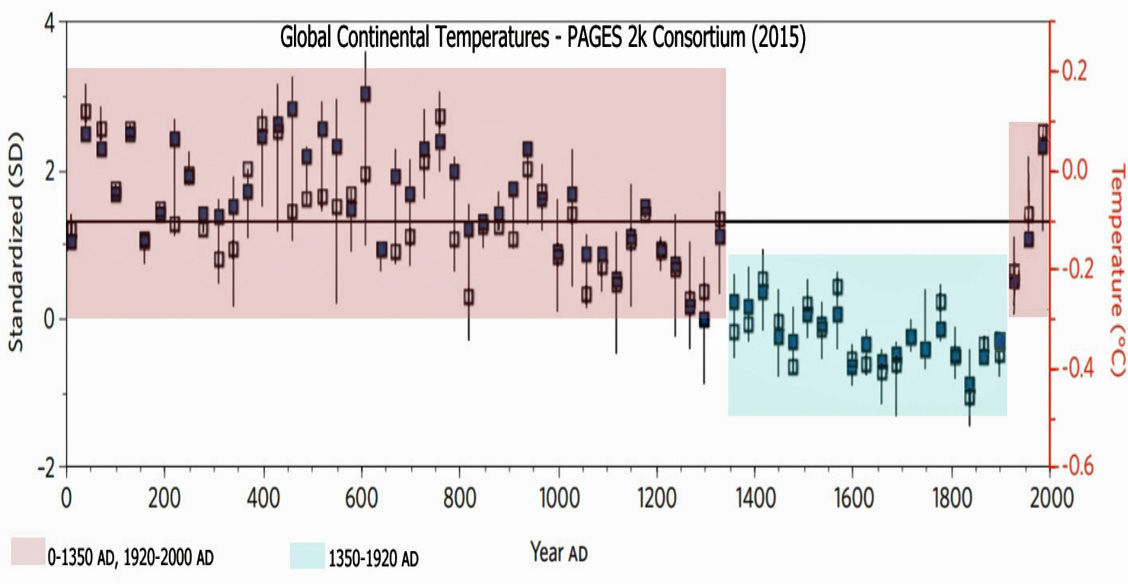
Image adapted from PAGES 2k, 2015
Five years ago, the release of the PAGES 2k Consortium (2013) “global” temperature data set was accompanied by a great deal of fanfare.
Advocates deemed the conglomeration of proxy temperature data from 7 land regions as scientific confirmation of the notorious hockey-stick-shaped temperature reconstruction popularized by Michael Mann and the Intergovernmental Panel on Climate Change (IPCC, TAR) in the early 2000s.
The New York Times featured interviews with the lead authors of the study upon its release. While emphasizing the exceptionality of modern warmth, the authors acknowledged that “temperatures in some regions were higher in the past then they were during the late 20th century.”
“In Europe, slightly higher reconstructed temperatures were registered in A.D. 741–770, and the interval from A.D. 21–80 was substantially warmer than 1971–2000.”
“Antarctica was probably warmer than 1971–2000 for a time period as recent as A.D. 1671–1700, and the entire period from 141–1250 was warmer than 1971–2000.”
After corrections to “several errors” (more on this below) in the Arctic reconstruction, the 1971-2000 decades were only deemed the third warmest in the record, with the 3 decades around 400 AD the warmest.
“Following these corrections, the period from 1941–1970 emerges as the second warmest 30-year period in the Arctic record, and 1971–2000 the third warmest, rather than the first and second warmest as reported in the original version. The ranked order of the best estimate of temperature indicates that the warmest 30-year period is centred on AD 395” (PAGES 2k, 2015).
When viewing the supplemental data and comparing the PAGES 2k reconstructions to other Basic Composites, there doesn’t seem to be a lot of unusual or exceptional characteristics about the 20th century’s temperatures relative to the beginning of the 2nd millennium and earlier (for the few records that extend back that far).
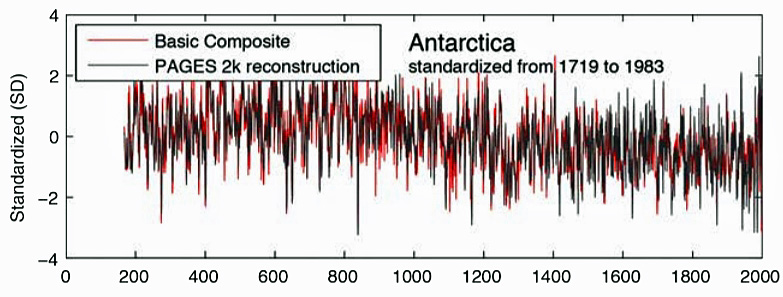
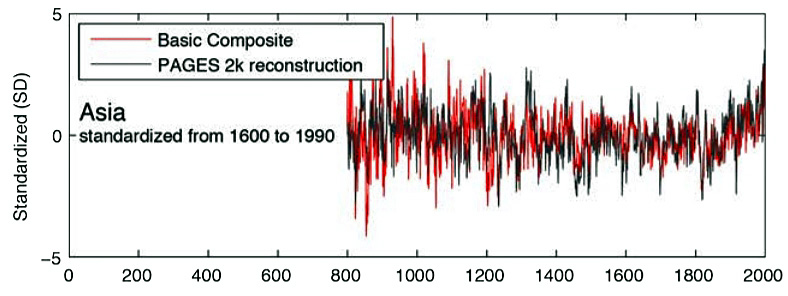
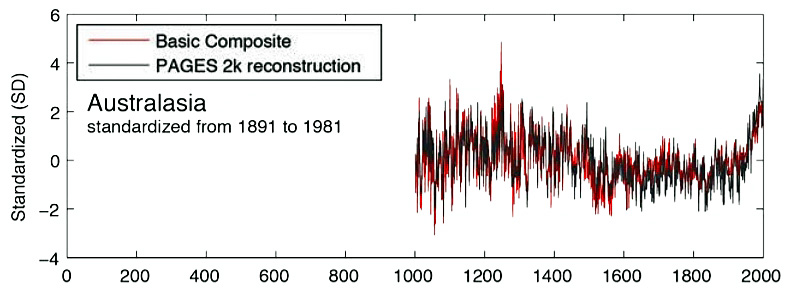
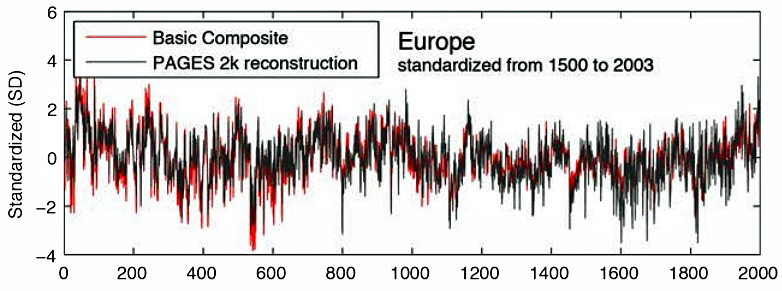
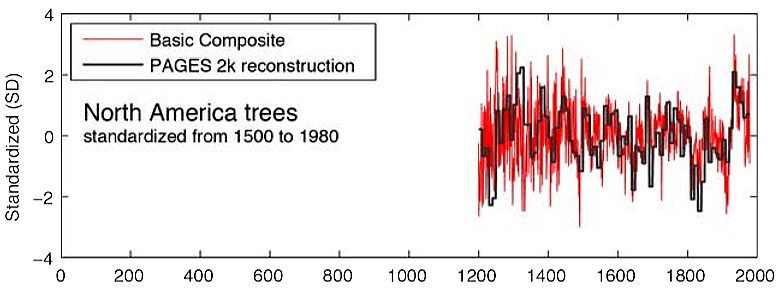
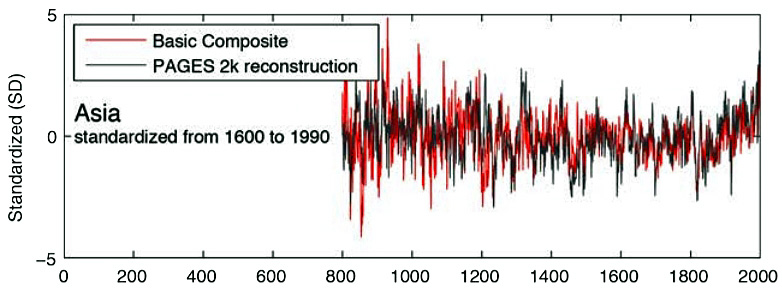
Images: PAGES 2k Consortium, Supplementary
Is This Really A Global, 2,000-Year Reconstruction?
The PAGES 2k temperature reconstruction utilizes proxy data from 7 land regions, but excludes the entire continent of Africa. (Oceans, covering 71% of the Earth’s surface, are also excluded from this “global” record.)
Despite being hailed as a global-scale, 2,000-year reconstruction, just 2 of the 7 regions, the Arctic and Europe, analyzed temperatures from the entire 0 AD to 2000 period.
Antarctica was represented beginning in 167 AD. Asia begins in 800 AD. South America begins in 857 AD. North America proxy data begins in 1204 AD and ends in 1974 (tree rings) and 480 to 1950 (pollen). Australasia begins in 1001 AD.
Steve McIntyre Spots ‘Several Errors’ Corrupting Arctic 2k; Some Are Corrected In 2014
Steve McIntyre, known for his evisceration of the questionable data-collection processes in the construction of “hockey stick” graphs, identified several suspicious “errors” corrupting the Arctic data set. He wrote about them on his blog.
“Kaufman’s proxies are fraught with defects. Kaufman has already acknowledged that one of his supersticks (Igaliku) was contaminated by modern agriculture; and that another non-H13 series (Hvitarvatn) was used upside down.
“Several series, thought to be temperature proxies as recently as 2013, were removed in August [2014] as no longer ‘temperature proxies’. For inexplicable reasons, Kaufman failed to remove all the contamination from the Igaliku series and his inversion of the Hvitarvatn points to major inconsistencies with other series.”
The PAGES 2k authors reported that these “several errors” were “discovered” following publication. A list of 5 of these errors were mentioned in a “correction” paper.
“Here we present an Arctic regional temperature reconstruction that revises the one published recently by the PAGES 2k Consortium. The revisions include updating records using more recent published studies from three sites, and correcting several errors discovered following publication of the PAGES 2k Consortium article. … 1. Three records were removed because of insufficient evidence that they are sensitive to temperature. 2. Sections of five records that were interpreted by the authors to violate criterion 5 were removed. 3. The interpreted temperature relation of the series from Hvítárvatn was corrected from positive to negative [warming to cooling]. 4. A 50-year offset in the ages of the record from Lone Spruce Pond was corrected. 5. The coordinates of the Copper River tree-ring reconstruction were corrected” (McKay and Kaufman, 2014).
Curiously, the corrupt and error-ridden data contributing to Arctic 2k dataset seemed to go in one direction and one direction only: they cooled the past and warmed the present.
The odds of a large series of unforced mistakes consistently occurring with one sign (cooling) for one period (the 1st millennium) and the opposite sign (warming) for another period (the 20th century) are extremely low. And yet it happened.
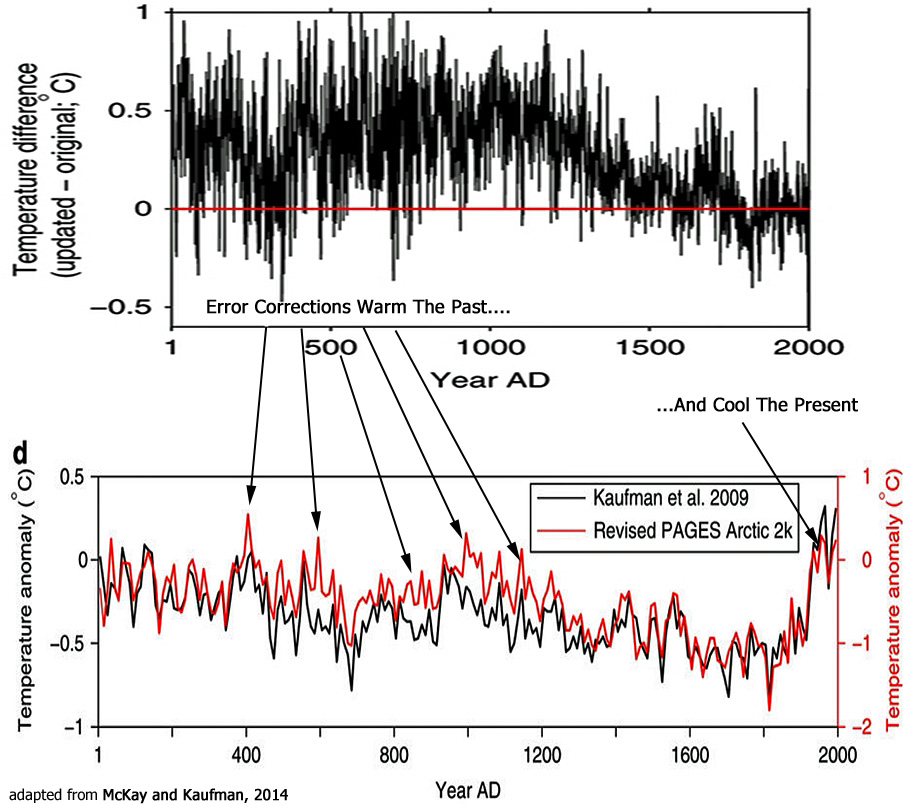
Image adapted from McKay and Kaufman, 2014
After corrections to the originally erroneous and corrupted PAGES 2K reconstruction, much of the entire 0-1,000 AD period turned out to be just as warm (if not warmer in some decades) as the 20th century. Here’s what the corrected (red) Arctic reconstruction looked like as of 2014, with the corrupted (black) data removed.
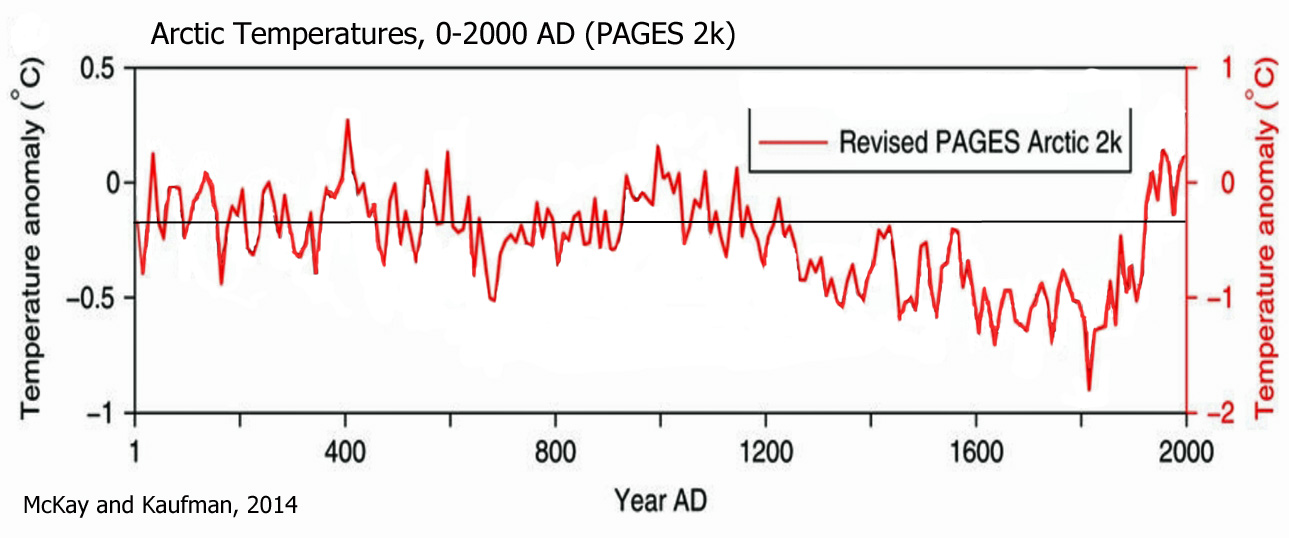
Notice that all or nearly all the Arctic warming occurred from the late 1800s to the 1940s, with no net change (even cooling) from the 1940s through 2000. This is consistent with the instrumental record (Hanhijarvi et al., 2013; HadCRUT4 via Climate4You).
A Corrigendum Is Published, But 2 ½ Years Later
It took until late 2015 for the PAGES 2k authors to finally issue a corrigendum to their error-riddled “global” reconstruction graph released in 2013. Dr. Steve McIntyre was acknowledged for “discovering” their “several errors”.

The blogosphere that favors hockey-stick-shaped graphs uniformly ignored the corrected depiction of “global” temperatures in the corrigendum, preferring the erroneous 2013 graph that shows more warming in recent decades and less warming during the 1st millennium.
As before, the obligatory “hockey stick” blade was tendentiously inserted at the end of the record to make the 20th century appear exceptional.
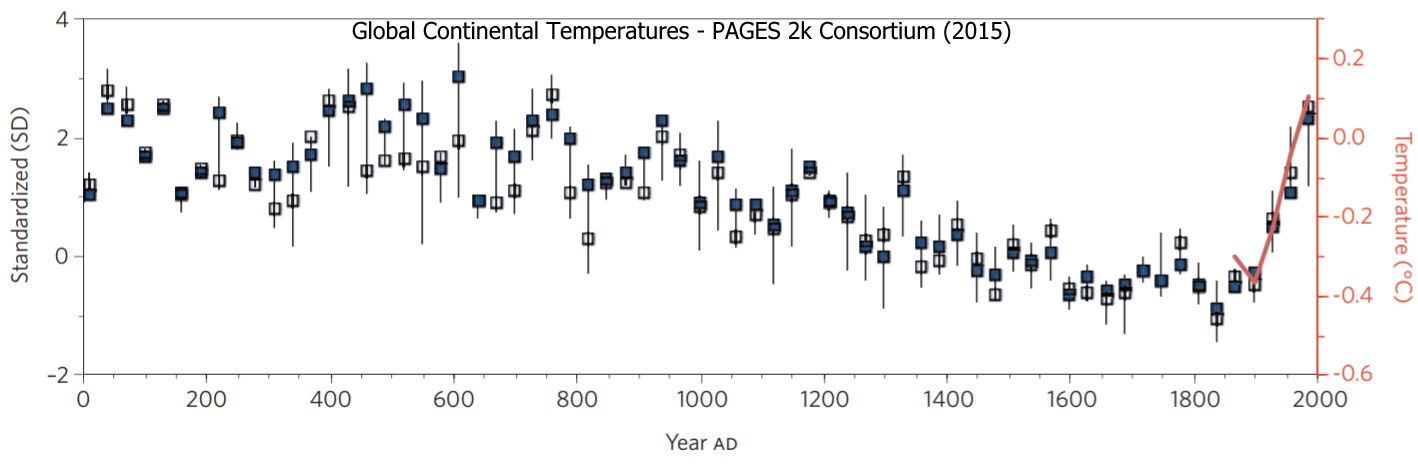
Image: PAGES 2k, 2015
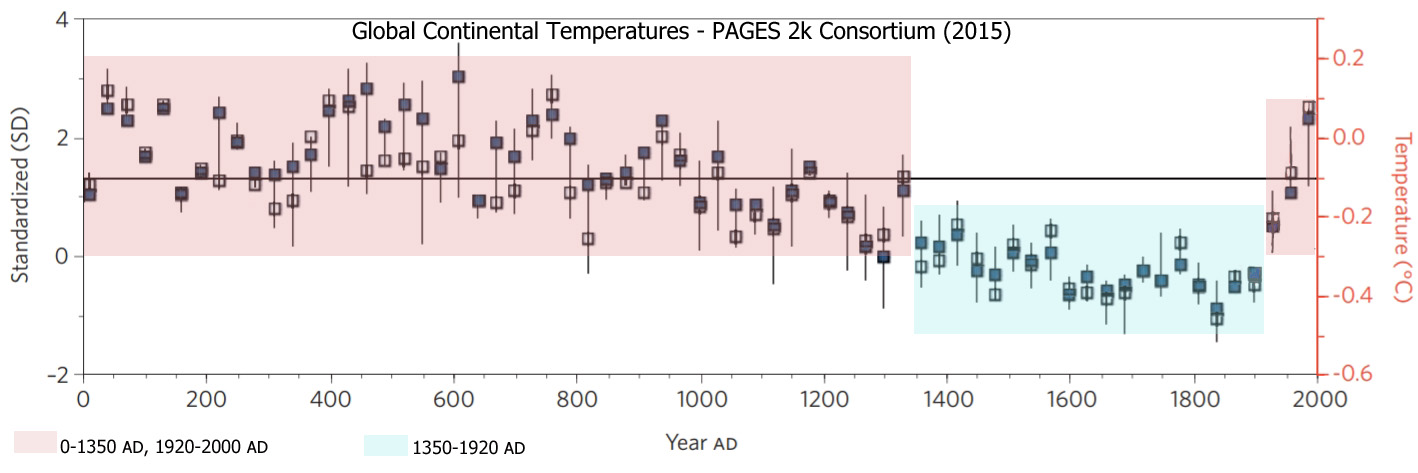
Visual Paradigm Shift: The Cooling Is Anomalous – Modern Warmth A Return To Normal
As suggested, the reason why the “hockey stick” blade was added to the partially corrected “global” PAGES 2k record was to visually persuade readers that the modern period is anomalous and unusual.
But if we look at the presented data from all 7 regions in PAGES 2k from another angle, a distinct pattern emerges that identifies the modern temperatures as the norm, and the mid-1300s to early 1900s cooling period as the exception. The 20th century warmth is merely a return to the normal temperatures that characterized most of the Late Holocene.
Image adapted from PAGES 2k, 2015
The anomalously cool years can be viewed even more conspicuously when adding simulated temperatures to the post-2000 record.
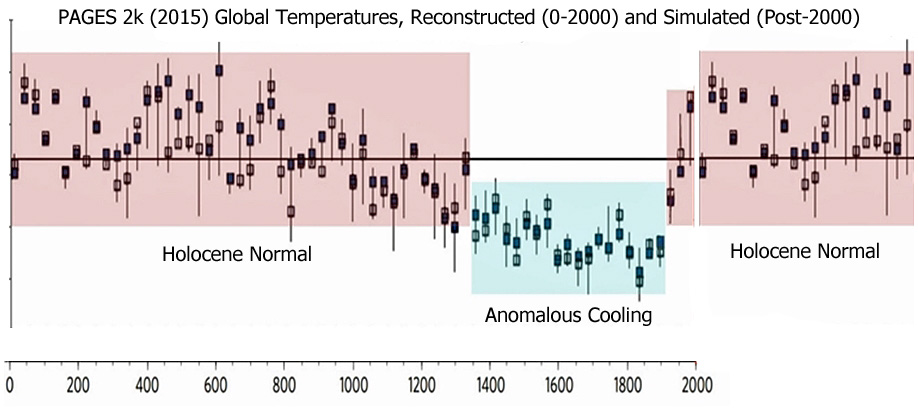
This same pattern can be identified in the regional reconstructions as well. The Arctic’s 1880s to 1940s abrupt warming trend (and subsequent non-warming) reached amplitudes compatible with past Holocene periods.
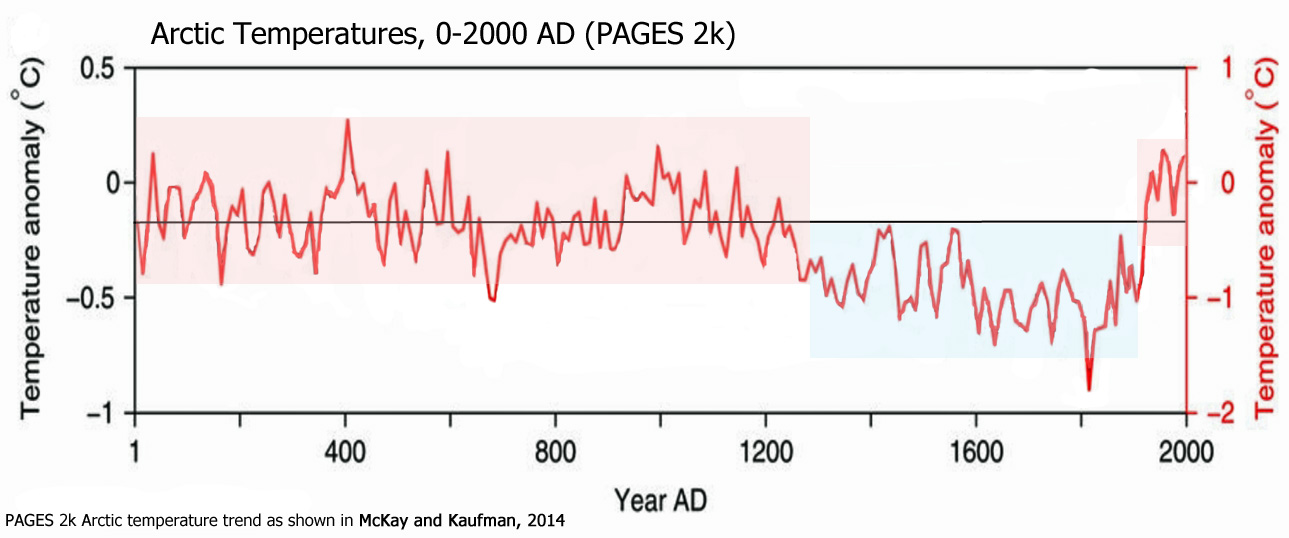
In sum, nothing climatically unusual has happened in the last 150 years relative to the last two millennia.
The Late Holocene’s normal temperatures have (fortunately) returned.


No fool like an April fool.
https://climateaudit.org/2009/04/12/ammanns-april-fools-joke-part-2/
Hockey Stick has been garbage for a while now. But maybe if it can hang on long enough, it will morph into something beautiful? Yeah, no.
Great Article, K ! 🙂
The REALITY of the “Modern Slightly Warm Period” brought to front stage.
And let’s not forget that the MWP was actually COOLER than either of the previous pleasantly warm periods.
Basically toward the end of the “neoglaciation” period, just before the LIA.
Again, I ask the question
What SHOULD the world temperature be?
Should it be down in the cold depths of the LIA when famine and plague was rife?
Or should it be warmer than now, as during the RWP and MWP?
Personally, all the science I have seen says that we could do with a bit more warming than the current MSWP, …
…and CERTAINLY the world could use further enhancement of the atmospheric CO2 level. Its been at plant subsistence level for way too long !
This tiny bump in aCO2 has been a blessing to ALL LIFE ON EARTH.
And I like to think humans have had some small part in it.
Global mean temp is about 15°C, up from about 14°C 100 years ago. Already 17°C can lead to hypothermia, and so we have quite a ways to go before the planet reaches a comfortable temperature. Little wonder most people live between 45°N and 45°S.
“Little wonder most people live between 45°N and 45°S.”
Certainly true for the SH.
Pockets of high population in Europe above 45°N, but mostly in countries that have modern energy technology for heating in winter or are warmed somewhat by the oceans.
Make it 60°N – 45°S and you probably cover at least 97% of the world’s population.
Strange that the areas outside that aren’t heavily populated by climate worriers avoiding the warmth. 😉
“What SHOILD the [avg] world temperature be?”
By now we’re all familiar with this data plot..
http://www.geocraft.com/WVFossils/PageMill_Images/image277.gif
According to it, the highest temp ever reached on earth (with a couple of possible brief exceptions) is 25 Deg C (some say 22). And, whichever it was, that has been the most prevalent condition on earth for its entire history.
I’m guessing that a return to that will, despite requiring some coping issues in some locations, be on balance a good thing.
You can easily do a back of the envelope calculation of sea level rise caused just by the thermal expansion.
“coping issues in some locations” …
Life is comfortable in a very narrow temperature band. +5 K and the coastal regions are all underwater, -5K and they are mostly covered with ice (at least European and North American cities). So a change by less than 2% in either direction will come with a little bit more than “coping issues in some locations”.
Considering the globe’s sea levels were about 2 or 3 meters higher than now about 5,000 years ago, how much warmer were ocean temperatures back then if using the IPCC equation that says there is 0.4 m of sea level rise for every 1 degree C of warming?
IPCC AR5: “The amount of ocean thermal expansion increases with global warming (0.2 to 0.6 m/°C–1)”
Aren’t we talking about 5-10 degrees C warmer than now back then? Or did thermal expansion not work the same way back then as it does today?
Ocean expansion due to heating…
I don’t have to do the math myself, when an expert has already done it. All I have to do is check to see if it makes sense. And it does.
http://www.wiseenergy.org/Energy/SLR/Morner_Paper_604.pdf
More useful facts and illustrations here.
https://www.eike-klima-energie.eu/wp-content/uploads/2016/12/MoernerCopenhag_01.pdf
Michael Mann – sloppy AND arrogant?
http://rogerpielkejr.blogspot.com/2009/10/point-resolved-in-hockey-stick-wars.html?m=1
And they wonder why we don’t trust them!
“In sum, nothing climatically unusual has happened in the last 150 years relative to the last two millennia.
The Late Holocene’s normal temperatures have (fortunately) returned.”
Not really. The PAGES 2K data is organised into 30 year bins, so the last data point represents the 30 years ending 2000. Since the midpoint of that period, global temperatures have increased by c0.6C.The data is expressed as an anomaly from a 1961–1990 reference baseline, the same as HADCRUT4. Eyeballing the graph, the maximum is around +0.15C and minimum around -0.45C. HADCRUT4 reached +1.1C in 2016 and the mean of the last 12 months was +0.68C.
So PAGES2k found global temperatures varied in a range covering about 0.6C, and we are now about 0.5C above the max of that range. ‘Nothing climatically unusual’?
Not really.
“The Late Holocene’s normal temperatures have (fortunately) returned.”…..Not really.”
Nope, we are still quite a bit below the MWP and RWP.
“HADCRUT4 reached +1.1C in 2016 “
ROFLMAO
Are you SERIOUSLY using the top of a 3 year El Nino spike.??
And in highly dubious AGW agenda driven data???
DUMB !!
UAH for February 2018 is 0.2C NOTHING UNUSUAL
Are you NH or SH, Phlop?
Bet you choose somewhere warmer to live, not Iceland or Siberia.. right 🙂
Plenty of fossil fuel derived heating in winter as well?
UAH is virtually identical to Hadruct4:
http://www.woodfortrees.org/plot/uah6/plot/hadcrut4gl/from:1979/offset:-0.305
The difference is a few more pronounced extremes. Despite not measuring the temperature in the same height, they match up pretty well.
His critique on Kenneth “nothing unusual to see here” is valid. I don’t get that either since viewing even the corrected graph makes a highly unusual increase of temperature very visible. You can claim that in those proxy records past temperatures can be found that were warmer as late 20th century temperatures, but it sure looks like a hockey stick to me.
The “nothing unusual to see here” is a valid characterization when we’re talking about a 30-some year period (like the graph you’re using) relative to a long-term context (a few thousand years).
I mean, we’re talking about a 0.1ºC oceanic temperature change in the last 50 years. That‘s unusual?
http://www.sciencenewsline.com/news/2018010404130083.html
“‘Our precision is about 0.2 ºC (0.4 ºF) now, and the warming of the past 50 years is only about 0.1 ºC,’ he said, adding that advanced equipment can provide more precise measurements, allowing scientists to use this technique to track the current warming trend in the world’s oceans.”
The oceans are still 0.65ºC cooler than the Medieval Warm Period (Rosenthal et al., 2013), and you think a tenth of one degree change in 50 years is noteworthy?
Does this tiny little uptick through 2010 (if you can call it that) look like something unusual in the ocean heat record for the Pacific Ocean?
https://notrickszone.com/wp-content/uploads/2016/09/Holocene-Cooling-Pacific-Heat-Content-Rosenthal13-copy.jpg
Rosenthal et al., 2013
“We show that water masses linked to North Pacific and Antarctic intermediate waters were warmer by 2.1°C and 1.5°C, respectively, during the middle Holocene Thermal Maximum than over the past century. Both water masses were ~0.9°C warmer during the Medieval Warm period than during the Little Ice Age and ~0.65° warmer than in recent decades.”
————————-
https://notrickszone.com/wp-content/uploads/2017/11/Arctic-Sea-Ice-Extent-North-of-Iceland-3000-Years-Moffa-S%C3%A1nchez-and-Hall-2017.jpg
SebastianH, in this graph of Arctic sea ice extent for the Holocene (above), there is one particular period that stands out above all the others. It’s the time where the ice extent was anomalously high, the highest in the last several thousand years. Do you think it’s appropriate to just ignore that and instead focus on the decline during the 20th century…that has partly brought us back to “normal”? The Little Ice Age is the anomaly — just as in the PAGES 2k reconstruction. It’s modern temperatures that are normal (well, we’re not quite warm enough yet).
“The oceans are still 0.65ºC cooler than the Medieval Warm Period (Rosenthal et al., 2013), and you think a tenth of one degree change in 50 years is noteworthy?”
“It is clear that much of the heat that humans have put into the atmosphere through greenhouse gas emissions will be absorbed by the ocean. But the absorption time takes hundreds of years, much longer than the current rate of warming and the planet will keep warming. Our study puts the modern observations into a long-term context. Our reconstruction of Pacific Ocean temperatures suggests that in the last 10,000 years, the Pacific mid-depths have generally been cooling by about 2 degrees centigrade until a minimum about 300 years during the period known as the Little Ice Age.
After that, mid-depth temperatures started warming but at a very slow rate. Then, since about 1950, temperatures from just below the sea surface to ~1000 meter, increased by 0.18 degrees C. This seemingly small increase occurred an order of magnitude faster than suggested by the gradual change during the last 10,000 years thereby providing another indication for global warming. But our results also show the temperature of the ocean interior is still much colder than at any time in the past 10,000 years thus, lagging the changes we see at the ocean surface.”
-Yair Rosenthal
From
Then there’s this
https://www.nodc.noaa.gov/OC5/3M_HEAT_CONTENT/
You’ve fallen for the statistical trick just like all the others do. It’s like clockwork.
So how did Rosenthal et al. leap to their conclusion that today’s changes are “an order of magnitude faster” than past changes? By oddly deciding that it is scientifically defensible to directly compare an overall 8,000-year-long trend to a 55-year trend (1955-2010) — which, statistically, is much like comparing an 8-month-long El Niño-dominated temperature anomaly to a 37-year-long temperature trend. (For example, it cooled by -0.5 C between March 2016 and March 2017 — that means that it’s cooling at a rate of -5.0 C per decade now — that’s a faster rate of change than any other time in the last 200 years! Do you find that defensible?) In other words, Rosenthal and co-authors were able to claim an unprecedented modern warming rate by cherry-picking an extremely short-term period (1950s-present) and by simultaneously ignoring all the other short term (<100 years) trends from their own reconstructions that greatly exceeded modern temperature changes in both rapidity and magnitude (as this graph illustrates), and then they compared this short-term change to the overall, 8,000-year trend to claim that today’s changes are 10 times faster than ever. And you fell for it.
Interestingly, Bova et al. (2016) found that during the Holocene there were short-term “natural” ocean warming trends that achieved amplitudes of more than “2.0°C within 200 years” at the 0-1000 m depth, which is about 5 to 10 times the rate of warming (more than 0.1°C per decade) compared to the 0.015°C per decade warming rate in recent decades (1971-2010) at the shallower 0-700 m depth.
Here’s what the 0.18 change in the 0-700 m layer since 1955 looks like:
https://climateaudit.files.wordpress.com/2013/11/two_millennia_annotated.png
Here’s what it looks like from an even larger context (notice especially the extreme close up on the right):
https://climateaudit.files.wordpress.com/2013/11/rosenthal-2013-figure-2c-annotated.png
And you were saying that today’s changes are unusual why?
yes
If you say so … we apparently can’t measure ocean warming trend with a better than 0.2°C precision, but at the same time it’s possible to say how much warmer the ocean was hundreds of years ago to 0.01°C precision. Only a skeptic can come up with this in one comment post and don’t recognize the weirdness …
It’s not a graph of the Arctic sea ice extent. Re-read the paper you lifted that from (where it appears flipped in y-axis):
https://www.nature.com/articles/s41467-017-01884-8
Or just read the paper where the data is really coming from:
https://www.sciencedirect.com/science/article/pii/S0277379116302128?via%3Dihub
It’s the drift ice north of Iceland. And now look at where Arctic sea ice is actually located: http://ocean.dmi.dk/arctic/icethickness/thk.uk.php
Do you think it is appropriate to just make up something like you do whether it was intentional or not?
Well, at least you somewhat recognize that the modern warming hasn’t ended yet. We are just at the beginning …
The oceans are still 0.65ºC cooler than the Medieval Warm Period (Rosenthal et al., 2013),
I didn’t say so. Rosenthal et al. (2013) said so.
http://science.sciencemag.org/content/342/6158/617
“We show that water masses linked to North Pacific and Antarctic intermediate waters were warmer by 2.1 ± 0.4°C and 1.5 ± 0.4°C, respectively, during the middle Holocene Thermal Maximum than over the past century. Both water masses were ~0.9°C warmer during the Medieval Warm period than during the Little Ice Age and ~0.65° warmer than in recent decades.”
Here’s what that looks like: https://climateaudit.files.wordpress.com/2013/11/two_millennia_annotated.png
The drift ice north of Iceland is in the Arctic circle. Here’s another rendition of the same trend. Is there a period that stands out, or sticks up, here?
https://notrickszone.com/wp-content/uploads/2018/01/Holocene-Arctic-Sea-Ice-Iceland-North-Perner-2018.jpg
Is there anything that stands out to you about Iceland’s sea ice on this graph? Is there a period that looks unusual, or hockey-stick-like?
https://notrickszone.com/wp-content/uploads/2016/11/Arctic-Sea-Ice-Iceland-Since-MWP-1975-copy.jpg
Anything unusual here?
https://notrickszone.com/wp-content/uploads/2018/03/Holocene-Arctic-Sea-Ice-North-Iceland-Ran-2010.jpg
Yikes! It looks like something unusual did happen to sea ice on West Greenland here (more sea ice in modern times)…
https://notrickszone.com/wp-content/uploads/2017/06/Holocene-Cooling-Greenland-SW-Kryk-2017.jpg
Apparently sea ice in the Beaufort sea was less extensive 100 years ago than modern. Is that unusual?
https://notrickszone.com/wp-content/uploads/2018/03/Holocene-Arctic-Sea-Ice-Beaufort-Sea-Durantou-2012.jpg
“For the period ∼ AD 1887–1945, reconstructed sea ice cover values are on average 8.3 months per year which is 1.1 months per year lower than the modern values.”
How about sea ice in the Canadian Arctic? Does the sea ice extent look unusual for the 20th century?
https://notrickszone.com/wp-content/uploads/2018/03/Holocene-Canadian-Arctic-Sea-Ice-Mudie-2005.jpg
Anything unusual happening to modern sea ice in the Arctic’s Chukchi Sea?
https://notrickszone.com/wp-content/uploads/2017/11/Holocene-Arctic-Sea-Ice-Chukchi-Sea-Yamamoto-2017.jpg
Anything unusual happening to Greenland’s ice sheet surface area in recent decades?
https://notrickszone.com/wp-content/uploads/2016/12/Holocene-Cooling-Greenland-Ice-Sheet-Briner-16-copy.jpg
Again, we’re looking for something unusual about modern times. It appears that the most unusual thing about the last few thousand years is just how anomalously cold (and how much ice advanced) during the Little Ice Age period. Fortunately, we’ve come out of that a bit…but we still have a ways to go.
“Re-read the paper you lifted that from ”
ROFLMAO
poor seb get fooled by a flipped axis.
How embarrassing for him.
Several graphs from around the ARctic showing exactly the same thing,
Arctic sea ice is basically just a tiny bit down from its HIGHEST EXTENT IN 10,000 years.
Let that IGNORANCE flow out of yo se, it HILARIOUS. !!
https://s19.postimg.org/a2p8qx7oz/Arctic-_Sea-_Ice-_Changes-_Chukchi-_Sea-_Yamamoto-2017.jpg
https://s19.postimg.org/v6om69bj7/Arctic-_Sea-_Ice-_Extent-_North-of-_Iceland-3000-_Years-_Moffa-_S_nchez-.jpg
https://s19.postimg.org/vgdnb299v/Arctic-_Sea-_Ice-_Holocene-_Stein-17.jpg
https://s19.postimg.org/bkgbf2prn/Icelandic_sea_ice_index_2.png
You really are rabid on your CLIMATE CHANGE DENIAL aren’t you seb.
“Well, at least you somewhat recognize that the modern warming hasn’t ended yet.”
And at least you have ADMITTED that the slight warming we have had has been a TOTALLY NATURAL RECOVERY from the COLDEST period in 10,000 years.
Well done. A tiny step towards REALITY
(we now await as you fall backwards on your arse as comic relief from the usual faceplant)
As you well know, there is ZERO evidence that enhanced atmospheric CO2 causes anything except enhanced plant growth.
“Do you think it is appropriate to just make up something”
roflmao..
seb is claiming a demarcation dispute.
A climate change caused by human emissions isn’t unusual enough? Nope, the temperature needs to rise higher than at some point in time in the past first before Kenneth is satisfied that it’s unusual …
Well, just wait a few decades then and hope that mankind does nothing to cope with the problem. What will you then do to justify your denial which you call “skepticism”?
Haine, 2016
“The anthropogenic melt from the Greenland ice sheet is still too small to be detected. … [N]o clear change in the delivery of Arctic freshwater to the North Atlantic due to human climate forcing.”
Hansen et al., 2016
“[W]e found that there is (yet) no observable sea-level effect of anthropogenic global warming in the world’s best recorded region.”
Ding et al., 2014
http://www.nature.com/nature/journal/v509/n7499/full/nature13260.html
“Here we show that the recent warming in this region [northeastern Canada and Greenland] is strongly associated with a negative trend in the North Atlantic Oscillation, which is a response to anomalous Rossby wave-train activity [planetary waves related to the Earth’s rotation] originating in the tropical Pacific. … This suggests that a substantial portion of recent warming in the northeastern Canada and Greenland sector of the Arctic arises from unforced natural variability.”
Parker and Ollier, 2017
“The loud divergence between sea-level reality and climate change theory—the climate models predict an accelerated sea-level rise driven by the anthropogenic CO2 emission—has been also evidenced in other works such as Boretti (2012a, b), Boretti and Watson (2012), Douglas (1992), Douglas and Peltier (2002), Fasullo et al. (2016), Jevrejeva et al. (2006), Holgate (2007), Houston and Dean (2011), Mörner 2010a, b, 2016), Mörner and Parker (2013), Scafetta (2014), Wenzel and Schröter (2010) and Wunsch et al. (2007) reporting on the recent lack of any detectable acceleration in the rate of sea-level rise.”
Jones et al., 2016
http://www.nature.com/nclimate/journal/v6/n10/full/nclimate3103.html
“Most observed trends [over the 36-year satellite data] are not unusual when compared with Antarctic palaeoclimate records of the past two centuries. … [C]limate model simulations that include anthropogenic forcing are not compatible with the observed trends. This suggests that natural variability overwhelms the forced response in the observations”
—
Stenni et al., 2017
http://www.clim-past-discuss.net/cp-2017-40/cp-2017-40.pdf
“No continent-scale warming of Antarctic temperature is evident in the last century. … [M]ost of the trends observed since satellite climate monitoring began in 1979 CE cannot yet be distinguished from natural (unforced) climate variability, and are of the opposite sign [cooling] to those produced by most forced climate model simulations over the same post-1979 CE interval.”
“A climate change caused by human emissions isn’t unusual enough”
What climate change due to human emissions ???
You have yet to prove that there is any warming whatsoever from human CO2. EMPTY.
Just keep chanting the brain-hosed AGW mantra seb,
… like a mindlessly yapping Chihuahua.
Its all you have.
“UAH is virtually identical to Hadruct4”
So seb, there must be two NON-warming periods in HadCrud4 like there is in RSS and UAH, correct?
You can see the one from 2001-2015 in Hadcrud4,
No warming.. how inconvenient.
But the NON-WARMING from 1980 to 1997 seems to have be hiding.
Perhaps you could find it for me, between looking for that elusive paper giving measured scientific proof that enhanced CO2 has ANY effect apart from enhanced plant growth.
We are STILL WAITING, its been a long time you know, and you are still TOTALLY EMPTY . !!
You do know that one or two year El Ninos anomalies would be highly unlikely to show up in a proxy data set with 30 year boxes.. or are you IGNORANT of that, as well.
But I do understand that NON-CO2 El Ninos are the ONLY warming you have, so you just gotta keep using them.
BTW, Hadcrud4 also shows an tiny anomaly of around 0.2ºC in February 2018.
Tanks for pointing that out, I hope your foot is tasty. 🙂
NOTHING TO SEE AT ALL !!
I just downloaded the proxy data from the Pages2K correction … there are 30 year bins and there is yearly data.
I don’t get it, first you argue that El Ninos (and La Ninas) are smoothed out in proxy bins and then you want to exclude those events in the instrumental record? Acting like they don’t have anything to do with increasing heat content? Weird.
You are getting weired with each week that passes …
Poor empty seb
You really are deranged by cognitive non-functionality, and a distinct LACK of basic education and understanding.!
You still haven’t got a clue about any of this, have you petal !!
Mixing proxies with instrumental data.. OOPS. !!
And you don’t even see the problem.. that is what is SO HILARIOUS. !
“AndyG55 29. March 2018 at 10:29 PM | Permalink | Reply
UAH for February 2018 is 0.2C NOTHING UNUSUAL”
You make my point extremely well. The last 30 year period in PAGES 2K was centred in 1985. In that year, UAH was circa -0.4C. A rise equal to the entire 2,000 year range in just three decades.
There was NO warming in UAH from 1980-1997.
The rise was purely from a TOTALLY NATURAL El Nino event. Its all the AGW scammers have to con illiterate fools into mindless “belief”.
And there was no data in UAH before 1979 (the tail end of a previous El Nino)
Are you so mathematically challenged that you can’t see a problem with a 1985 centre box .?? DOH !!!
You have been CONNED, because you refuse to think for yourself.
And of course, just by chance, 1985 is in a deep dip in UAH temperatures.
How “convenient” is that, hey! 😉
Yes, there was an EL Nino forced step change.
Absolutely NOTHING to do with human emissions or CO2, so NOT under the “climate change™” banner.
Just part of the TOTALLY NATURAL and HIGHLY BENFICIAL warming out of the COLDEST period in 10,000 years.
Phil, see if you can find something unusual about today’s temperatures relative to the past temperatures reported in these papers and graphs.
———————————————————
https://www.sciencedaily.com/releases/2015/05/150522174522.htm
“The Holocene Climate Optimum was a period of global climate warming that occurred between six to nine thousand years ago. At that time, the global average temperatures were somewhere between four to six degrees Celsius higher than they are today.”
–
Svalbard, Arctic, 4-6°C Warmer Than Present, Mangerud and Svendsen, 2017
“August temperatures on Svalbard were 6°C warmer at around 10.2–9.2 cal. ka BP … 4°C warmer than present between 8.2 and 6 cal. ka BP”
–
Patagonia, Southern South America, 3-4°C Warmer Than Present, Bertrand et al., 2017
–
Northwest China, 5-6°C Warmer Than Present, Zheng et al., 2017
–
East China, 3-4°C warmer than present, Li et al., 2017
–
Northern Japan, 3-4°C warmer than present, Kawahat et al., 2017
–
Fan Lake, Antarctica, 8°C warmer than present, Foster et al., 2016
–
Arctic Ocean, 3-4 °C warmer than present, Bonnet et al., 2010
–
North Iceland, 5 °C warmer than present, Andersen et al., 2004
–
Northwest Greenland, 2.5-4 °C warmer than present, Lasher et al., 2017
–
Antarctic Peninsula, 4-5°C warmer than present (1,000 years ago), Browne et al., 2017
–
NW Pacific, 4 °C warmer than present, Yamamoto et al., 2016
–
North Atlantic, 6°C warmer than present, Mark, 2016
–
Mediterranean Sea, 4°C warmer than present, Jalali et al., 2016
–
Alberta, Canada, 8°C warmer than present, Demezhko et al., 2017
–
British Columbia (Canada), 3-4°C warmer than present, Rosenberg et al., 2004
–
East Greenland, 3-6 °C warmer than present, Lusas et al., 2017
“Air temperatures in Milne Land, west of our study area, based on preliminary estimates from chironomids, may have been 3–6°C warmer than at present (Axford et al. 2013)”
–
Russia, 2.5° to 7.0°C warmer than present, MacDonald et al., 2000
“Over most of Russia, forest advanced to or near the current arctic coastline between 9000 and 7000 yr B.P. and retreated to its present position by between 4000 and 3000 yr B.P. … During the period of maximum forest extension, the mean July temperatures along the northern coastline of Russia may have been 2.5° to 7.0°C warmer than modern.”
–
Antarctic Peninsula, 3.5 °C warmer than present, Mulvaney et al., 2012
“A marine sediment record from offshore of the western Antarctic Peninsula also shows an early Holocene optimum where surface ocean temperatures were determined to be ~3.5 °C warmer than present, while the George VI ice shelf on the southwestern Antarctic Peninsula was absent during this early Holocene warm interval before reforming in the mid Holocene.”
—————————————————-
No unusual modern warming in the Northern Hemisphere
–
Lansner and Pepke Petersen, 2018
https://notrickszone.com/wp-content/uploads/2018/03/Holocene-Cooling-Northern-Hemisphere-1900-2010-Lansner-and-Pepke-Pederson-2018.jpg
–
Abrantes et al., 2017
https://notrickszone.com/wp-content/uploads/2017/04/Holocene-Cooling-Northern-Hemisphere-Abrantes-17.jpg
–
Buntgen et al., 2017
https://notrickszone.com/wp-content/uploads/2017/04/Holocene-Cooling-Northern-Hemisphere-Temps-B%C3%BCntgen-2017.jpg
–
Stoffel et al., 2015
https://notrickszone.com/wp-content/uploads/2017/04/Holocene-Cooling-Northern-Hemisphere-Stoffel-2015.jpg
—————————
Antarctica hasn’t warmed in the last 100 years.
Stenni et al., 2017
https://notrickszone.com/wp-content/uploads/2017/03/Holocene-Cooling-Antarctic-Stenni-17-East-West-Whole-Antarctica.jpg
–
PAGES 2K, 2013
https://notrickszone.com/wp-content/uploads/2018/03/Holocene-Cooling-Antarctica-PAGES-2K.jpg
———————————
Greenland hasn’t warmed in 80 years…and it’s 3 degrees C colder now than the mid-Holocene.
–
Mikkelson et al., 2018
https://notrickszone.com/wp-content/uploads/2018/02/Holocene-Cooling-Greenland-Since-1850-Mikkelsen-2018.jpg
–
Kobashi et al., 2017
https://notrickszone.com/wp-content/uploads/2017/07/Holocene-Cooling-Greenland-Kobashi-2017.jpg
——————
Alaska hasn’t warmed.
–
Nicolle et al., 2018
https://notrickszone.com/wp-content/uploads/2018/02/Holocene-Cooling-Alaska-Nicolle-2018.jpg
—————————–
The Subarctic North Atlantic hasn’t warmed.
–
Nicolle et al., 2018
https://notrickszone.com/wp-content/uploads/2018/02/Holocene-Cooling-North-Atlantic-Subarctic-Nicolle-2018.jpg
————————-
The North Atlantic hasn’t warmed.
–
Kim et al., 2017
https://notrickszone.com/wp-content/uploads/2017/06/Holocene-Cooling-North-Atlantic-SSTs-Only-Kim-2017.jpg
–
West Antarctica has been rapidly cooling since 1999.
–
Oliva et al., 2017
http://www.sciencedirect.com/science/article/pii/S0048969716327152
However, a recent analysis (Turner et al., 2016) has shown that the regionally stacked temperature record for the last three decades has shifted from a warming trend of 0.32 °C/decade during 1979–1997 to a cooling trend of − 0.47 °C/decade during 1999–2014.
——————–
The Southern Ocean has been cooling since 1979.
–
Purich et al., 2018
https://notrickszone.com/wp-content/uploads/2018/01/Southern-Ocean-Cooling-1979-to-2013-Purich-2018.jpg
–
Fan et al., 2014
https://agupubs.onlinelibrary.wiley.com/doi/pdf/10.1002/2014GL059239
“Cooling is evident over most of the Southern Ocean in all seasons and the annual mean, with magnitudes approximately -0.2–0.4°C per decade or -0.7–1.3°C over the 33 year period [1979-2011].”
———————————–
The Himalayas haven’t warmed.
–
Thapa et al., 2015
https://notrickszone.com/wp-content/uploads/2017/02/Holocene-Cooling-Himalaya-Nepal-Thapa-15.jpg
–
I literally have hundreds more papers like these. See if you can “debunk” these first few first before I post the next batch.
Here’s a challenge for you. Plot the PAGES 2K reconstruction then add HADCRUT4 up to the present day.
If you really think recent temperatures are nothing unusual, what better way to demonstrate it?
Phlop, you just should how mathematically ILLITERATE you are.
(and you probably don’t even know how.)
Keep digging.. its funny. 🙂
typo correction
should => showed
DNFTT
As you can see, it breeds (PC)
Psst, skeptics don’t like mixing instrumental records with proxy data. They argue that proxy data is smoothed, so you can’t do that even though the proxy data gets calibrated using the instrumental record and thus usually matches it for the last few decades.
Don’t be intimidated by that Andgy55 troll who likes to insult people just for the fun of it.
Except when it doesn’t match…and then the decline gets hidden and replaced with “completely artificial adjustments” to make the cooling go away. Like this…
https://notrickszone.com/wp-content/uploads/2017/08/Holocene-Cooling-Northern-Hemisphere-Briffa-2002-Divergence.jpg
Or this…
https://notrickszone.com/wp-content/uploads/2017/08/Holocene-Cooling-Northern-Hemisphere-Xing-2016-Instrumental-.jpg
Or this…
https://notrickszone.com/wp-content/uploads/2017/08/Hide-the-Decline-Using-Mikes-Nature-Trick.jpg
And, as you know, Kenneth, the proxy data neither shows a rise nor does it calibrate with the last portion of the instrumental record, which was the whole point of adding the instrumental record, to “HIDE THE DECLINE”
See these as well.
https://notrickszone.com/2017/08/31/scientists-expose-data-manipulation-hide-the-decline-and-the-post-1940s-hockey-stick-temperature-myth/#sthash.sDMQv8Ad.dpbs
http://joannenova.com.au/2014/09/manns-trick-to-hide-the-decline-still-shocking/
https://junkscience.com/michael-mann-defamed-or-defined-by-hide-the-decline/
The resident troll is getting ever more brazen in his dishonesty.
Your mathematical INEPTITUDE shines through your mindless ranting, seb.
I think you meant to write: “Scientists don’t like mixing instrumental records with proxy data…”
Proxies will VERY OFTEN miss the wide swings that would appear in modern data.
That is the nature of proxies.
It doesn’t matter if you smooth the instrumental data, that wide swing was detected and influences the smoothing.
Its basic mathematics.. ie WAY beyond you, seb.
One thing that the PAGES2K work does is show very clearly that the bottom of the final up-tick in temperature is at about 1920.
Let’s look at the GISP ice core data…
Remember, the BOTTOM of the final little up-tick is about 1920, as per PAGES2K
That puts the top of that final up-tick as the peak around 1940….
We know the 1940s temperature is similar to current temperatures in the NH.
So the current temperatures would be close to the green line on this graph.
https://redneckusa.files.wordpress.com/2010/04/f12.jpg
“We” actually know it better …
https://diggingintheclay.wordpress.com/2010/12/30/dorothy-behind-the-curtain-part-2/
https://www.dmi.dk/en/climate/climate-changes-over-time/greenland/
https://s19.postimg.org/3zakdupdv/greenland_temp.png
https://s19.postimg.org/ceo16fi7n/Greenland-Ice-Sheet-Briner.jpg
https://s19.postimg.org/o74crkzs3/Greenland_Kobashi_2017.png
https://s19.postimg.org/7tl7hii8z/greenland1.jpg
https://s19.postimg.org/vws4z68s3/arctic_temp.png
https://s19.postimg.org/loqxfbppf/Holocene-Sea-Ice-Greenland-Sha-17.jpg
https://s19.postimg.org/5ffms4j1v/iceland_8.jpg
https://s19.postimg.org/o1d61lfoz/Ncdc_measured.jpg
Yep seb , 1940s were pretty similar temperature to now, possibly slightly warmer.
The LONG view…
https://diggingintheclay.files.wordpress.com/2010/12/3500years.png
…shows all the stuff that Mann said wasn’t there.
And, as the author writes about modern temps “The DMI points out that its data is unadjusted, so there may be some Urban Heat Island (UHI) effect at work, particularly with regard to the Nuuk station.”
That’s funny, now you call for adjustments? 😉
UHI and El Ninos.
Only the warming in the world.
CO2.. NOT A SKERRICK
Correct. Even the uncompromised by non-artificial heating instrumental record shows that.
Lansner and Pepke Petersen, 2018
https://notrickszone.com/wp-content/uploads/2018/03/Holocene-Cooling-Northern-Hemisphere-1900-2010-Lansner-and-Pepke-Pederson-2018.jpg
–
Soon et al., 2015
https://notrickszone.com/wp-content/uploads/2017/04/Soon-Connolly-2015-NH-Temps.jpg
As do the proxies…(notice that all the NH warming took place before 1950, and that there’s been no net change since).
Ljungqvist, 2010
https://notrickszone.com/wp-content/uploads/2017/06/Holocene-Cooling-Northern-Hemisphere-Ljungqvist-2010-Wilson-2016.jpg
–
Wilson et al.,, 2016
https://notrickszone.com/wp-content/uploads/2017/06/Holocene-Cooling-Northern-Hemisphere-Schneider-2015-Wilson-2016-Long.jpg
–
Buntgen et al., 2017
https://notrickszone.com/wp-content/uploads/2017/04/Holocene-Cooling-Northern-Hemisphere-Temps-B%C3%BCntgen-2017.jpg
–
Stoffel et al., 2015
https://notrickszone.com/wp-content/uploads/2017/04/Holocene-Cooling-Northern-Hemisphere-Stoffel-2015.jpg
It’s only when they fiddle with the data by artificially adding 0.24 C to the recent trend…
Since 2008, 0.24°C Of ‘Extra’ Warming Has Been Added To NASA’s 1910-2000 Global Temperatures
…or when they remove 0.5 C of warming from the 1880-1950 record to cool the past…
https://notrickszone.com/wp-content/uploads/2018/03/NASA-GISS-Global-Temperatures-1987.jpg
https://notrickszone.com/wp-content/uploads/2018/03/NASA-GISS-Global-Temperatures-2018-Trend.jpg
…or when they make “completely artificial adjustments” to the instrumental temperature record (to “hide the decline”)…
Scientists Expose Data Manipulation, ‘Hide The Decline’, And The Post-1940s Hockey Stick Temperature Myth
…that the 1980s-present period becomes much warmer.
https://notrickszone.com/wp-content/uploads/2018/03/PAGES-2k-2015-Anomalous-Cooling.jpg
Interesting that their future “simulation” shown very little extra warming out to 2080 (or where-ever the graph ends)
That matches well with the 5 CHIMPS….. NOT !
The “simulated” temperatures were added by me. They’re merely a copy/paste of the 1st millennium temperatures added to the end of the PAGES 2K record. That’s the only reason why they’re warmer than the 20th century…because the 1st millennium was warmer then. How else could it be explained that humans were farming on W. Greenland in regions where farming isn’t even possible today…or why wine vineyards flourished in Scotland.
Oops,
I made an assumption it was their “simulation”
Do they attempt to o that sort of “simulation”
Busy doing shed stuff, which is FAR more important. 🙂
Where did you get this one from? Is this what you base your understanding of past warm temperatures on?
Add “history ” to the long list of things that seb is CLUELESS about.
I know you are just trolling, but please, enlighten us and dig up the stories of the Scottish vineyards of the past and the delicious vine that they must have produced up there 😉
Trolling? I don’t write things without having the capacity to back it up. I would think that such a reputation would have been established by now.
In this case, I had it wrong about Scotland. Apparently northern England (York) was the furthest north wine vineyards got during the Medieval Warm Period. But there were actually wine vineyards in Russia, southern Norway, and at elevations in Germany 220 meters higher than today during the Medieval Warm Period.
Lamb, 1959
https://rmets.onlinelibrary.wiley.com/doi/abs/10.1002/j.1477-8696.1959.tb00533.x
“There was a secondary optimum of climate between 400 and 1200 A.D., the peak probably being 800-1000 A.D. This was on the whole a dry, warm period and apparently remarkably stormfree in the Atlantic and in the North Sea. It was the time of lowland settlement in the Saxon lands and of considerable flowering of Celtic and Northumbrian cultures. Missions from the Celtic Church in Ireland were sent as far as Africa and Iceland. It was also the time of great Viking voyages and the settlement of Iceland and Greenland. The early Norse burials in Greenland were deep in ground which is now permanently frozen. There were several visits to America (probably many timbergetting voyages between Greenland and Labrador) and there is evidence which suggests that at least one Viking ship got through the North-West Passage and ultimately reached the Gulf of California (cf. Ives 1953).”
“In Domesday Book (1085) 38 vineyards were recorded in England besides those of the king. The wine was considered almost equal with the French wine both in quantity and quality as far north as Gloucestershire and the Ledbury area of Herefordshire where the soil is said to resemble that of the Rhine and Moselle wine districts. The London basin, the Medway valley and the Isle of Ely were also favoured districts. The northernmost vineyards were near York but the most favoured country was from Northants and the Fenland southwards. This implies summer temperatures perhaps 1 to 2°C higher than today, general freedom from May frosts (particularly suggested by the exposure to the north of several low-lying vineyard sites, e.g. at Tewkesbury, in the Fens and at Teynham, Kent) and mostly good Septembers.”
“At one time (1128-1437) wine had been produced in East Prussia.”
“Grapes grew even at Tilsit (55°N) in Lithuania [Russia]…”
“…and in south Norway…”
“…as well as in southern England and as high as 780 m above sea level in the Black Forest [Germany].”
“The highest vineyards in Germany today [1959] are about 560 m near the Boden Sea in Baden.”
————————————————————–
The highest vineyards in Germany today (2016) are still 560 m above sea level, the same height as it was in the late 1950s, which is 220 meters lower elevation for German vineyards/wine-making than during the Medieval Warm Period.
https://blog.liebherr.com/appliances/uk/lake_constance/
“And, the steep slopes of the Hohentwiel, an extinct volcano close to the western end of Lake Constance, are home to Germany’s highest vineyard, at 562 metres.”
http://www.strangehistory.net/2012/12/24/roman-and-medieval-vinyards-in-chilly-britain/
“[F]orty six British vineyards were recorded as far north as Suffolk. … Britain, certainly the Southern half of it, was as good for growing grapes as France is now [during Roman times]”
“[S]ince the Romans controlled Italy and France, generally reckoned to be the world’s best wine-growing regions, before they invaded England, when it came to wine, they presumably knew what they were talking about. So when they claimed that it was feasible to produce rather good wine in England (or even Scotland, if we’re talking about the bottom half which they actually occupied), one has to assume that it was a prosaic statement of fact.”
https://www.independent.co.uk/news/science/veni-vidi-viticulture-remains-of-roman-vineyards-found-in-uk-738723.html
“One of the main wine-producing areas of Roman Britain seems to have been the Nene Valley, in what is now Northamptonshire. In the valley, near the village of Wollaston, archaeologists have found ancient vineyards covering at least 30 acres, in which vines were grown in the Mediterranean Roman style, exactly as described by classical authors such as Pliny and Columella. On one site, the remains of four miles of bedding trenches have been found. Estimates suggest that the site contained 4,000 vines, producing 10,000 litres of wine a year.”
http://www.dailymail.co.uk/sciencetech/article-2583631/Did-Romans-produce-wine-Cambridge-2-000-year-old-irrigation-vineyards-unearthed-farmland.html
Did the Romans produce wine in Cambridge? 2,000-year-old irrigation system for vineyards unearthed on farmland
Its quite BIZARRE the amount of effort the AGW sicko-phants put in to DENY the existence of the MWP as being WARMER than current day. And the Roman Warm Period and the Minoan even Warmer Period leading back to a MUCH warmer Holocene optimum.
And these WARM period were when humans thrived and civilisations flourished.
And then attempting to DENY that the LIA was the COLDEST most desperate ANOMALY in some 10,000 years, that brought much of human civilisation to its knees.
We all know who the real CLIMATE CHANGE DENIERS are.
“Lamb reports two vineyards to the north (Lincoln and Leeds, Yorkshire) at some point between 1000 and 1300 AD, and Selley even reports a Scottish vineyard operating in the 12th Century. “
QED !!
Smells like someone fishing for conspiracies …
Again with the word “conspiracy”, hey seb.
You are the ONLY one using it.
Do you have “insider information” ??????
Nope. Having all the “errors” move in one direction – cool the past, warm the present – and epiphanies about temperature proxies no longer being temperature proxies a year after publication…are completely coincidental.
Why is it, SebastianH, that you’re the only one who uses the word “conspiracy”? Since we don’t, why do you?
Or a statistician calling out an egregiously improbably happening.
I could swear I replied to this one … well then, Kenneth, you are claiming that it is not chance. That is the conspiracy you are claiming exists. You don’t have to write the word “conspiracy” for that to be clear.
Poor seb , yapping for attention yet again.
You are the only one using that word.
Stop your DENIAL.
I think you meant to write: “Scientists don’t like mixing instrumental records with proxy data…”
K, Thanks for showing that even a specifically set-up propaganda AGW groups STILL agrees with this comment I made on 26th March
https://notrickszone.com/2018/03/25/alarmism-takes-a-big-hit-flood-of-new-scientific-findings-show-nothing-unusual-happening-climatically/comment-page-1/#comment-1256208
Yes, it’s time to start asking the alarmists what caused the extreme Little Ice Age cooling…since that’s the exception to the rule. Modern temperatures are just a slight retrieve from that exceptional period.
It even shows up as the hockey stick blade in the sea ice reconstructions for the Holocene…
https://notrickszone.com/wp-content/uploads/2017/11/Arctic-Sea-Ice-Extent-North-of-Iceland-3000-Years-Moffa-S%C3%A1nchez-and-Hall-2017.jpg
https://notrickszone.com/wp-content/uploads/2017/03/Arctic-Sea-Ice-Holocene-Stein-17.jpg
Lots of possible causes listed on Wikipedia, take the one you prefer:
https://en.wikipedia.org/wiki/Little_Ice_Age#Possible_causes
So, you haven’t got a clue.. OK
nothing unusual about that, is there.
One day when you leave granny’s basement….
…look up at that glowing ball in the sky.
Have you figured out yet by how much % the glowing ball’s output (that reaches Earth) changed over the current minimum? What is that expressed as forcing in W/m² over the entire planet’s surface?
Seb displays his wilful IGNORANCE of solar variability, yet again
Not just TSI, little yapper.
The global multiproxy database for temperature reconstructions of the Common Era (PAGES2k Consortium) Abstract states inter alia :
“… Nearly half of the proxy time series are significantly correlated with HadCRUT4.2 surface temperature over the period 1850–2014 …” and the Summary refers a few times to correlation with the HadCRUT instrumental record.
Wasn’t that a problem with Mann’s effort? Sounds like circular reasoning to me.
Screening samples, excluding or devaluing samples that don’t look like good ‘thermometers’ almost inevitably gets you a ‘hockey stick’, how do they know that the proxy samples that chronologically overlap and happen to correlate with the instrumental record do so over the whole period i.e. the 2000 year “Common Era”?
… instrumental record, had it existed over the whole period …
They don’t. It’s an assumption being made. As the divergence problem of the tree ring proxies shows, those might not necessarily be reliable in all situations.
“It’s an assumption being made”
ROFLMAO. !!!
ASS-umption.
AGW anti-science to a ‘T’
It really is a fabricated little fantasy world, isn’t it seb.
“I literally have hundreds more papers like these. See if you can “debunk” these first few first before I post the next batch.”
Everyone needs a hobby 😉 When did I ever claim the planet has NEVER been this warm? Heck I even cited Marcott.
http://www.realclimate.org/images//Marcott.png
And it is not just debunking that is needed, it is restoring the selective quotation. Eg
“The Holocene Climate Optimum was a period of global climate warming that occurred between six to nine thousand years ago. At that time, the global average temperatures were somewhere between four to six degrees Celsius higher than they are today. ”
Is followed by
“That is the range of warming that climatologists are predicting due to the build-up of greenhouse gases in the atmosphere from human activity.”
It’s the naughty step for you …
Yes, Marcott.
1. The alkenone, uh, problem… https://climateaudit.files.wordpress.com/2013/03/alkenone-comparison1.png
The problem uncovered by Steve McIntyre is that on comparing the end dates for the series used by Marcott with the original end dates published by the researches he found that they have ‘changed’. Series which ended long before the present day are now included in the present day reconstruction and series with published end dates up to present have been excluded. If the published end dates are used rather than Marcott’s changed dates, then the uptick becomes a downtick.
2. The “not statistically robust” and “cannot be considered representative of global temperature changes” problem…
Marcott himself (interview): “Our global paleotemperature reconstruction includes a so-called “uptick” in temperatures during the 20th-century. However, in the paper we make the point that this particular feature is of shorter duration than the inherent smoothing in our statistical averaging procedure, and that it is based on only a few available paleo-reconstructions of the type we used. Thus, the 20th century portion of our paleotemperature stack is not statistically robust and cannot be considered representative of global temperature changes”
3. The refusal to cite the contradictory proxy data that completely undermines the 20th century uptick problem.
http://www.comments.sciencemag.org/content/10.1126/science.1228026
“What Marcott has produced for us is a climatic history of the Holocene based upon tree-ring proxies. 1. The proxy data in the accompanying Excel file show no dramatic increase in the 20th century. This can easily be checked simply by plotting the supplied data. 2. Figures S5 and S6 show no recent upturn at all. 3. The Phd thesis of the first author uses the same data sets and plots similar graphs, but with no trace of any sharp increase. This earlier contradictory work is not cited in the paper.”
4. The contradicted-by-100s-of-other-reconstructions problem.
200 Non-Hockey Stick Graphs Published Since 2017 Invalidate Claims Of Unprecedented, Global-Scale Warming
But please do just ignore points 1-4 and keep on believing we are living in a period of unprecedented warmth.
“Let’s look at the GISP ice core data…”
The graph is wrong. The GISP2 data terminates in 1855.
So you admit that Mann and Pages2K are WRONG in their reconstruction.
The up-tick at the end of the LIA is in the wrong place
Well done.
You finally figured it out. 🙂
[…] Read more at notrickszone.com […]
….. or why wine vineyards flourished in Scotland.
Like Dalrossach (Aberdeenshire), Momentum (Fife) or Poly Croft (Outer Hebrides)?
http://www.gbvg.uk/vineyard/dalrossach-vineyard
http://www.gbvg.uk/vineyard/momentum-vineyard
http://www.gbvg.uk/vineyard/poly-croft-vineyard
“The reconstructed MCA pattern is characterized by warmth over a large part of the North Atlantic, Southern Greenland, the Eurasian Arctic, and parts of North America, which appears to substantially exceed that of the modern late–20th century (1961–1990) baseline and is comparable to or exceeds that of the past one-to-two decades in some regions. This finding is consistent with that of a recent tree-ring–based study of high-latitude Eurasian temperatures. Relative warmth in the central North Pacific MCA is consistent with the expected extratropical signature of the strong observed La Niña–like pattern in the tropical Pacific (strong cooling in the east and warming in the west). Certain regions, such as central Eurasia, northwestern North America, and (with less confidence) parts of the South Atlantic, exhibit anomalous coolness ”
Mann et al 2009.
http://science.sciencemag.org/content/326/5957/1256.full
From one of the screwball chatbot’s links…
lolololol
Phlop Clarke plops again.
And the second one
http://www.dailymail.co.uk/news/article-3424009/Best-stick-Bucky-Scotland-s-vineyard-didn-t-make-wine-year-area-s-rainy.html
“Christopher Trotter claims to be the first vintner to make wine from grapes grown in the open air in Scotland since the Romans. (other than the one in the 12th century)
The Polycroft on Lewes also have some indoor vines, ….however they are selling the fruit rather than making wine”
A very hilarious FACE-PHLOP from the mindless parrot ! 🙂
I’d be embarrassed for them, except they bring it on themselves. Such gluttons for punishment. So sad.
….. or why wine vineyards flourished in Scotland.
Like Dalrossach (Aberdeenshire), Momentum (Fife) or Poly Croft (Outer Hebrides)?
You mean the ones currently covered in snow and have been for most of the last 2 months?
[…] Ref.: https://notrickszone.com/2018/03/29/another-bust-pages-2k-global-reconstruction-fails-to-confirm-the-… […]
[…] which were corrected in a second corrigendum published in 2015 (see a more complete discussion here). The relevant data for the Arctic are available at the NOAA website here; using the published […]
[…] https://notrickszone.com/2018/03/29/another-bust-pages-2k-global-reconstruction-fails-to-confirm-the-… […]
[…] Link: https://notrickszone.com/2018/03/29/another-bust-pages-2k-global-reconstruction-fails-to-confirm-the-… […]
I keep being told the 2017 PAGES 2K paper matches Mann’s Hickey Stick. I can’t see where it does. Anyone else?