These are tough times for the US climate-ambulance chasers, who like to use every extreme-weather event as a God-sent sign the climate is going to hell in a handbasket.
Tornadoes AWOL, models contradicted
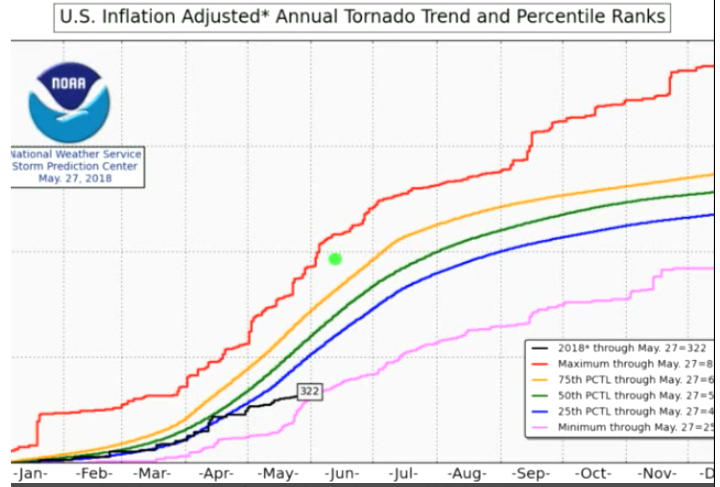
But even weather extremes aren’t cooperating with the climate predictions and models. For instance, yesterday meteorologist Joe Bastardi at Weatherbell noted that US tornado activity is near a record low so far this year.
2018 US tornado activity is “well below normal” and “near a record low”. Chart: NWS.
And despite claims by some US alarmist agencies of record high global temperatures occurring year after year, tornado activity over the past decades has in fact been trending downward, and so stands in stark contrast to the media and climate alarmism hysteria of greater and more frequent weather extremes.
Source: www.ncdc.noaa.gov/climate-information/extreme-events/us-tornado-climatology/trends
Hurricane 2018 season looks dampened
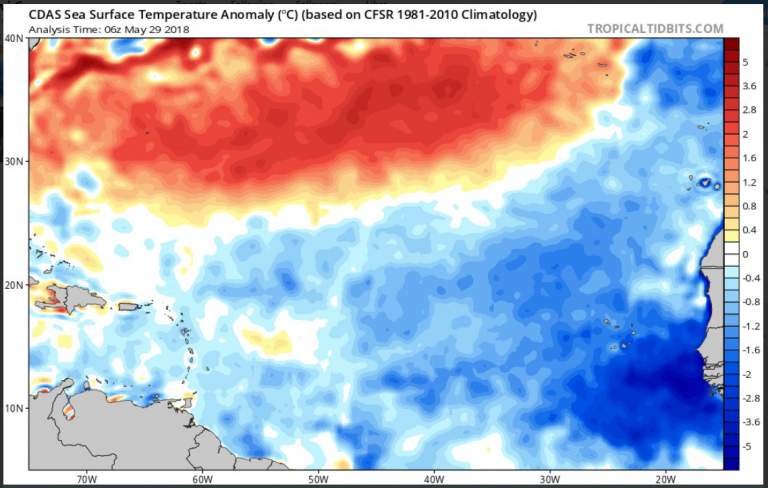
Moreover a number of meteorologists are also hinting that the 2018 hurricane season could be weaker than normal, due to unusually cool tropical Atlantic sea surface temperatures – especially off the west coast of Africa where many hurricanes are spawned.
For example at Twitter Levi Cowan of Tropical Tidbits recently commented how the sea surface temperature anomaly off the coast of West Africa was “brutal”.
Tropical Atlantic sea surface temperatures (SSTs) are extremely low off the coast of Africa, which may dampen the hurricane formation. Source: Tropical Tidbits.
Joe Bastardi also noted in his most recent Saturday Summary that the current pattern has been seen of and on before in the 1970s, 80s and 90s, and adds that “most of those seasons aren’t big hurricane seasons”.
When the Madden-Julian Oscillation enters phase 5 and 6 in June with cold sea surface temperatures off western Africa, it is indicative of lower accumulated cyclone energy (ACE) for the upcoming season, Bastardi suggests.
Currently Bastardi has his ACE projection at 65 to 85% of normal. The veteran meteorologist does warn, however, of “in-close” development, where storms can form not far off US coast. Indeed it’ll be interesting to see how the upcoming hurricane season pans out in comparison to last year’s, when conditions in the Atlantic were quite different.
Arctic “death spiral” in its death throes
And there’s more bad news for the climate ambulance chasers – at their beloved Arctic.
Japanese skeptic climate blogger Kirye (photo right) at Twitter recently tweeted that Arctic sea ice volume late this spring is at the 2nd highest level in 11 years!
As the Arctic has seen very warm surface temperatures over the past winter, the current elevated sea ice volume tells us that there’s much more behind the ice than surface temperatures. This is something we’ve been trying to tell alarmists for years.
Greenland adds 600 billion tonnes
Moreover, Greenland has added 600 billion tonnes of ice, Kirye shows.
So in summary, for the time-being climate alarmists will have to content themselves with insignificant weather anecdotes to keep their alarmism and climate quackery alive.


Yesterday the big climate news in the Netherlands was that hurricane season officially has started in the USA with the first hurricane that reached the coast, state of emergency in Florida and hurricane shelters open for the public. Later the hurricabe was reported to be downsized to a depression, so probably some wind and rain It clewarly shows how eager the MSM are to bring the Climate Alarm messages, and not only in the USA.
DMI Arctic sea ice volume now above all of last decade except 2010.. also above 2008
Tomorrow it will probably be above the average since 2003.
Just looked at “tropics land” in UAH.
April 2018 was actually in equal 31st place out of 40.
Not much warming on the horizon !!
Will be very interesting to see if the tropical oceans continue their plunge into negative anomaly territory (UAH)
Already in 27th place out of 40 in April.
Remember, the tropics is the region that is supposed to absorb most of the sun’s energy. Also moist air and raised CO2 levels, so all that back-radiation (lol…. as if)
And of course the big player is what the oceans are doing.
Sea Surface Temperatures (SSTs) generally have fallen (by about 0.2°C) after their peak in 2016. This in itself is not particularly alarming but it does show that SSTs are bucking against cAGW advocates meme of global warming.
https://rclutz.files.wordpress.com/2018/03/hadsst022018r.png
Even the IPPC acknowledges “The climate system is a coupled non-linear chaotic system, and therefore the long-term prediction of future climate states is not possible.” and later …
“With respect to the long-term natural variability in the climate system per se, it is important to understand this variability and to expand the emerging capability of predicting patterns of organised variability such as El Niño-Southern Oscillation (ENSO).”
The oceans are just one of those poorly understood non-linear chaotic systems that greatly affects our weather and climate. There are many known components to our climate system that are like this (chaotic, pseudo-cyclic), what we do not know is the amount and influence all the unknowns have on the long-term natural variability.
Arctic and Antarctic ice come and go dictated by the variability of the local weather, oceanic, and climate patterns. Transient effects may or may not signal something, it is not that well known, however if the growth in ice continues it does, this does not bode well for the future as overall the world may again be slipping into a deadly cooling era.
Declining global ice generally signals a better, warmer and wetter global climate and a flourishing biosphere.
Increasing global ice generally heralds the start of a deadly cooling, desertification, and in extremis to extinctions.
Static ice amounts usually indicate a change is about to happen.
Tomomason, you said, “Arctic and Antarctic ice come and go dictated by the variability of the local weather, oceanic, and climate patterns.”
You know, as far as the Antarctic is concerned I don’t really think this is true. The reporting on it is very misleading. As I understand it, the seasonal melting is confined to only two segments:
1. The sea ice which surrounds Antarctica.
2. The West Antarctic Ice Sheet (WAIS). It comprises only 10% of the Antarctic Ice Cap & extends 2500 meters under the sea due to sinking of this part of the continent.
In both cases we are talking about ice in contact with sea currents. And of course this is a large part of why the Arctic is so much more variable, since it has no underlying continent to shelter the ice from the seawater.
I’m sure you already know all this, but it maddens me so to hear them misrepresent Antarctica.
DMI Arctic sea ice volume is now above the 2003-2017 average. (Date 30/5/2018)
@Penelope 31. May 2018 at 8:35 AM
“I’m sure you already know all this, but it maddens me so to hear them misrepresent Antarctica.”
Indeed, so true that reports on the Antarctic ice are skewed toward flagging up evidence that is mostly focused the Western part of the continent, and all to often through creative writing and sophistry extrapolated out to imply what is happening is to the whole continent. Most of what is moving/changing in the West Antarctic appears to be influenced by volcanic activity.
Ice variation of the whole of the Antarctica is very low as a percentage of all Antarctic ice, however as you say “In both cases we are talking about ice in contact with sea currents.”, does that not puts it (just?) within bounds of my “… variability of the local weather, oceanic, and climate patterns.” ?
Tomomason, you say
Ice variation of the whole of the Antarctica is very low as a percentage of all Antarctic ice, however as you say “In both cases we are talking about ice in contact with sea currents.”, does that not puts it (just?) within bounds of my “… variability of the local weather, oceanic, and climate patterns.” ?
Indeed it does. It’s just that I use “the Antarctic” to mean the ice cap over the continent, not including the temporary sea ice that forms around it seasonally, and melts down to around 13%. And if one accepts my convention then, notwithstanding the WAIS melt, the variability of the Antarctic is only upward.
Naturally this is not acceptable to the powers behind the AGW hoax, so as you say, they practice sophistry. Any mention of Antarctic Ice Sheet growth is spoken of as averting so much sea level rise. And it’s mentioned as little as possible.
Instead they blabber about the seasonal sea ice that surrounds Antarctica. They never once call it “single-year ice” let alone “single-season ice.” Of course it melts; initially counted are ocean areas having as little as 15% ice, and w unlimited area to spread out it’s unlikely to be very thick.
According to the new analysis of satellite data, the Antarctic ice sheet showed a net gain of 112 billion tons of ice a year from 1992 to 2001. That net gain slowed to 82 billion tons of ice per year between 2003 and 2008. 10/15 Journal of Glaciation based on NASA study http://phys.org/news/2015-10-mass-gains-antarctic-ice-sheet.html
I don’t mean to be dogmatic about the Antarctic Ice Sheet including the WAIS always increasing. Certainly less precipitation would slow any increase. However, if there is one item in all the AGW hoax which is self-incriminating it is the claim that the Antarctic Ice Sheet is melting.
Avg Winter Antarctic: -70 degrees Celsius; Avg Summer: -35 degrees Celsius. (-31 degrees F)
To begin to melt the ice you would have to raise the temperature to 1 degree Celsius.
In Fahrenheit terms to BEGIN to melt the ice you would have to raise the temperature even in summer by 63 degrees Fahrenheit! The idea of this permanent ice melting to flood our coastlines is a fabulous lie, the reasons for which we dare not ignore.
@Penelope 1. June 2018
Thanks for the reply and explanation. No I don’t think you’re being dogmatic, it’s the cAGW numbnuts that are the problem as they are forever extrapolating small changes around the WAIS to the whole continent.
And yes the idea of this permanently frozen feature of planet Earth melting and defrosting to overfill the oceans is one I enjoy poking fun at. Bits of ice break-off at the edges, some ice may get weathered away. Antarctic ice melt around the volcanoes, and close to the warm waters of Deception Island (a caldera for an active volcano) with it’s number of the pools within the port are filled with natural warm water (as the tourist guide says).
Outside of these regions and a continent having an average temperature of -70°C to -35°C (winter to summer) it is impossible to melt the ice.
So yes Antarctica is not melting away.
Not to worry. You forget the permanent drought thing they keep harping on. They can always point to something.
http://droughtmonitor.unl.edu/
@The Other Brad 30. May 2018
Wow that looks so alarming 😉 .
Drought at “record levels?”
Well, maybe record LOW levels, or close to it.
https://stevengoddard.wordpress.com/2014/12/18/us-drought-at-historically-low-levels-2/amp/
[…] Fonte: No Tricks Zone […]
As the Arctic has seen very warm surface temperatures over the past winter…
Positive anomalies do not equate to “warm” — so just how warm was it?
-8°C, for a very brief time.
http://ocean.dmi.dk/arctic/meant80n.uk.php
If you click on 1976 in the DMI link, you will not see much change. Pretty similar to 2018
[…] 2018 TORNADO ACTIVITY NEAR RECORD LOW…Hurricane Season Looks To Be Weaker…Greenland Adds 600 Bil… […]
[…] sea ice cover has remained mostly steady over the past 11 years (since 2007). Moreover, Arctic and Greenland ice volume have piled up […]
[…] cover has remained mostly steady over the past 11 years (since 2007). Moreover, the Arctic and Greenland ice volume have piled up […]
[…] Moreover, Arctic and Greenland ice volume have piled up recently. […]