The Global Environment and Marine Department of the Japanese Meteorological Agency recently corrected the long term trend in the annual mean sea ice extent in the Antarctic area: from 0.015 x 10⁶ km2 per year to 0.019 x 10⁶ km2 per year on 11 May 2018.
That’s more than a 25% adjustment (15,000 sq. km to 19,000 sq km). So while chunks the size of Manhattans may break off from time to time, about 300 Manhattans of new ice gets added annually.
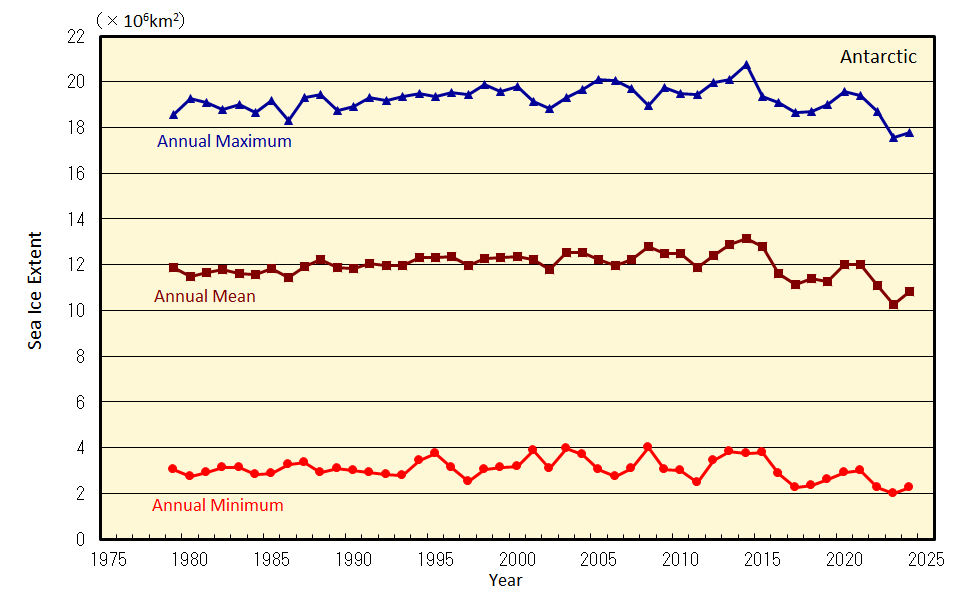
The report notes that in the Antarctic Ocean: “the annual maximum and annual mean sea ice extents have shown a long-term trend of increase since 1979”.
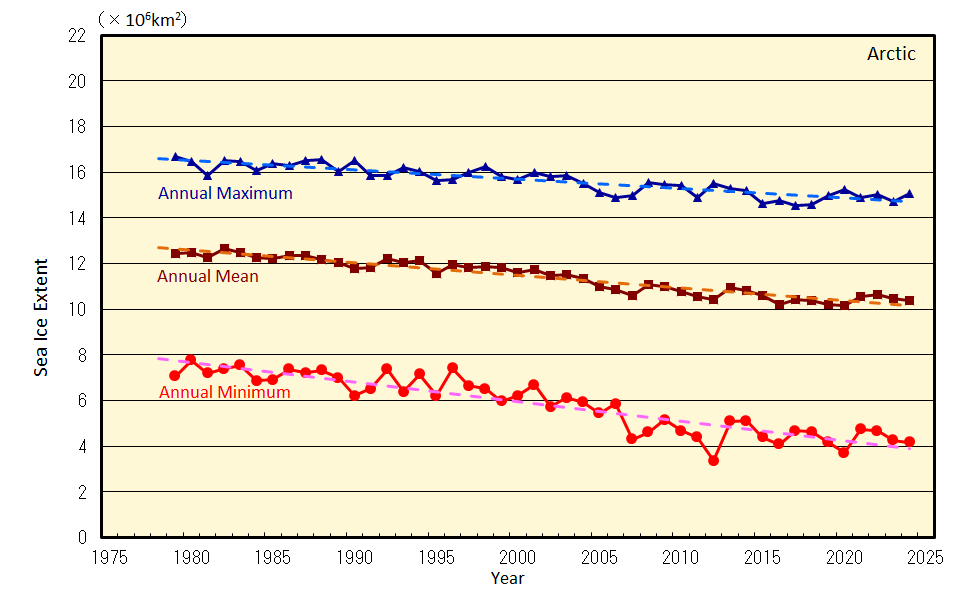
The Japanese weather and climate site provided the following 2 charts showing sea ice extent for both the Arctic and Antarctic respectively since 1979. From them we see some interesting developments.
Arctic downward trend halted
Although the Arctic has seen a downward trend over the past 4 decades, we note that the mean Arctic sea ice cover has remained mostly steady over the past 11 years (since 2007). Moreover, Arctic and Greenland ice volume have piled up recently.

Sea ice extents are calculated from brightness temperature data provided by NASA and NSIDC (the National Snow and Ice Data Center). Image: JMA here.
Next we look at the Antarctic, which also reveals some interesting aspects.

Image: JMA here.
Long-term increase “virtually certain”
Though the Antarctic dipped markedly over the past 4 years, the overall trend has been upward. In its commentary, the JMA states “it is virtually certain that there has been a long-term trend of increase in the annual maximum and annual mean sea ice extents in the Antarctic Ocean since 1979.”
Little change since 1980
When looking at the annual linear mean trend of both the Arctic and Antarctic and combine them, then we have a total annual mean of about 24.2 million square kilometers back in 1980.
And when we look at 2017, we see a combined mean amount of about 22.7 million square kilometers, which is about 1.5 million sq km less than 1980 – or roughly 7% less. This is within the range of natural variability.
Both the warm phase of the Atlantic Multidecadal Oscillation (AMO) and the Pacific Multidecadal Oscillation coincided in the late 20th and early 21st century to push global temperatures upwards, and thus contribute significantly to the decrease, yet only managing to reduce global mean sea ice area by some 7%.
All the talk of rapidly melting ice caps is more hysteria than reality.


[…] Japanese Meteorological Agency Corrects Antarctic’s Long-Term Sea Ice Growth Trend Upwards […]
OT. UK wind drops to 0.2% of demand.
https://notalotofpeopleknowthat.wordpress.com/2018/06/01/wind-power-drops-to-2-year-low/
Thank goodness for all that gas from Russia and Norway. 🙂
But Pierre, we all know that CO2 only causes warming in the Arctic. 😉
Re Antarctic sea ice level. Its making gradual progress, is above 2002 and 2017, will cross above 2016 in the next couple of days, then join the main bunch soon after that.
Will probably max at between 18 and 19.5, I’m going to say nearer 19 than 18 Mkm².
Let’s not forget that a big chunk fell off one of the shelfs a year or two ago. That will take a bit of replacing.
AndyG55,
I’ve been trying to find out how far that chunk got to.
The early reports is all I can find, and they seem to say the chunk got a mile or two away then got frozen in the sea and was expect to move ‘later’.
Any idea where there are more up to date reports of it?
Nope. sorry
Perhaps You may find some informations here: https://wobleibtdieglobaleerwaermung.wordpress.com/2018/03/31/akute-wasserknappheit-emirates-wollen-rieseneisberg-a68-aus-der-antartktis-an-ihre-kueste-schleppen/
Thank-you Schneefan2015
I find it strange that the large chunk of ice that fell of the Antarctic, now called iceberg A68, and was slated to become the biggest disaster around there, is so hard to find up-to-date information for. Latest report all date from about a year ago and put the iceberg in the Arctic sea. One would think a trillion ton iceberg, and any bits that break off, would be (satellite) tracked somewhere.
Though pleasingly I read from one report a statement of reality…
“At the time of the July iceberg break, British researchers at Project MIDAS said there wasn’t evidence tying the iceberg to climate change. Yet, warming oceans and temperatures have been widely accepted as causes of other examples of deteriorating ice shelves.”
More at http://www.projectmidas.org/ though only up to July 2017.
UAH out for May. Globally, slight drop to 0.18 above 1981-2000 average
(remember that 1979 was the coldest time since 1900 in many places)
Big drop in NoPol to 0.18C anomaly
Down here its at -0.4C anomaly.
http://www.drroyspencer.com/2018/06/uah-global-temperature-update-for-may-2018-0-18-deg-c/
btw, That -0.4C anomaly in Australia makes it the 29th warmest may out of 40.
globally, 10th warmest May out of 40.
[…] P. Gosselin, June 01, 2018 in […]
[…] SOURCE […]