 Co-written by Kirye
Tokyo is a huge, sprawling megapolis on the island nation of Japan. With its great urbanization over the past decades, observers could expect to see some warming at least from the urban heat island effect as well as from the “huge” warming the planet has allegedly seen globally over the past 30 years.
But in Tokyo this has not been the case, surprisingly.
The two charts that follow depict temperature data of Tokyo over the past years. The first chart shows the temperature trend for each month, January through December since 1988:
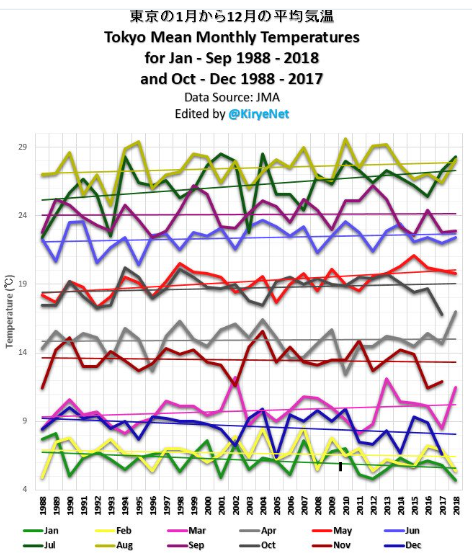
Looking at the chart, we can see that 6 months show a steady or even a cooling trend. Overall over the past 30 years, Tokyo has warmed modestly, but that warming trend, however, is mostly due to the colder years in the late 1980s and early 1990s.
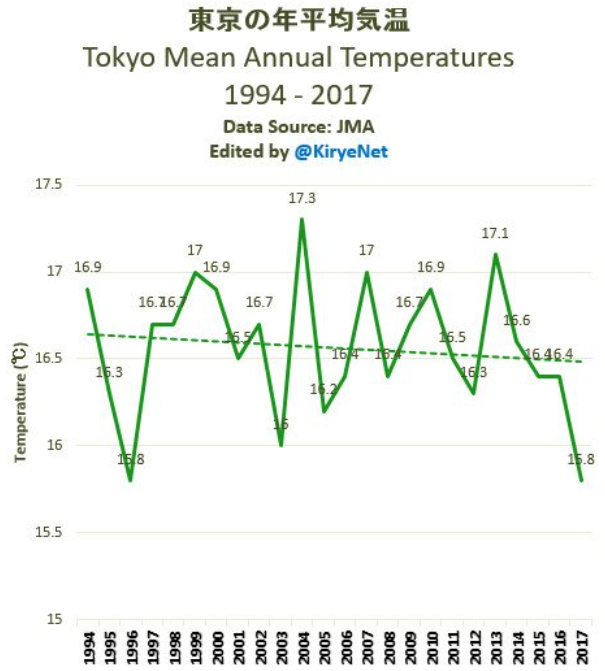
When looking back at the past 24 years, Tokyo has been cooling off:
Data source above charts: http://www.data.jma
Even more interesting is the fact that Japan’s capital and largest city has even seen an accelerating cooling over the recent years. The year 2017 was the coldest in over 20 years.
This contradicts claims of runaway warming that we often hear from climate warming alarmists.
Kyoto Cooling?
Also the trend is the same for the city of Kyoto, as is the case for many other cities in Japan:
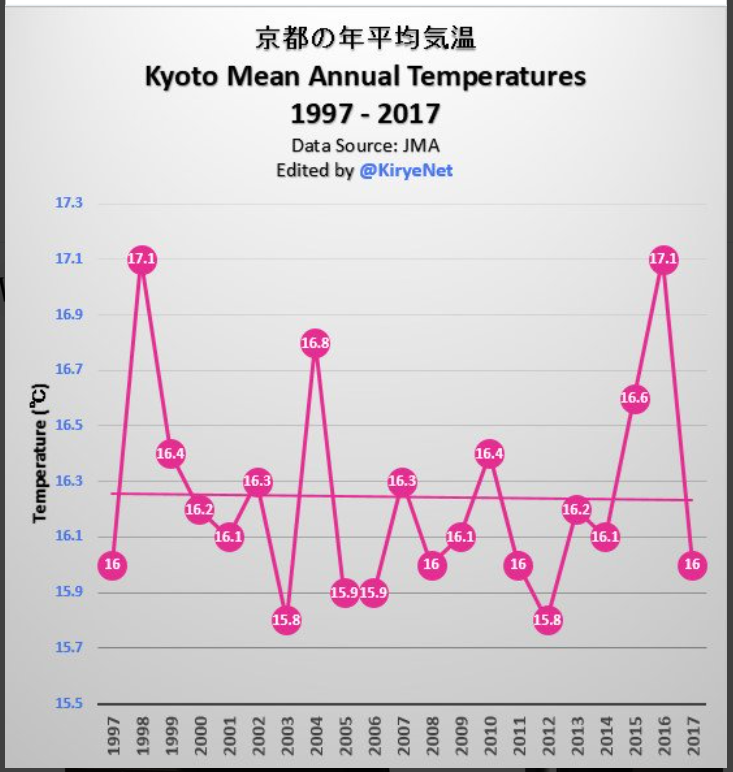
Kyoto has shown a slight cooling over the past 20 years, as have many other cities in Japan. Data source: http://www.data.jma.go.jp
Also the globe has been cooling since the peak that was brought on by the most recent powerful El Nino.


So this is what you call a contradiction? 😉
I’d say this contradicts the pseudoskeptic claim that all the warming comes from cities with their urban heat island effect. Don’t you agree?
Official temperature data for Japan in case you just forgot to mention that overall temperatures in Japan are increasing:
http://www.data.jma.go.jp/cpdinfo/temp/sum_jpn.html (use the dropdown to select a different season)
For the entire year:
http://www.data.jma.go.jp/cpdinfo/temp/an_wld.html
So … if big cities aren’t warming like the rest of the country, what does that say about the UHI effect and its role in those ever increasing temperature charts?
My Japanese is not real great but these charts refer to the World, do they not?
Whatever it says, this type of increase is reported nowhere else
I don’t know what ‘temperatures’ are referred to in this but get us something to confirm, will you please?
The first link refers to Japan, the second one is indeed wrong. This is the correct link to the yearly averages in Japan:
http://www.data.jma.go.jp/cpdinfo/temp/an_jpn.html
If your browser doesn’t support translating this into your local language:
https://translate.google.com/translate?hl=de&sl=ja&tl=en&u=http%3A%2F%2Fwww.data.jma.go.jp%2Fcpdinfo%2Ftemp%2Fan_jpn.html
The text below the graph reads:
“Thin line (black): deviation from the reference value of average temperature for each year, thick line (blue): 5 year moving average of deviation, straight (red): long-term change trend. The reference value is the average value for 30 years from 1981 to 2010.”
They calculate the average from the following 15 stations:
Abashiri, Nemuro, Suttsu (Suttsu), Yamagata, Ishinomaki, Fushiki (Takaoka),
Iida, Choshi, Grenze, Hamada, Hikone, Miyazaki, Tadotsu, Naze, Ishigaki
Must be super UHI effect locations then if cities like Tokyo and Kyoto don’t show warming 😉
Well that is a helpful translation thank you very much.
It says this is deviation from reference (assumed average) values over the years 1981-2010.
Would you mind explaining how, on this graph, all of the recorded deviations over these reference years are NEGATIVE?
How can this be? Wouldn’t these temperatures fluctuate around the zero?
There is a link to the actual values at the bottom of that page:
http://www.data.jma.go.jp/cpdinfo/temp/list/an_jpn.html
1981 -0.981982 -0,33
1983 -0,49
1984 -0,99
1985 -0,37
1986 -0,95
1987 -0.13
1988 -0,65
1989 +0.16
1990 +0,78
1991 +0,25
1992 -0.11
1993 -0,52
1994 +0.56
1995 -0.19
1996 -0,54
1997 +0,10
1998 +0,75
1999 +0,49
2000 +0,28
2001 -0.05
2002 +0,29
2003 -0.06
2004 +0,77
2005 -0.01
2006 +0.20
2007 +0.61
2008 +0,22
2009 +0,30
2010 +0.61
The average of those numbers is 0.
It simply isn’t the case and they do fluctuate around zero. The average anomaly in the 80s is -0.395°C, in the 90s it’s +0.107 and in the 2000s it’s +0.288°C
How many times do I have to post this before the trolls “get it.”
Those are not “temperatures,” but “temperature anomalies,” which, when seen in perspective, are just background noise.
https://www.youtube.com/watch?v=kwIixU1JyDU
I.e., they are nothing in comparison to the huge variations we see yearly, monthly, and even daily.
But it’s so much harder to scare people if you tell them the truth.
Fix THIS GRAPH in your mind, remember what it means, and you will never again be fooled by misused irrelevant data.
P.S. – My post of “Yonason 5. October 2018 at 12:40 AM ”
was referring to SebH’s links to graphs he posted in his “SebastianH 4. October 2018 at 9:04 PM “
I told you there was a STEP change in the late 1990’s (NOTHING TO DO WITH CO2)
Thanks for confirming it 😉
Zero trend since 1998, seb
https://i.postimg.cc/hvtxRkwv/Japan_post_1998.png
Zero trend from 1950-1990, seb
https://i.postimg.cc/RZCzL4Sp/japan1950-1990.png
Take the table I linked and do work the yourself.
Absolutely ZERO EVIDENCE of any warming from atmsospheric CO2 ANYWHERE, ANYTIME, ANYHOW
WOW seb has FINALLY located the NATURAL warming out of the LIA, COLDEST period in 10,000 years
Also identified the slight warming from the late 1970s COLDEST period since the LIA
WELL DONE SEB !!
Now, let’s see your proof that ANY of that was caused by human atmospheric CO2 rather than TOTALLY NATURAL causes, like say, a Grand Solar Maximum
Q1. In what way has the climate changed in the last 40 years, that can be scientifically attributable to human CO2 ?
Q2. Do you have ANY EMPIRICAL EVIDENCE at all that humans have changed the global climate in ANYWAY WHATSOEVER?
I think everyone is aware of us talking about anomalies. But referring to Lindzen on anything makes this a very special reply though. Mentioning that anomalies are small compared to even daily temperature changes is just the icing on the cake.
Next you will surely claim that the average change of your bank account anomaly pales when compared to the withdrawels and depositions and thus your monetary worth changing doesn’t really mean anything.
Maths really is a challenge for you, isn’t it seb-troll
If I have $100,000 in the ban, I wouldn’t be spending $1,000,000 to stop it going up and down by $10 a day.
Nor would I be going into a DEEP PANIC about what MIGHT happen in 20 years time.
But that is climate séance for you. !
@spike55 6. October 2018 at 9:48 PM
Nicely played. :o)
No seb, wrong as always
http://www.data.jma.go.jp/cpdinfo/temp/list/mon_jpn.html
Real Japanese data shows no warming since 1998
https://i.postimg.cc/hvtxRkwv/Japan_post_1998.png
And no warming from 1950-1990
https://i.postimg.cc/RZCzL4Sp/japan1950-1990.png
Whatever you have linked to is not Japanese based data.
And anyway, there is zero-evidence that any real warming has anything to do with human activity.
You have shown that CONCLUSIVELY, thanks.
Be very glad of the slight warming out of the LIA, the coldest period in the last 10,000 or so years.
It is exactly the same data from the same Japanese institution. The similarity of the URLs should have made that crystal clear to even you …
Your linked monthly temperature table is also visualized on their website as follows:
http://www.data.jma.go.jp/cpdinfo/temp/jan_jpn.html
http://www.data.jma.go.jp/cpdinfo/temp/feb_jpn.html
http://www.data.jma.go.jp/cpdinfo/temp/mar_jpn.html
and so on … use the drop down to see others months from that table.
That is an interesting twist on the inescapable logic that it can’t be the UHI in Japan if large cities are not warming, but the country as a whole is warming. Nice try at trolling, I almost fell for it 😉
EMPTY seb
ZERO-EVIDENCE seb.
Just shows that most of the Japanese sites are well maintained and not too subject to the massive.
Or that Japan has ACTUALLY BEEN COOLING.
And anyway, there is zero-evidence that any real warming has anything to do with human activity.
Your EMPTY mindless evasions keep proving me correct on that point
http://www.data.jma.go.jp/cpdinfo/temp/jan_jpn.html
great graph seb.
It CLEARLY shows COOLING between each jump
Showing that it has absolutely NOTHING to do with atmospheric CO2
You really should AT LEAST TRY to actually THINK about what the graph is showing before you post..
.. Save yourself the ignominy of yet another hilarious slap-stick faceplant.
Brian, my Japanese is close to zero. I’ll ask Kirye.
Vielen Dank.
Japan temperatures since 1998
https://i.postimg.cc/hvtxRkwv/Japan_post_1998.png
Nope, NOTHING there seb
Not warming
This September was 16th warmest in the last 40 years.
This is the result of Obama era collusion with Japan to “do something about global warming.”
Japan went along with the ridiculous Kyoto protocol etc etc
A reasonable question would be, without a UHI effect, how much cooler yet might it be?
data from http://www.data.jma.go.jp/cpdinfo/temp/list/mon_jpn.html
Shows NO WARMING since 1998,
And No warming from 1950-1990
https://i.postimg.cc/RZCzL4Sp/japan1950-1990.png
A small step change around the mid 1990s
Those links of seb’s are probably global fabrications, created from “once-was-data” sent by NCDC
I repeat it for you in plain words: those links are from the same website that you link to. How can this clear fact slip your attention? Or is this another case of “always claim the exact opposite of what this other dude says”?
Of course, it’s all fabricated data if you don’t agree with it *sigh* (only then don’t link to it yourself, that makes you look a bit confused).
Sorry you are INCAPABLE of taking the data and showing that I am CORRECT.
We know your abilities are truly limited.
Are you saying the NOAA/NCDC is NOT a total fabrication.
Are you saying you don’t recognise it when you see it.
REALLY ??
ROFLMAO
You suffer DENIAL to the very core of your emptymess.
You are truly a mad man. Not going to reply to the other nonsense you posted in various replied in the comments below this article.
This just a perfect example of a pseudoskeptic and disinformer doing his thing …
Wow, I’m sure seb-troll thinks I am deeply scarred by that juvenile taunt. 😉
But really, its nothing more than the cackling of a headless chook.
Everyone KNOWS that the stuff from NCDC/NOAA is not actually REAL, seb.. you should be more sceptical about the garbage put forward by your fellow AGW collaborators.
DNCWTRT
OOPS.
Wind turbines CREATE WARMING in the USA
https://wattsupwiththat.com/2018/10/04/harvard-wind-power-will-create-significant-warming-of-0-24c-plus-eat-up-5-to-20x-more-land-than-thought/
Take energy out of the winds, which COOL…
.. . what would you expect to happen.. DOH !!!
So human structures can significantly alter the climate, but emissions can’t because they are so small an insignificant. I wonder how pseudoskeptics like you make this work in their beliefsystem.
But then again, you managed to solve the contradiction that apparently the UHI effect is not what is warming Japan for yourself by just declaring Japan isn’t warming while looking at the same data as the rest of us 😉
Weirdo!
LOCAL climate vs Global climate
LEARN the difference, little seb-troll.
[…] Read more at No Tricks Zone […]
spike55 and SebastianH: you say you use the same temperature data of Japan but you get totally different graphs. How come?
Here’s the data, I just graph it.
http://www.data.jma.go.jp/cpdinfo/temp/list/mon_jpn.html
Like this….
https://i.postimg.cc/hvtxRkwv/Japan_post_1998.png
And like this….
https://i.postimg.cc/RZCzL4Sp/japan1950-1990.png
Going to seb’s graphs
http://www.data.jma.go.jp/cpdinfo/temp/jan_jpn.html
You have to wonder what loonie thinks it is actually in any way linear, and the red line means anything??
It actually shows strong cooling for NEARLY ALL of the time, with two very distinct jumps.
The questions should be,
“What caused those two large jumps?”
(certainly not atmospheric CO2, and
“What causes the general cooling between those jumps?”
(again, probably not atmospheric CO2)
And let’s remember, there was the coldest period in 10,000 years, ending some 50-70 years before the graph starts.
One would certainly HOPE for some warming to occur from that ANOMALOUSLY cold period.
[…] an interesting information concerning temperature trends at Tokyo on 4. October 2018, titled: “Tokyo Surface Temperature Shows No Trend Over Past Quarter Century…Cooling Now Accelerating”. With reference to the Figure on the left, they observe that the overall trend over the past […]