By Kirye
and Pierre Gosselin
It’s been long known that NASA GISS has been going through its historical temperature data archives and erasing old temperature measurements and replacing them with new, made up figures without any real legitimate reason.
This practice has led to the formation of new datasets called “adjusted” data, with the old datasets being called “V3 unadjusted”. The problem for global warming activists, however, was that when anyone looks at the old “V3 unadjusted” – i.e. untampered data – they often found a downward linear temperature trend. Such negative trends of course are an embarrassment for global warming alarmists, who have been claiming the planet is warming up rapidly.
The adjusted “unadjusted” data
So what to do? Well, it seems that NASA has decided to adjust its “V3 unadjusted datasets” and rename them as “V4 unadjusted”. That’s right, the adjusted data has become the new V4 “unadjusted” data.
And what kind of trend does the new “V4 unadjusted” data show?
You guessed it. The new V4 unadjusted data are now yielding warmed up trends, even at places where a cooling trend once existed.
This is how NASA uses its magic wand of fudging to turn past cooling into (fake) warming.
6 examples of scandalous mischief by NASA
What follows are 6 examples, scattered across the globe and going back decades, which demonstrate this scandalous mischief taking place at NASA.
No. 1
Punta Arenas, Chile. Here we see how a clear cooling trend has been warmed up by NASA to produce a slight cooling trend:
giss.nasa.gov/cgi-bin/gistemp/stdata_show_v3
giss.nasa.gov/cgi-bin/gistemp/stdata_show_v4
No. 2
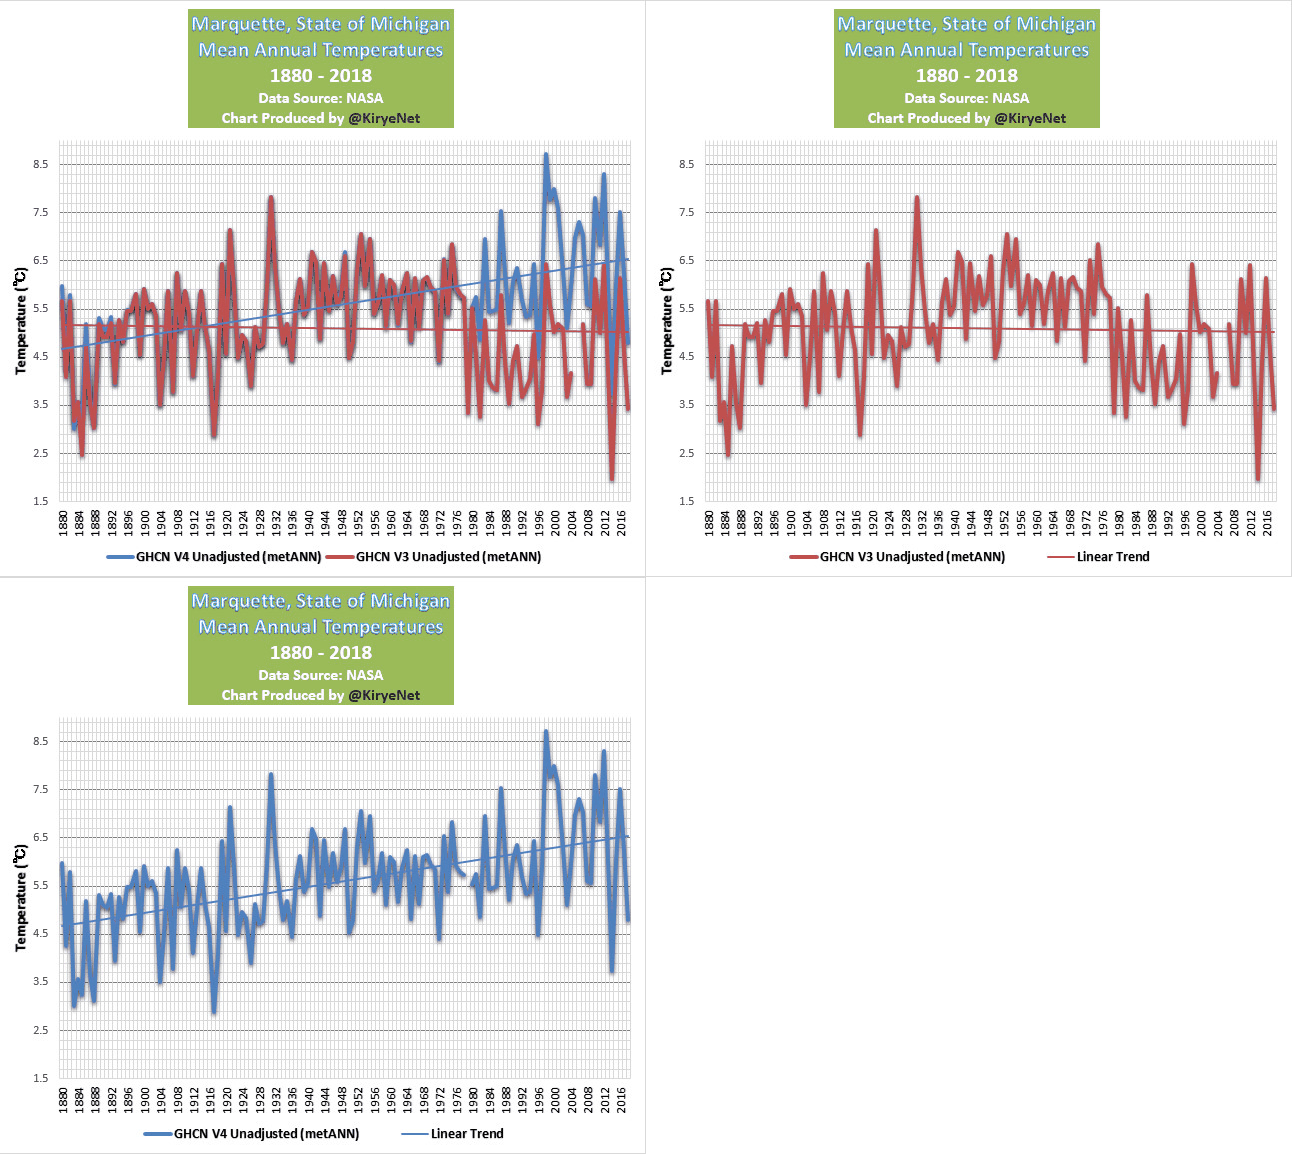
Marquette, Michigan: Here NASA have turned a slightly cooling trend into a robust warming trend, Little wonder Japanese climate scientist Dr. Mototaka Nakamura
giss.nasa.gov/cgi-bin/gistemp/stdata_show_v3
giss.nasa.gov/cgi-bin/gistemp/stdata_show_v4
No. 3
Port Elizabeth, South Africa. Here this 1o9 year old dataset has been altered to transform a no warming trend into a warming trend:
giss.nasa.gov/cgi-bin/gistemp/stdata_show_v3
giss.nasa.gov/cgi-bin/gistemp/stdata_show_v4
No. 4
Davis Antarctic. Data from the Japan Meteorological Agency, for example, show how this station has no trend, as do NASA’s V3 unadjusted data. But now NASA’s new V4 “unadjusted” data show that warming has arrived in Antarctica after all:
giss.nasa.gov/cgi-bin/gistemp/stdata_show_v3
giss.nasa.gov/cgi-bin/gistemp/stdata_show_v4
No. 5
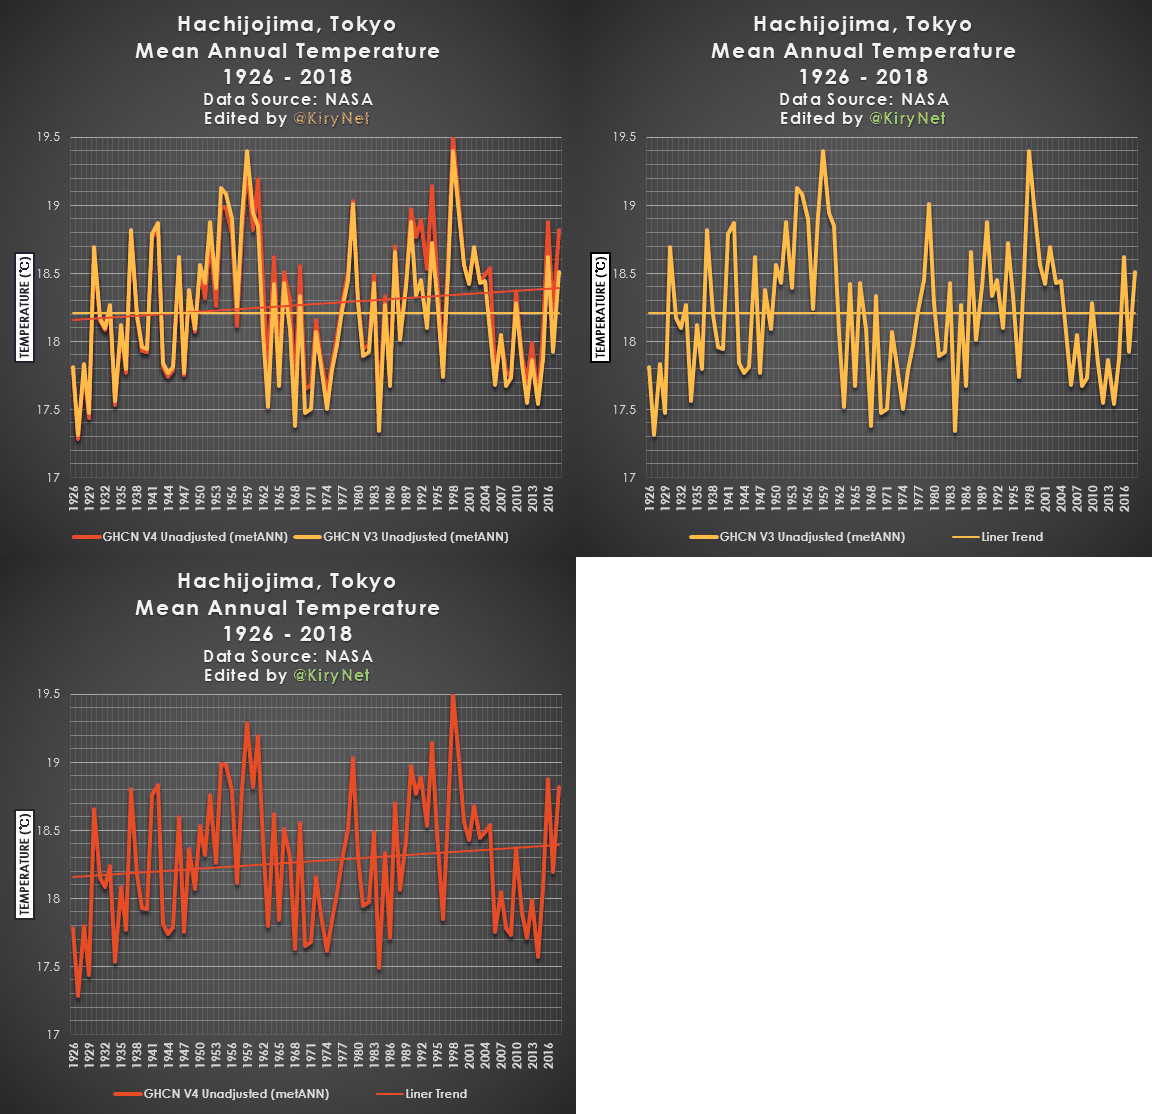
Hachijojima, Japan. The unadjusted V3 data from this remote island station used to show no trend – before NASA decided to create a new “unadjusted” dataset. And presto! We now have warming where none previously existed:
giss.nasa.gov/cgi-bin/gistemp/stdata_show_v3
giss.nasa.gov/cgi-bin/gistemp/stdata_show_v4
No. 6
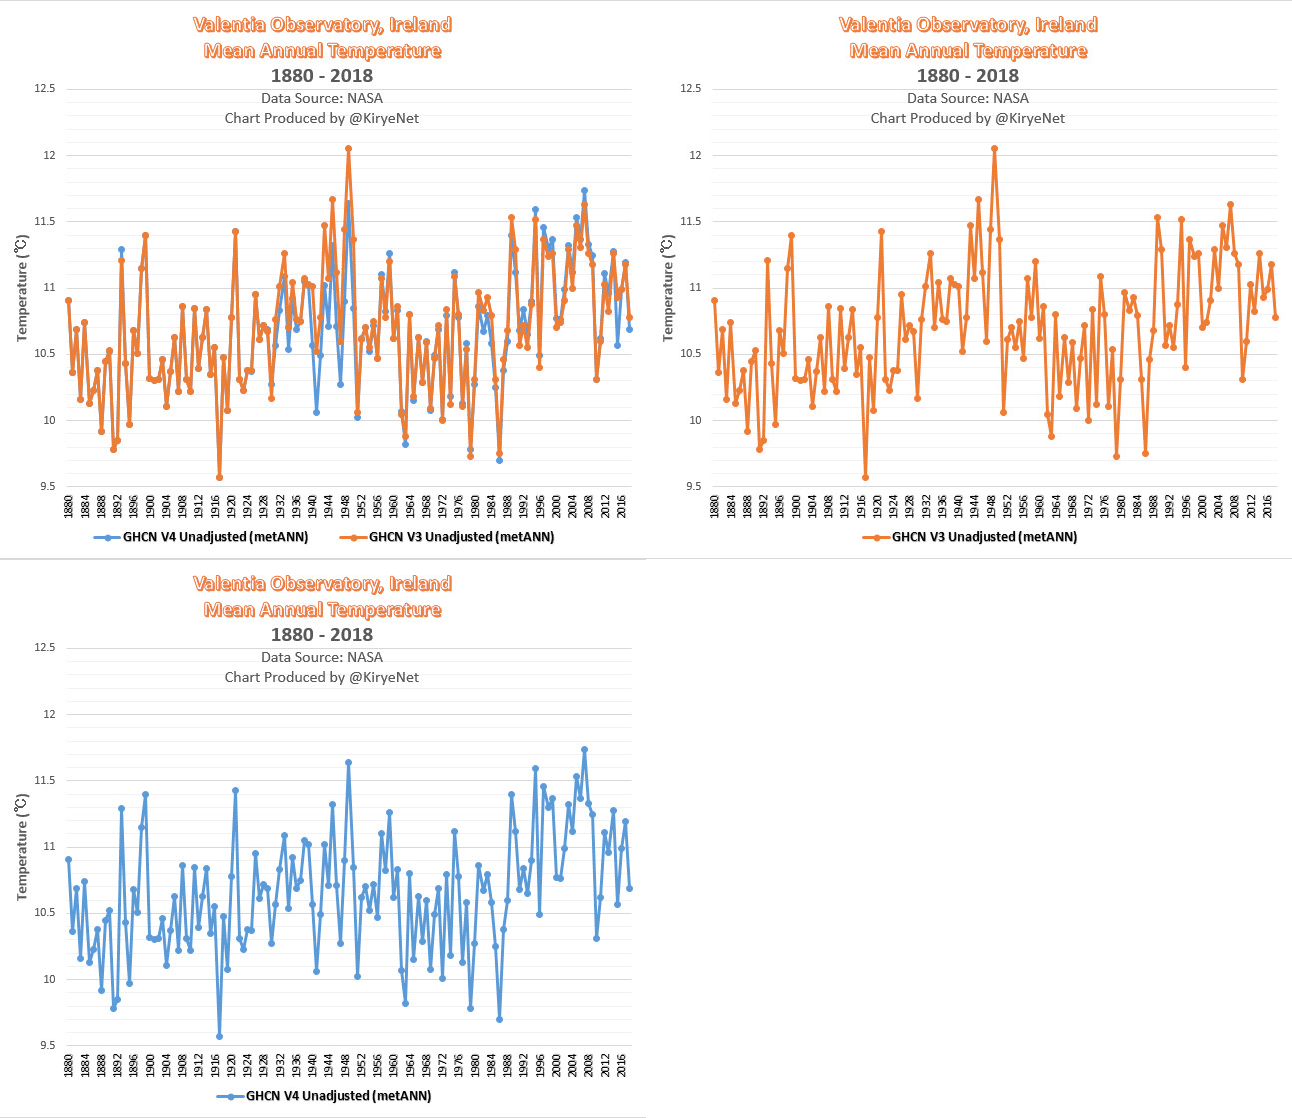
Valentia Observatory, Ireland. Here we see how parts of the past were cooled, while more recent mean temperatures were warmed up. Not to our surprise, what results is more warming.
giss.nasa.gov/cgi-bin/gistemp/stdata_show_v3
giss.nasa.gov/cgi-bin/gistemp/stdata_show_v4
At NASA the sun, oceans, water vapor, etc. don’t seem to matter when it comes to global temperature trends. The number one factor behind the “warming” at NASA appears not even to be CO2 but rather their Orwellian data fudging. At NASA, if the data do not agree with the (bogus) models, then just got back and change them!
Drain the NASA swamp.


Global warming data adjustment tool kit
https://i.postimg.cc/tgwBst3K/350.jpg
Truth? What ever happened to it? Hopefully, someone has downloaded the actual historical data to bring up at the proper time—Soon!
The only adjustments that should be made are made according to location of the recording unit (Climate Reference Network Rating Guide; CRNR; see below). These are very specific and can be found at this 2012 post by Anthony Watts: http://www.surfacestations.org/.
“Climate Reference Network Rating Guide – adopted from NCDC Climate Reference Network Handbook, 2002, specifications for siting (section 2.2.1) of NOAA’s new Climate Reference Network:
Class 1 (CRN1)- Flat and horizontal ground surrounded by a clear surface with a slope below 1/3 (<19deg). Grass/low vegetation ground cover 3 degrees.
Class 2 (CRN2) – Same as Class 1 with the following differences. Surrounding Vegetation 5deg.
Class 3 (CRN3) (error >=1C) – Same as Class 2, except no artificial heating sources within 10 meters.
Class 4 (CRN4) (error >= 2C) – Artificial heating sources = 5C) – Temperature sensor located next to/above an artificial heating source, such a building, roof top, parking lot, or concrete surface.”
Not just NASA
https://www.thegwpf.com/whatever-happened-to-the-global-warming-hiatus/
It’s happening all over
And not just temperatures either…..https://realclimatescience.com/2019/06/nasa-data-tampering-not-just-for-temperatures/
Sometimes a data set requires correction for known or suspected errors. In su h cases, the old and new data sets must both be preserved along with a detailed description of the rationale for making the adjustments.
Where are the written NASA Abstracts and Summaries that describe this reasons for these system wide and apparently systematic alterations of the original data?
I have seen some of NASA’s adjustments that fall outside the original error intetvals, (which gets my attention).
It is also suspicious that the adjustments all cool the past and warm the present…producing increasingly positive trends.
Surely these data adjustments have been reviewed and audited by many climate scientists. Where are the published results of these reviews.
Somebody’s signature(s) have to be on these wholesale adjustments.
NOAA has also made adjustments to historic temperature data. These adjustments have practically erased the 1940 thru 1970’s temperature decline that promoted talk of a coming ice age…like mid century scientists would interpret a three decade long 0.2 degree temperature decline as a harbinger of an ice age.
https://www.climate.gov/news-features/understanding-climate/climate-change-global-temperature
None of this matters. They have google. They have the institutions. They have a willingness to lie to get their way in any subject whatsoever. They don’t even hide it anymore. When you point out their lies they will just publish a bigger lie next.
The Republic and the west are lost. The normies will not see through this bullshit because most of them are too cowed by this fake authority the left pretends to have in every subject. Even walking people through failed prediction after failed prediction makes no difference. The claims they make cannot be falsified and they don’t care. They want your money and they want your children in chains and they think its funny.
I’m not a scientist.
Surely if 60, 70, 80 year-old measurements are thought unreliable for some reason, many would be handwritten by dedicated and conscientious chroniclers, they should be excluded from the record not changed.
What other branches of science post hoc alter 80 year old measurements?
Prof Humlum makes the powerful point:
“… a temperature record which keeps on changing the past hardly can qualify as being correct …”.
If you like your adjustments, you can keep your adjustments. Even if they’re wrong, they’re still right because we said so.
Out with the old, in with the new.
It is going to be in the 80 F range for the next few days, warmth is finally arriving.
Next thing you know the cAGW crackpots will be adjusting the temperature of the human body.
It’ll be catastrophic anthropogenic anthro warming, something like that.
Can’t be avoided.
Bias
“A predisposition or a preconceived opinion that prevents a person from impartially evaluating facts that have been presented for determination; a prejudice.”
These facts aren’t facts anymore and we have to make them new facts, even if they’re fake facts, they’re facts just the same.
It is easy to ruffle the feathers of the cAGW kooks, they’re very sensitive, triggered instantly. lol
They have become mean-spirited about it all.
It’s not that bad, people fail all of the time, been like that for longer than anybody can remember.
Pride goeth before fall.
They blatantly lie on just every thing :
Here is one Mann crazy statement, I read on WUWT :
https://wattsupwiththat.com/2016/12/02/climate-advocate-outrage-over-global-cooling-congress-tweet/
Extract from the Guardian :
“Why is 2016 smashing heat records?
… according to Professor Michael Mann, the director of Penn State Earth System Science Centre. He said it was possible to look back over the temperature records and assess the impact of an El Niño on global temperatures.
“A number of folks have done this,” he said, “and come to the conclusion it was responsible for less than 0.1C of the anomalous warmth. In other words, we would have set an all-time global temperature record [in 2015] even without any help from El Niño.”
In order to see if this bold claim can stand actual data, see for example :
http://www.climate4you.com/
And expect them to lie in other fields also, here is another example :
– in astrophysics, with respect to the TSI and the solar activity, as Nicola Scafetta & All. pointed out (see :
https://notrickszone.com/2019/03/25/satellite-evidence-affirms-solar-activity-drove-a-significant-percentage-of-recent-warming/
and :
https://www.hindawi.com/journals/aa/2019/1214896/)
The more observations contradict the climate doomsters, the more they will have to lie and commit fraud.
[…] Ref.: https://notrickszone.com/2019/06/25/adjusted-unadjusted-data-nasa-uses-the-magic-wand-of-fudging-pro… […]
[…] P. Gosselin, June 25, 2019 in […]
Maladjustment – It’s a pathological condition.
If climate “scientists” do this to the data…
https://realclimatescience.com/2019/06/nasa-data-tampering-not-just-for-temperatures/
…what wouldn’t they be willing to do to their fellows?
Not only have adjustments been made to the original readings, second adjustments have been made to the first adjustments and third adjustments to the second ones. Witness the change in NASA data from 1981 to 2001, then again in 2017 and now in 2019. Further, made-up fake data has been added into NASA and NOAA’s heat maps by “interpolating” between actual weather station data points to create data where none is recorded. It is utter fraud. They know it. They don’t care because the ends justifies the means in their minds.
[…] on this site under the fair use doctrine. We obtained it from the NoTricksZone at this link: Adjusted “Unadjusted” Data: NASA Uses The “Magic Wand Of Fudging”, Produces Warming Where There Never Was . […]
Come on people. They even explained it.
https://data.giss.nasa.gov/gistemp/history/
Yes indeed Danielle McCool,
From your link, they do seem to think they KNOW what temperature the Earth should be, and they will keep adjusting till it reaches their requirements.
“Over the years the estimates of what the global mean temperature anomaly has been have changed. There are two main reasons for these changes – updates to the analysis method and expansions to the sources of raw data. … “
Nice inverted logic there “updates to the analysis method” is making the data fit the theory, and “expansions to the sources of raw data” actually is a contraction in the number of sources of raw data.
In a perfect world all of the data and methods (including all code) would be open for examination, every adjustment to every station would have a signed statements for the reasons why the data was adjusted.
If Trump could do just one thing it is to ensure all data and methods were made open and transparent at GISS.
The foxes tell you the chickens are only safe with them. And you believe them?!
Problem is, there is too much evidence their adjustments are NOT justifiable, and they are NOT acting in good faith.
https://m.youtube.com/watch?v=Gmc5w2I-FCA
Also, how do they justify this?
https://realclimatescience.com/2019/03/nasa-now-tampering-with-raw-data-too/
They cannot be trusted!
Actually, NASA did NOT explain their historical record temperature adjustments.
From the link you cite:
To summarize, no raw data has changed over the years (except for minor quality control, elimination of duplicate data, etc.), but the GISTEMP analysis has varied because of the addition of more observations and changes in methodology. The GISTEMP analysis does not change the raw observations over time (these are curated by weather services around the world), but rather the estimate of the global mean change varies as we discover and correct for contaminating influences, as well as increasing the amount of raw data used.
However, this article rather definitely shows the exact opposite of what you imply: NASA HAS changed historical data. NASA has not explained their rationale for doing so.
Altering raw data requires significant justification for why the alterations occurred. NASA HAS NOT provided that justification. There are numerous Scientific Method reasons for requiring such justification, not the least of which is the requirement for reproducibility. Reproducibility is a requirement such that others may verify the results by reproducing the methodology that produced those results.
An example of this is cold fusion. The authors of the paper that claimed that they had produced cold fusion had to withdraw the paper and the claim when other scientists could not reproduce their results. The authors justifiably suffered significant loss of professional credibility as a result. There are numerous similar examples available.
Here is an index of Tony Heller’s articles on the fraudulent adjustments.
https://realclimatescience.com/?s=Adjustments+
Warmists cannot be trusted!
Here’s data for Darwin with v4 unadj seen in light yellow.
https://data.giss.nasa.gov/cgi-bin/gistemp/stdata_show_v4.cgi?id=ASN00014015&ds=14&dt=1
Here is the original version as shown unto 2010/11.
https://data.giss.nasa.gov/cgi-bin/gistemp/show_station.cgi?id=501941200004&dt=1&ds=1
Make of it what you will.
Looks like it’s undergone multiple “adjustments.”
While in statistics it’s occasionally permissible to adjust some data, but never to that extent. Both the amount that’s changed and the magnitude of each change are strictly limited. They exceed both to a criminal degree (it’s official data, and there are laws governing it’s handling, which they seem to be violating with impunity).
Good links. Thx.
[…] Link: https://notrickszone.com/2019/06/25/adjusted-unadjusted-data-nasa-uses-the-magic-wand-of-fudging-pro… […]
[…] Link: https://notrickszone.com/2019/06/25/adjusted-unadjusted-data-nasa-uses-the-magic-wand-of-fudging-pro… […]
[…] https://notrickszone.com/2019/06/25/adjusted-unadjusted-data-nasa-uses-the-magic-wand-of-fudging-pro… […]
[…] Pierre Gosselin’s blog there’s a guest post by Kirje from Japan, on NASA GISS temperature adjustments. In the latest GISS version, V4, the supposedly “unadjusted” data sets are different from the […]
[…] Adjusted “Unadjusted” Data: NASA Uses The “Magic Wand Of Fudging”, Produces … […]
[…] https://notrickszone.com/2019/06/25/adjusted-unadjusted-data-nasa-uses-the-magic-wand-of-fudging-pro… […]
[…] https://notrickszone.com/2019/06/25/adjusted-unadjusted-data-nasa-uses-the-magic-wand-of-fudging-pro… […]
[…] Pierre Gosselin’s blog, there’s a guest post by Kirje from Japan, on NASA GISS temperature adjustments. In the latest GISS version, V4, the supposedly “unadjusted” data sets are different from the […]
[…] No Tricks Zone picks up the theme in a post titled “Adjusted ‘Unadjusted Data: NASA Uses The ‘Magic Wand Of Fudging’, Produces Warming Where There Never Was.” […]
[…] No Tricks Zone picks up the theme in a post titled “Adjusted ‘Unadjusted Data: NASA Uses The ‘Magic Wand Of Fudging’, Produces Warming Where There Never Was.” […]
[…] No Tricks Zone picks up the theme in a post titled “Adjusted ‘Unadjusted Data: NASA Uses The ‘Magic Wand Of Fudging’, Produces Warming Where There Never Was.” […]
[…] post is prompted by a recent blog post at NoTricksZone: Adjusted “Unadjusted” Data: NASA Uses The “Magic Wand Of Fudging”, Produces Warming Where Th…, and a related Twitter conversation by Kirye, one of the authors of that NoTricksZone blog post. […]
[…] NoTricksZone on June 25, Pierre Gosselin posts some work by a Japanese guy named Kirye. Kirye is a Japanese climate skeptic […]
[…] es einen Beitrag von Kirye aus Japan über die Temperatur-Adjustierungen des GISS bei der NASA (hier, auf Deutsch beim EIKE hier). In der jüngsten GISS-Version V4 unterscheiden sich die vermeintlich […]
[…] es einen Beitrag von Kirye aus Japan über die Temperatur-Adjustierungen des GISS bei der NASA (hier, auf Deutsch beim EIKE hier). In der jüngsten GISS-Version V4 unterscheiden sich die vermeintlich […]
Interesting material relevant to this topic
https://notalotofpeopleknowthat.wordpress.com/2019/07/05/marc-morano-on-bad-data/
[…] https://notrickszone.com/2019/06/25/adjusted-unadjusted-data-nasa-uses-the-magic-wand-of-fudging-pro… […]
[…] https://notrickszone.com/2019/06/25/adjusted-unadjusted-data-nasa-uses-the-magic-wand-of-fudging-pro… […]
[…] Adjusted “Unadjusted” Data: NASA Uses The “Magic Wand Of Fudging”, Produces … […]
[…] https://notrickszone.com/2019/06/25/adjusted-unadjusted-data-nasa-uses-the-magic-wand-of-fudging-pro… […]
[…] a piece entitled The “Magic Wand of Fudging” Produces Global Warming. It reprises a post in No Tricks Zone that describes how NASA GISS and in turn NOAA has been adjusting historical temperature data […]
People, NASA is not “adjusting” historical data. What they call the “unadjusted” data are the yearly means which, of course, are not direct means but were acquired through statistical analysis. They changed their algorithms and starting from 1973 they began extrapolating the missing data from the nearby stations because they had more coverage. Therefore, they have the older means without this extrapolation and the newer means.
[…] Pierre Gosselin’s blog there’s a guest post by Kirje from Japan, on NASA GISS temperature adjustments. In the latest GISS version, V4, the supposedly “unadjusted” data sets are different from the […]