While Japan’s own temperature data show no warming for Tokyo, NASA tampers with the data to make it look like it’s been warming!
Charts by Kirye
Text by Pierre
Not long ago we looked at the 2021 mean temperature data from the Japan Meteorological Agency (JMA) for Tokyo and its rural Hachijō-jima island in the Pacific. The JMA data for Tokyo show that the megalopolis has in fact been cooling off since 1994.
Today we plot the JMA data, the NASA Unadjusted Version 4 and NASA’s Version 4 Adjusted Homogenized (altered) data for Tokyo on one chart:

NASA manipulated the data until it shows warming. Data sources: JMA, NASA
As the chart above shows, NASA’s Version 4 Unadjusted data plot is very similar to the JMA data, both showing no warming since 1994.
But then NASA altered the data, and now its so-called V4 “Adjusted Homogenized” plot suddenly shows a ruddy warming trend. The JMA data, we suppose, isn’t good enough, and so NASA took it upon themselves to fix it up. Don’t believe the Japanese data!
Hachijō-jima
Next we look at the Tokyo island of Hachijō-jima, some 287 km in the Pacific, and thus isolated from the urban sprawl of concrete, steel and asphalt we have in Tokyo. We look at the mean annual temperatures going back to 1950 from both NASA and the JMA:
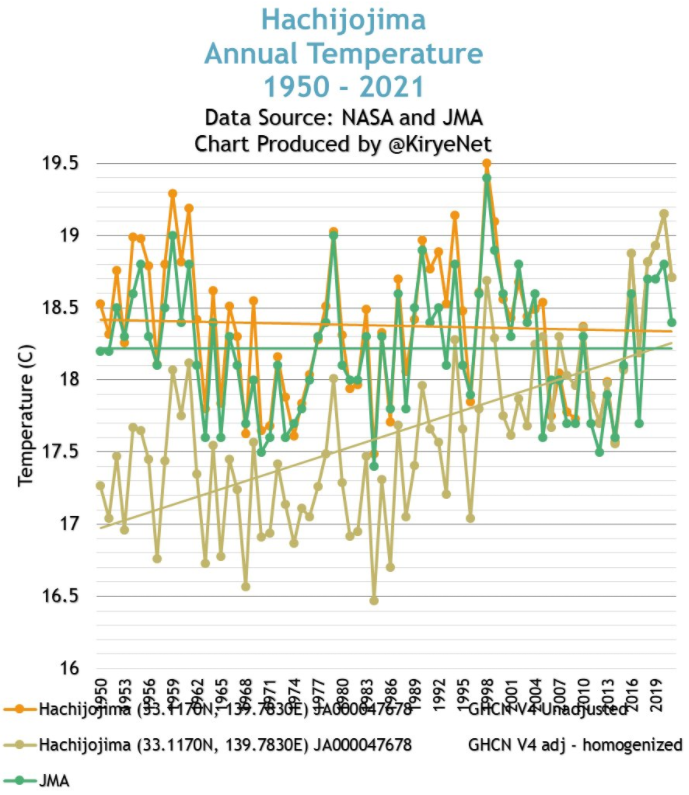
Don’t believe the Japanese data, because NASA says it’s not adequately tabulated. Let NASA fix it for you. Warming! Data sources: JMA, NASA.
Once again we see that the story is exactly the same: NASA tampered with the data and now its V4 Adjusted Homogenized data plot shows a strong warming trend since 1950. This is in stark contrast to what the JMA data plot shows and what NASA’s V4 Unadjusted data depict.
It appears NASA takes over good data from other countries, ignores what the country itself tabulated, and then tampers with it until they get the warming trend they want. Then they tell the public the globe is warming everywhere and that the Japanese data are too poorly tabulated to be used.


Check Darwin for adjustments. Raw data in very light yellow. https://data.giss.nasa.gov/cgi-bin/gistemp/stdata_show_v3.cgi?id=501941200000&ds=5&dt=1
Darwin before the 2010 adjustments.
https://data.giss.nasa.gov/cgi-bin/gistemp/show_station.cgi?id=501941200004&dt=1&ds=1
I was under the impression that other countries consider NASA methods the gold standard, so have adopted them for all temp measures to be standardized across the world. Good if the one you’re copying is high quality. In this case, not so much.
OT, but thought you might like this
https://www.youtube.com/watch?v=9UHvwWWcjYw
Number of people who died of C19 with no other underlying causes 2020 through to September 2021
17,371 deaths
Fascinating, though not surprising.
According to the VAERS data in the US there are ~20,000 due to the “vaccine” and in Europe there are ~30,000 according to their equivalent of VAERS. And everyone agrees that those numbers are only a fraction of the real toll.
I’ll forego the boosters and take my chances with the virus. (Yeah, I got conned into the first two Moderna almost a year ago. Hopefully I and any other’s likewise fooled will survive them.
Not all shots were designed to kill, though. If you took any, you had a 1/200 chance of getting one that caused death or disability. When this goes to court, there will be no shortage of defendants.
https://www.bitchute.com/video/GNUZPESP3rKL/
As the lawyer says, there is no immunity if it’s premeditated, as the evidence seems to clearly show.
I can’t see color codes for NASA on the charts (GHCN).
Hi, Tony.
I think the the UHCN unadjusted goes with the line opposite it to the left, as does the UHCN adj(usted) go with what’s to the left of it. So they don’t get sepperate colors. I think that’s right, and I hope it’s clear.
[…] Japan’s Own Data Show No Warming For Tokyo…But NASA Tampers, Changes Trend To Warming! […]
I did a quick study with the Japan data from Tokyo and HACHIJOJIMA. I used the annual temperature average from 1907 to 2021, because that’s where the value starts on the island of HACHIJOJIMA. I used the first period from 1907 to 1957 and then from 1958 to 2021. I have chosen the year 1958 because it is the oldest continuous measurement of CO2 (Hawaii) and after that there began to be a significant increase in the atmosphere. The result shows that the temperature in the period from 1958 to 2021 rose much less in HACHIJOJIMA than in the previous period ??? I did a linear regression for the data and the result is as follows and it is easy to check:
Tokyo Temp. increase ºC = 1907 a 1957 –>1,215 / 1958 a 2021 –>1,613
HACHIJOJIMA Temp. Increase ºC =1907 a 1957 –>0,405 / 1958 a 2021–> 0,126
Some data, provided by Kiyre and Pierre in a previous post on the topic
https://www.data.jma.go.jp/obd/stats/etrn/view/monthly_s3_en.php?block_no=47678&view=1
From here
https://notrickszone.com/2020/09/04/hachijojima-isolated-rural-island-in-pacific-shows-no-warming-in-80-years/
[…] Japan’s Own Data Show No Warming For Tokyo…But NASA Tampers, Changes Trend To Warming! […]
[…] https://notrickszone.com/2022/01/19/japans-own-data-show-no-warming-for-tokyo-but-nasa-tampers-chang… […]